| Param | Original file | Final file |
|---|---|---|
| Filename | modeM0/AS1T04_051T01_9000004686_32096cztM0_level2.evt | modeM0/AS1T04_051T01_9000004686_32096cztM0_level2_quad_clean.evt |
| Size (bytes) | 792,673,920 | 99,786,240 |
| Size | 756.0 MB | 95.2 MB |
| Events in quadrant A | 3,382,764 | 667,451 |
| Events in quadrant B | 8,192,813 | 632,154 |
| Events in quadrant C | 6,020,191 | 618,289 |
| Events in quadrant D | 5,941,387 | 618,875 |
| Mode M0 | |||
|---|---|---|---|
| Quadrant | BADHDUFLAG | Total packets | Discarded packets |
| A | 0 | 14490 | 0 |
| B | 0 | 29268 | 0 |
| C | 0 | 22458 | 0 |
| D | 0 | 22411 | 0 |
| Mode SS | |||
|---|---|---|---|
| Quadrant | BADHDUFLAG | Total packets | Discarded packets |
| A | 0 | 138 | 0 |
| B | 0 | 138 | 0 |
| C | 0 | 138 | 0 |
| D | 0 | 138 | 0 |
| Quadrant | Total seconds | Saturated seconds | Saturation percentage |
|---|---|---|---|
| A | 6959 | 109 | 1.566317% |
| B | 6959 | 1369 | 19.672367% |
| C | 6959 | 1108 | 15.921828% |
| D | 6960 | 329 | 4.727011% |
Noise dominated data is calculated using 1-second bins in cleaned event files. If a bin has >2000 counts, and if more than 50% of those come from <1% of pixels, then it is considered to be noise-dominated and hence unusable.
| Quadrant | # 1 sec bins | Bins with >0 counts | Bins with >2000 counts | High rate bins dominated by noise | Noise dominated (total time) | Noise dominated (detector-on time) | Marked lightcurve |
|---|---|---|---|---|---|---|---|
| A | 6959 | 6959 | 0 | 0 | 0.00% | 0.00% | 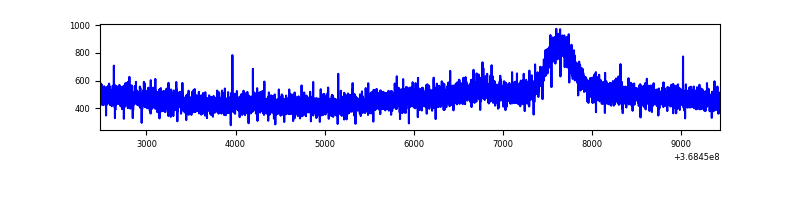 |
| B | 6959 | 6959 | 662 | 662 | 9.51% | 9.51% | 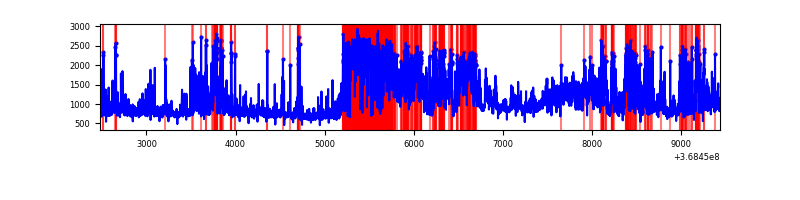 |
| C | 6959 | 6959 | 643 | 643 | 9.24% | 9.24% | 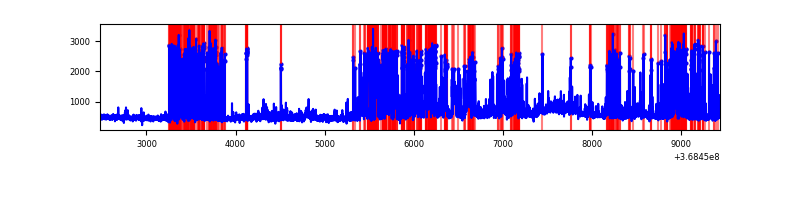 |
| D | 6960 | 6960 | 188 | 188 | 2.70% | 2.70% | 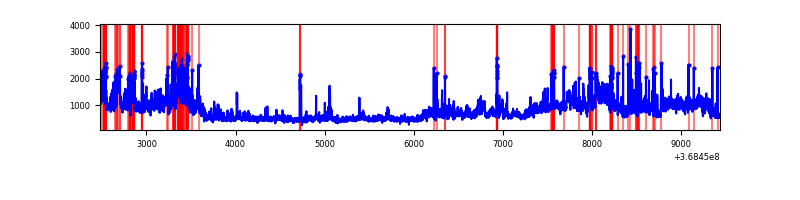 |
Top three noisy pixels from each quadrant. If the there are fewer than three noisy pixels in the level2.evt file, extra rows are filled as -1
| Pixel properties | Quadrant properties | ||||||
|---|---|---|---|---|---|---|---|
| Quadrant | DetID | PixID | Counts | Sigma | Mean | Median | Sigma |
| A | 13 | 254 | 13920 | 73.46 | 874 | 855 | 177.9 |
| A | 3 | 137 | 8986 | 45.72 | 874 | 855 | 177.9 |
| A | 0 | 226 | 7521 | 37.48 | 874 | 855 | 177.9 |
| B | 10 | 245 | 2764471 | 17431.2 | 821 | 801 | 158.5 |
| B | 6 | 159 | 1865705 | 11762.44 | 821 | 801 | 158.5 |
| B | 5 | 172 | 129603 | 812.39 | 821 | 801 | 158.5 |
| C | 0 | 10 | 2721151 | 14669.5 | 789 | 793 | 185.4 |
| C | 14 | 238 | 155219 | 832.74 | 789 | 793 | 185.4 |
| C | 14 | 254 | 41347 | 218.69 | 789 | 793 | 185.4 |
| D | 8 | 195 | 1295129 | 6444.12 | 835 | 811 | 200.9 |
| D | 12 | 79 | 817129 | 4064.26 | 835 | 811 | 200.9 |
| D | 12 | 227 | 363155 | 1804.03 | 835 | 811 | 200.9 |
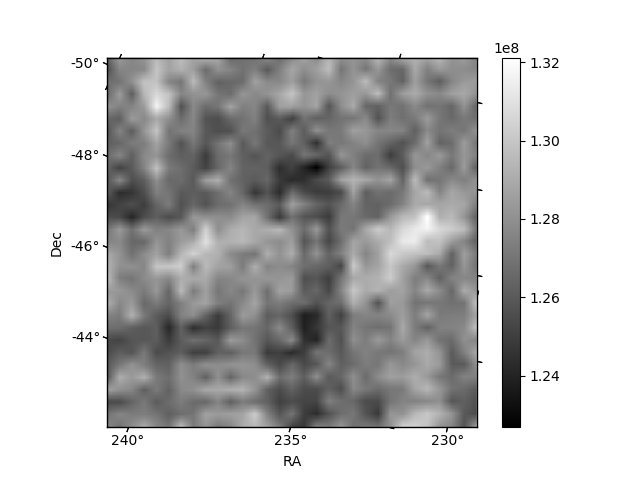
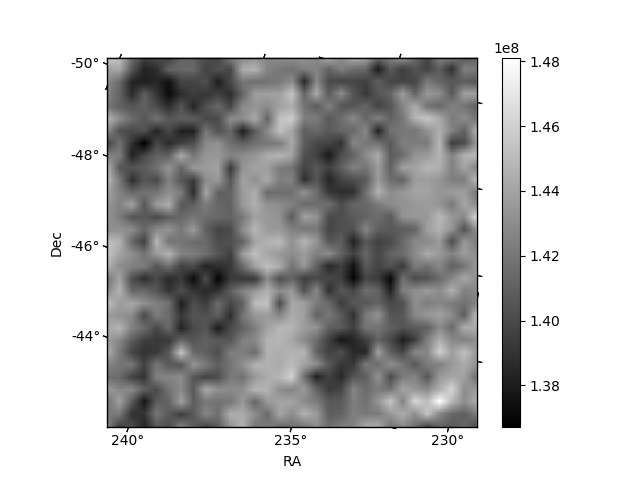
Histogram calculated using DETX and DETY for each event in the final _common_clean file
| Quadrant A | 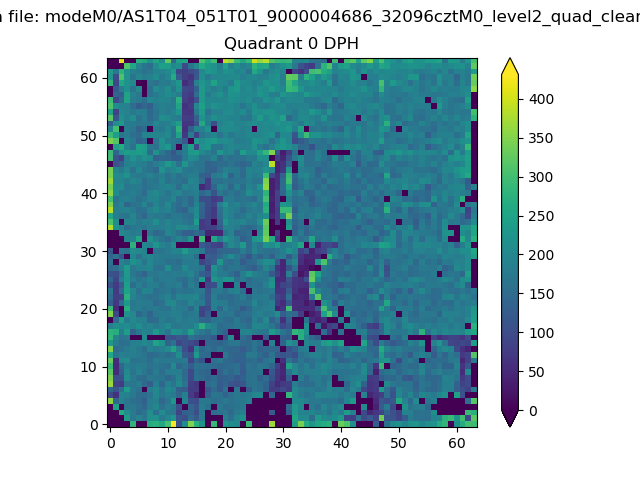 |
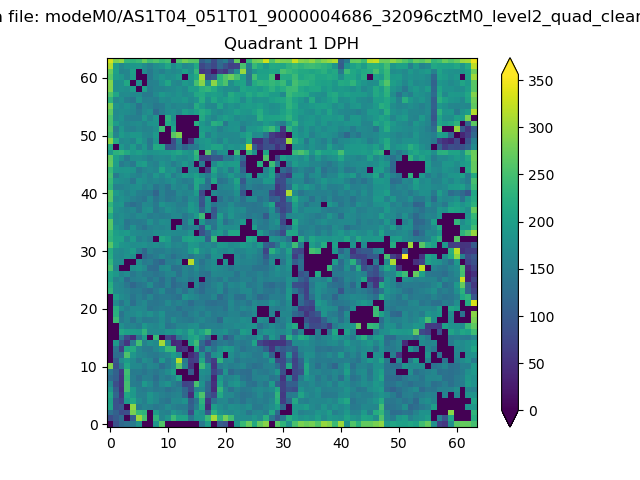 |
Quadrant B |
|---|---|---|---|
| Quadrant D | 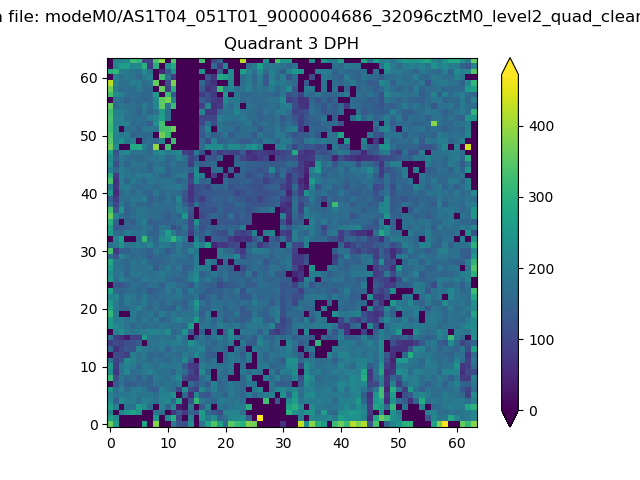 |
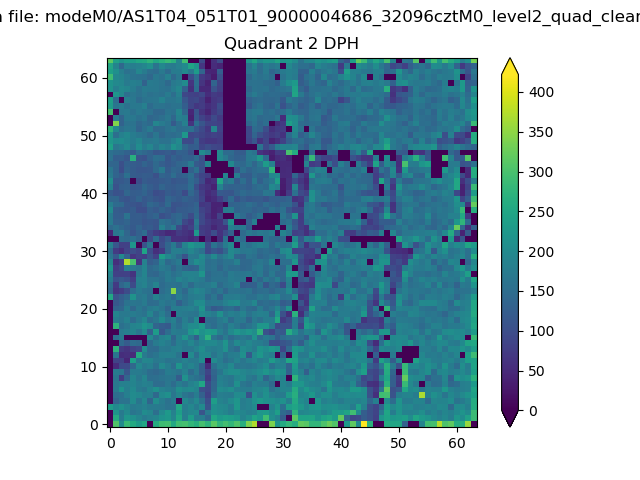 |
Quadrant C |
| Plot type | Count rate plots | Images |
|---|---|---|
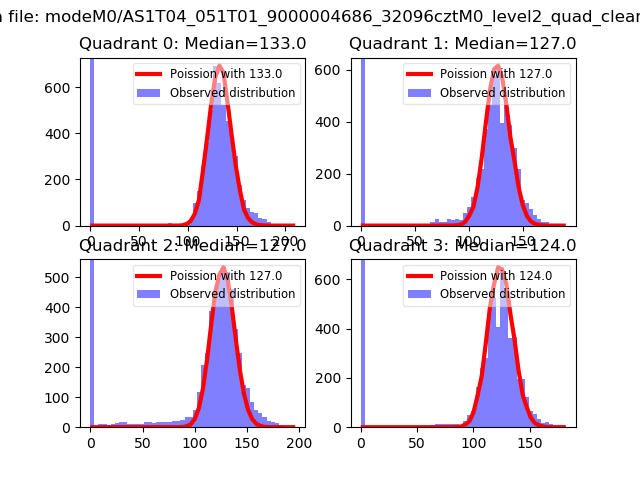
| Comparison with Poisson distribution Blue bars denote a histogram of data divided into 1 sec bins. Red curve is a Poisson curve with rate = median count rate of data. |
 |
 |
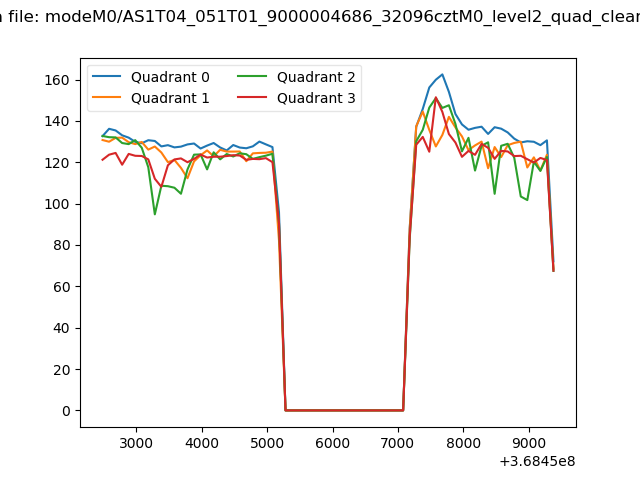
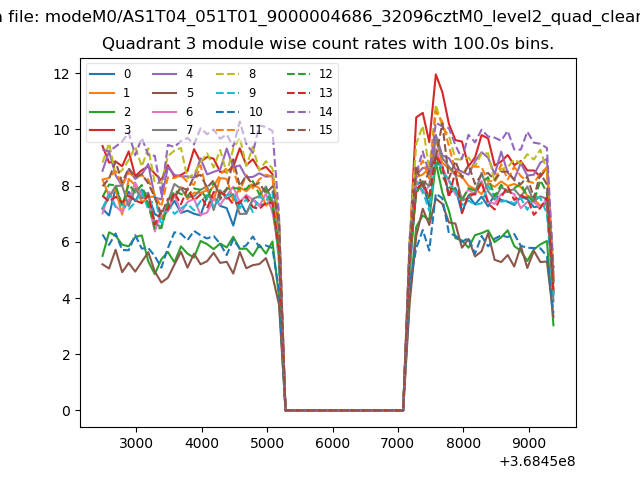
| Quadrant-wise count rates Data is divided into 100 sec bins |
 |
|
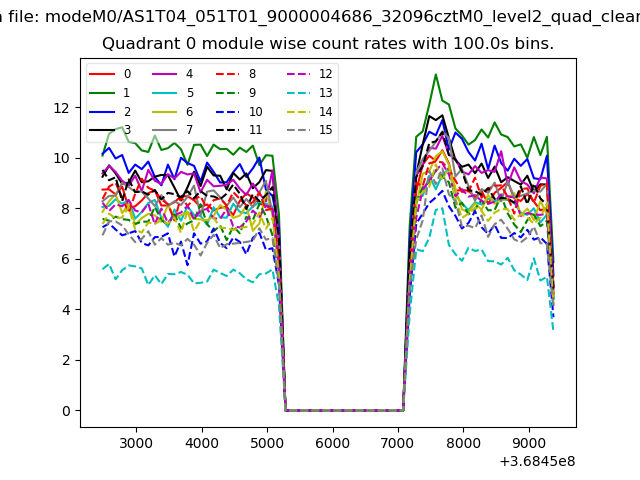
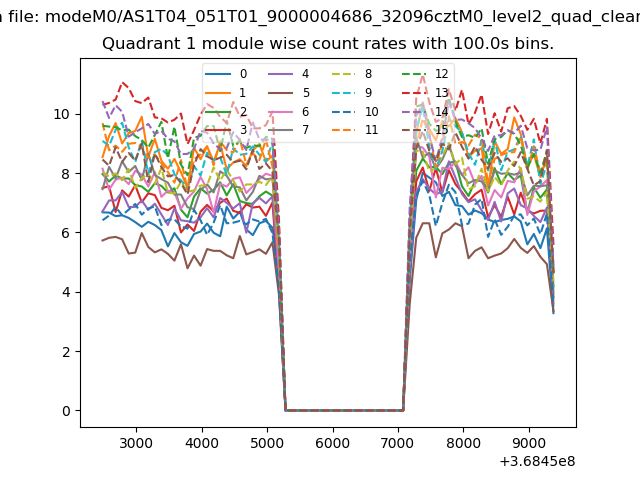
| Module-wise count rates for Quadrant A Data is divided into 100 sec bins |
 |
 |
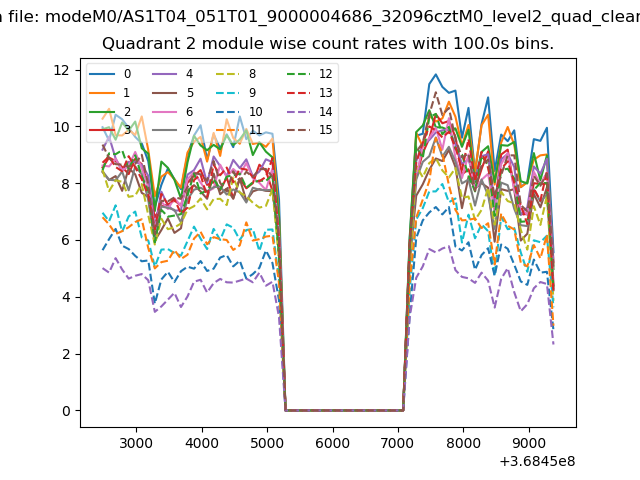
| Module-wise count rates for Quadrant B Data is divided into 100 sec bins |
 |
 |
| Module-wise count rates for Quadrant C Data is divided into 100 sec bins |
 |
 |
| Module-wise count rates for Quadrant D Data is divided into 100 sec bins |
 |
 |
| Parameter | Plot |
|---|---|
| CZT HV Monitor | 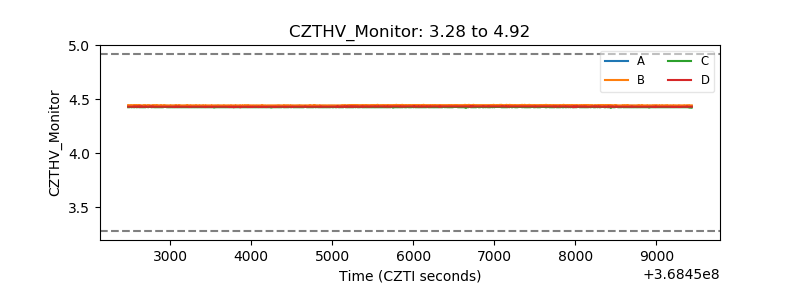 |
| D_VDD | 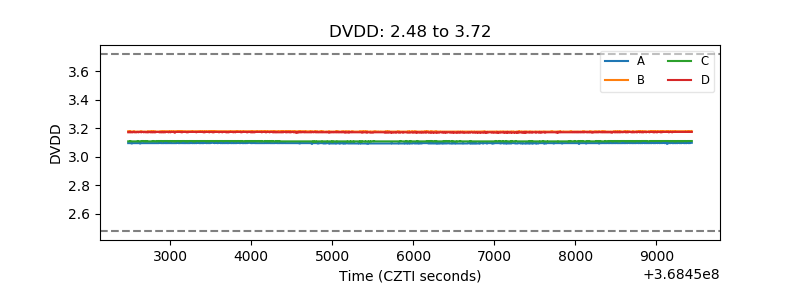 |
| Temperature 1 | 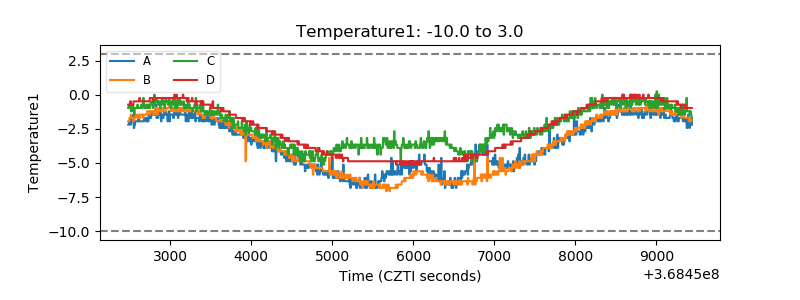 |
| Veto HV Monitor | 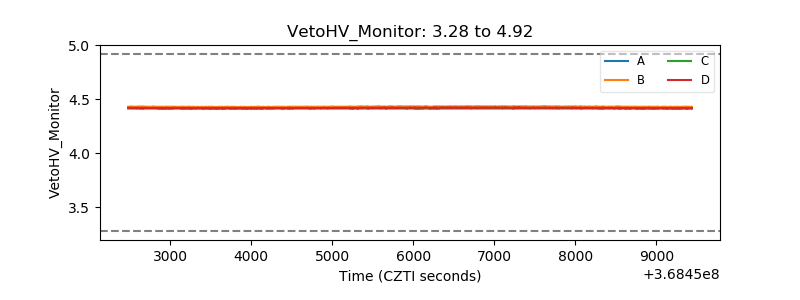 |
| Veto LLD |  |
| Alpha Counter | 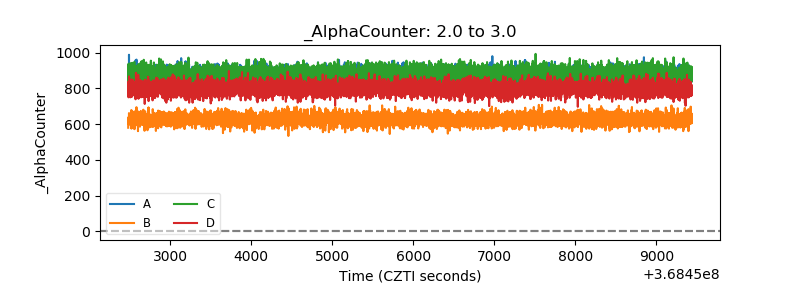 |
| _CPM_Rate | 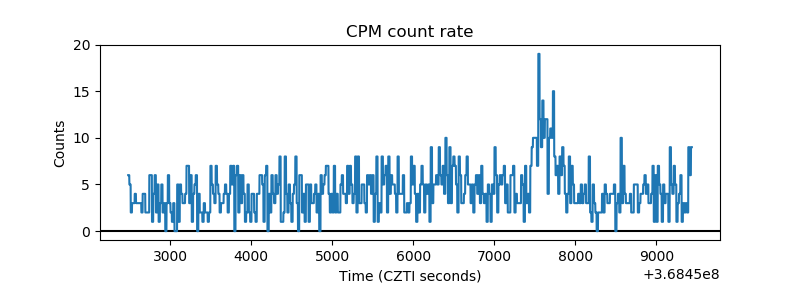 |
| CZT Counter | 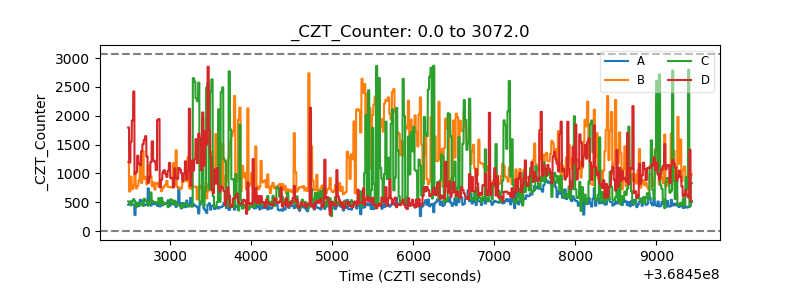 |
| +2.5 Volts monitor |  |
| +5 Volts monitor |  |
| _ROLL_ROT | 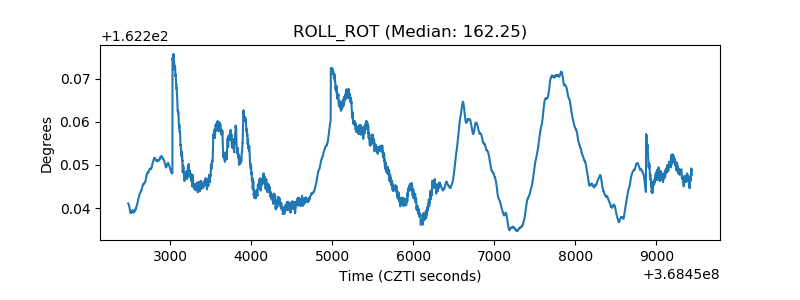 |
| _Roll_DEC | 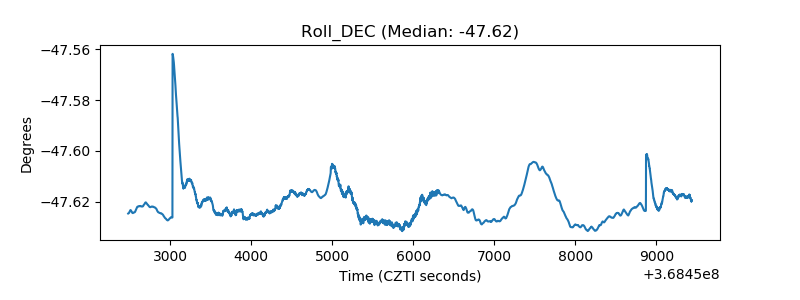 |
| _Roll_RA | 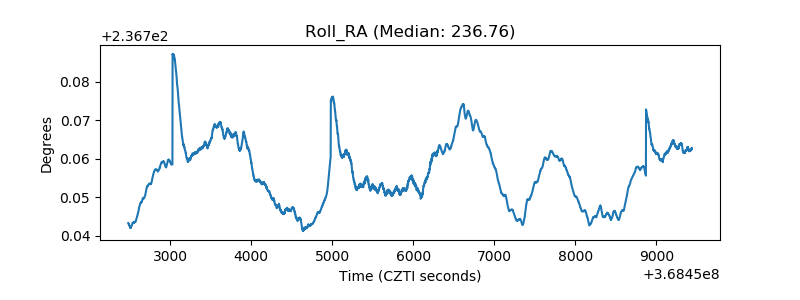 |
| Veto Counter | 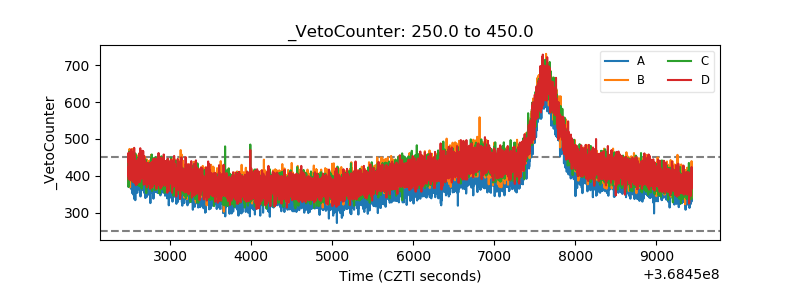 |