| Param | Original file | Final file |
|---|---|---|
| Filename | modeM0/AS1T04_051T01_9000004686_32097cztM0_level2.evt | modeM0/AS1T04_051T01_9000004686_32097cztM0_level2_quad_clean.evt |
| Size (bytes) | 165,453,120 | 20,370,240 |
| Size | 157.8 MB | 19.4 MB |
| Events in quadrant A | 536,609 | 147,958 |
| Events in quadrant B | 996,213 | 144,193 |
| Events in quadrant C | 785,712 | 138,394 |
| Events in quadrant D | 2,612,948 | 99,412 |
| Mode M0 | |||
|---|---|---|---|
| Quadrant | BADHDUFLAG | Total packets | Discarded packets |
| A | 0 | 2300 | 11 |
| B | 0 | 3725 | 18 |
| C | 0 | 3073 | 48 |
| D | 0 | 8680 | 159 |
| Mode SS | |||
|---|---|---|---|
| Quadrant | BADHDUFLAG | Total packets | Discarded packets |
| A | 0 | 22 | 0 |
| B | 0 | 22 | 0 |
| C | 0 | 22 | 0 |
| D | 0 | 22 | 0 |
| Quadrant | Total seconds | Saturated seconds | Saturation percentage |
|---|---|---|---|
| A | 1138 | 1 | 0.087873% |
| B | 1138 | 30 | 2.636204% |
| C | 1131 | 81 | 7.161804% |
| D | 1122 | 911 | 81.194296% |
Noise dominated data is calculated using 1-second bins in cleaned event files. If a bin has >2000 counts, and if more than 50% of those come from <1% of pixels, then it is considered to be noise-dominated and hence unusable.
| Quadrant | # 1 sec bins | Bins with >0 counts | Bins with >2000 counts | High rate bins dominated by noise | Noise dominated (total time) | Noise dominated (detector-on time) | Marked lightcurve |
|---|---|---|---|---|---|---|---|
| A | 1141 | 1141 | 0 | 0 | 0.00% | 0.00% |  |
| B | 1141 | 1140 | 11 | 11 | 0.96% | 0.96% | 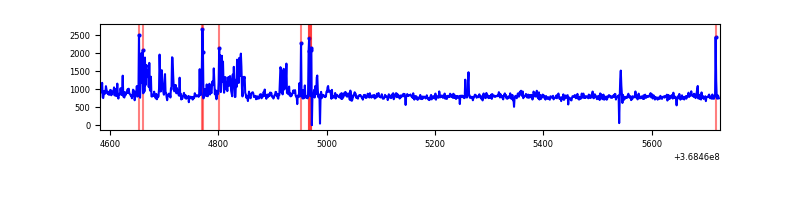 |
| C | 1143 | 1141 | 59 | 59 | 5.16% | 5.17% | 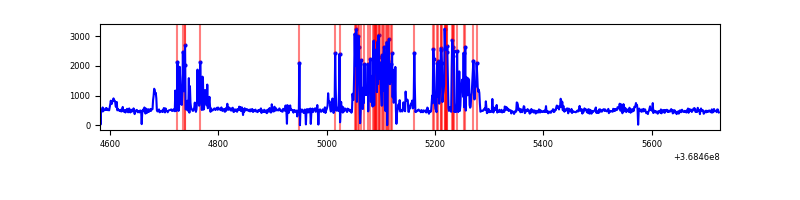 |
| D | 1141 | 1125 | 980 | 980 | 85.89% | 87.11% | 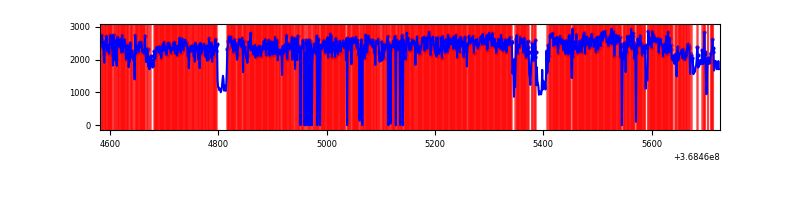 |
Top three noisy pixels from each quadrant. If the there are fewer than three noisy pixels in the level2.evt file, extra rows are filled as -1
| Pixel properties | Quadrant properties | ||||||
|---|---|---|---|---|---|---|---|
| Quadrant | DetID | PixID | Counts | Sigma | Mean | Median | Sigma |
| A | 13 | 6 | 7456 | 246.01 | 136 | 133 | 29.8 |
| A | 13 | 254 | 2173 | 68.53 | 136 | 133 | 29.8 |
| A | 2 | 79 | 1482 | 45.32 | 136 | 133 | 29.8 |
| B | 6 | 159 | 355663 | 12830.44 | 132 | 129 | 27.7 |
| B | 0 | 190 | 76122 | 2742.42 | 132 | 129 | 27.7 |
| B | 5 | 172 | 17144 | 614.03 | 132 | 129 | 27.7 |
| C | 0 | 10 | 253509 | 8337.38 | 123 | 123 | 30.4 |
| C | 14 | 238 | 28230 | 924.83 | 123 | 123 | 30.4 |
| C | 14 | 254 | 12218 | 397.97 | 123 | 123 | 30.4 |
| D | 12 | 79 | 1345892 | 50716.74 | 101 | 98 | 26.5 |
| D | 8 | 195 | 343230 | 12931.05 | 101 | 98 | 26.5 |
| D | 12 | 227 | 334154 | 12589.02 | 101 | 98 | 26.5 |
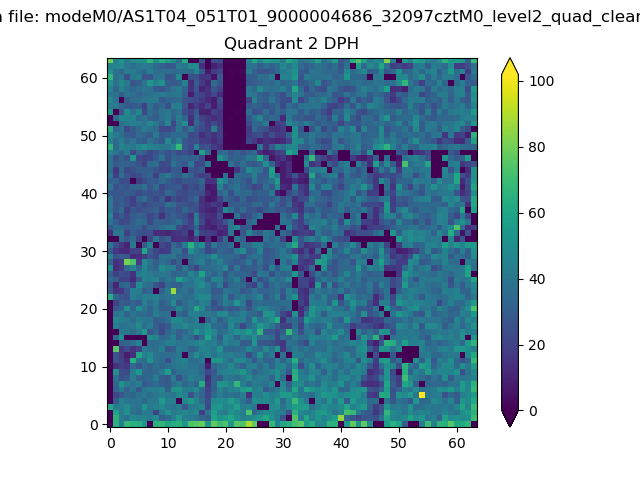
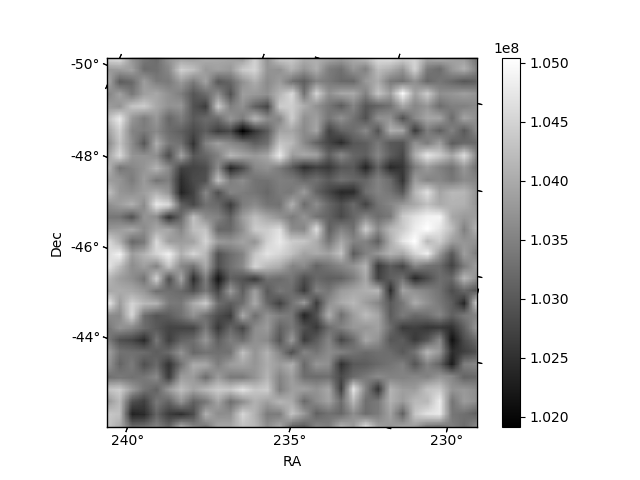
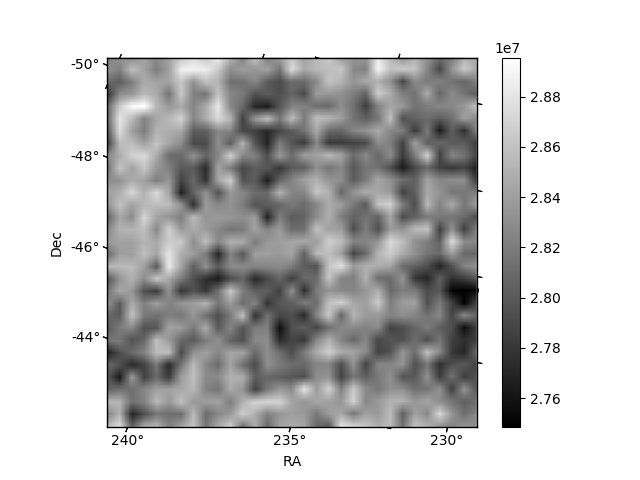
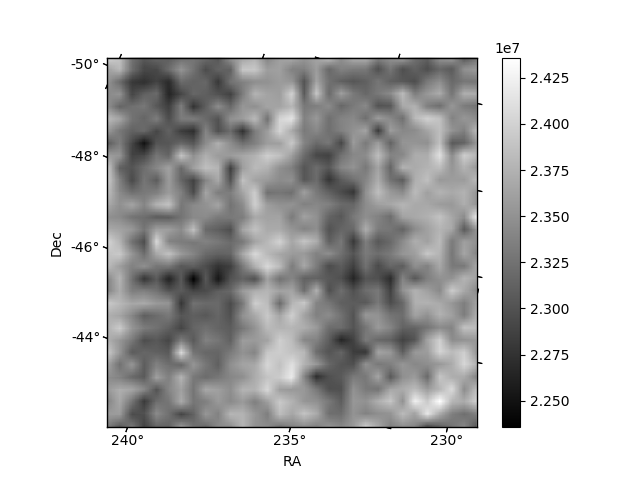
Histogram calculated using DETX and DETY for each event in the final _common_clean file
| Quadrant A | 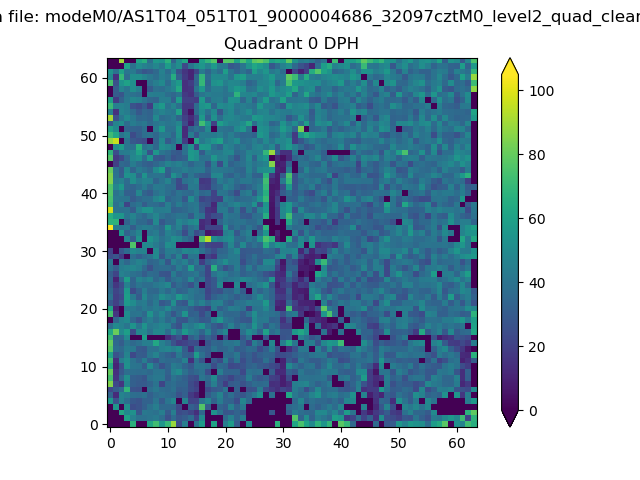 |
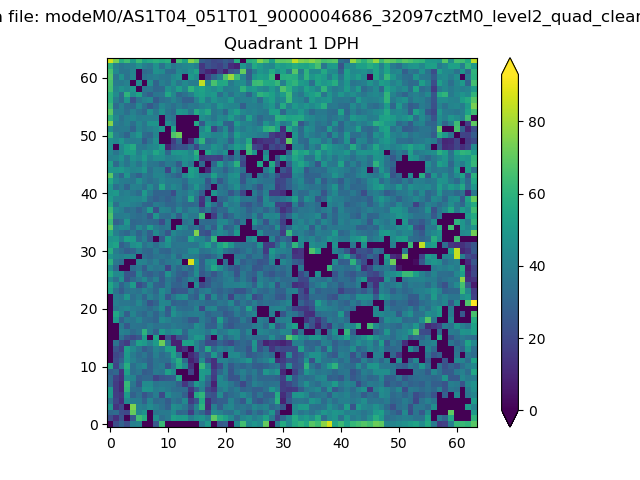 |
Quadrant B |
|---|---|---|---|
| Quadrant D | 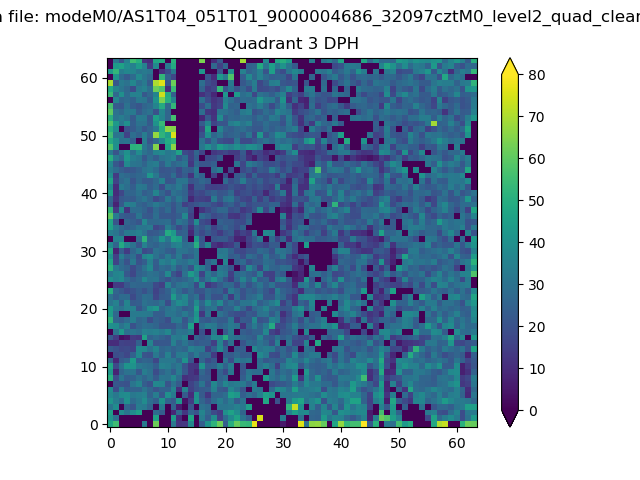 |
 |
Quadrant C |
| Plot type | Count rate plots | Images |
|---|---|---|
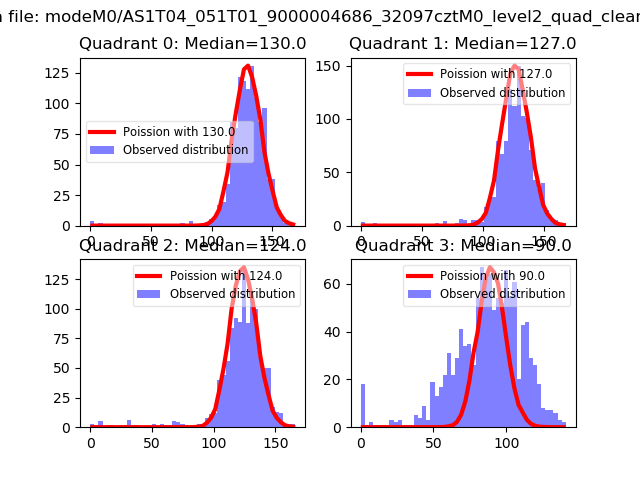
| Comparison with Poisson distribution Blue bars denote a histogram of data divided into 1 sec bins. Red curve is a Poisson curve with rate = median count rate of data. |
 |
 |
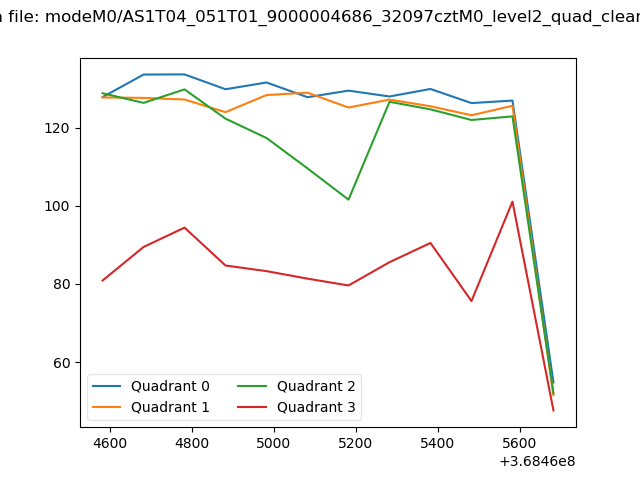
| Quadrant-wise count rates Data is divided into 100 sec bins |
 |
|
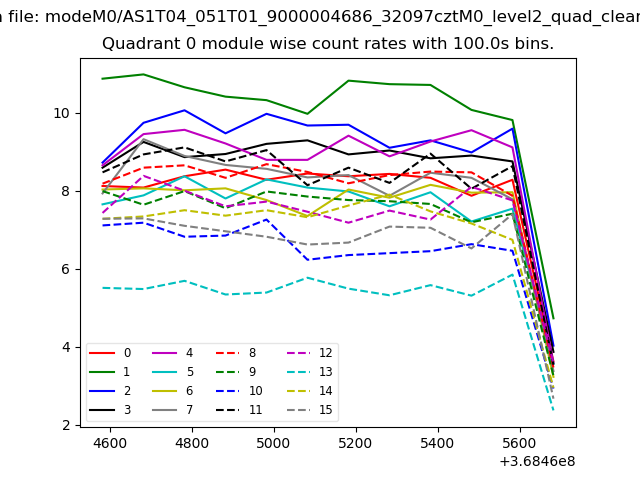
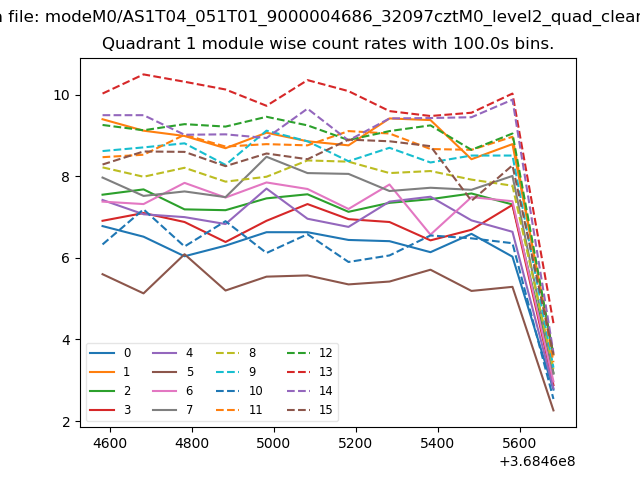
| Module-wise count rates for Quadrant A Data is divided into 100 sec bins |
 |
 |
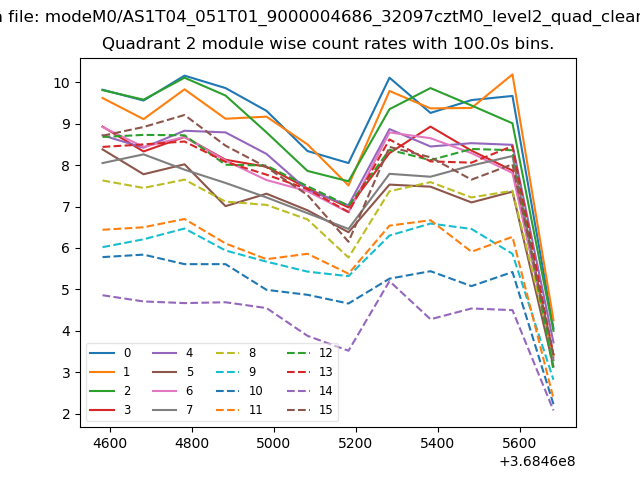
| Module-wise count rates for Quadrant B Data is divided into 100 sec bins |
 |
 |
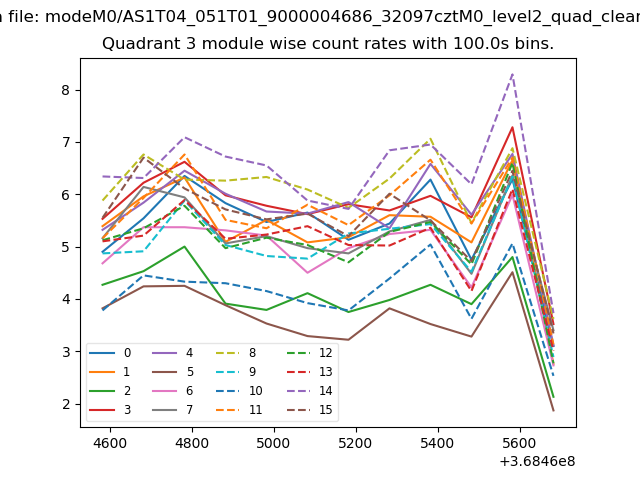
| Module-wise count rates for Quadrant C Data is divided into 100 sec bins |
 |
 |
| Module-wise count rates for Quadrant D Data is divided into 100 sec bins |
 |
 |
| Parameter | Plot |
|---|---|
| CZT HV Monitor | 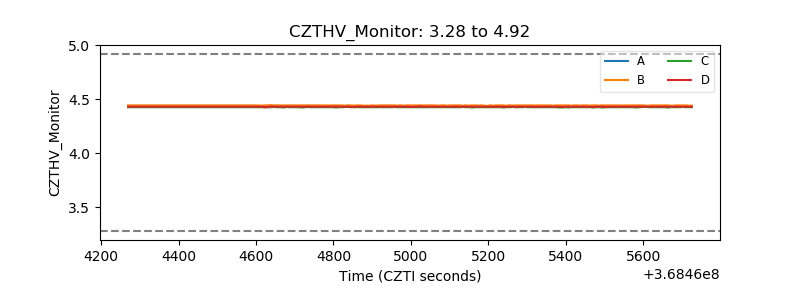 |
| D_VDD |  |
| Temperature 1 | 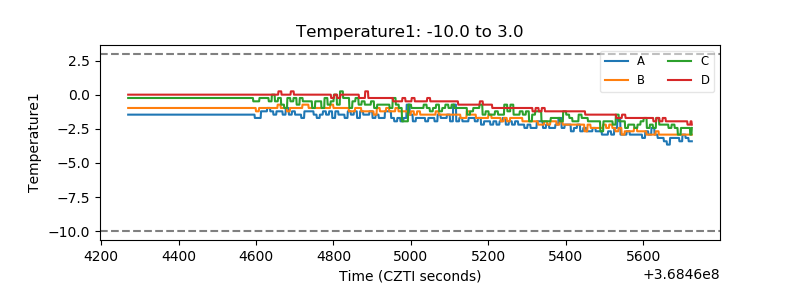 |
| Veto HV Monitor |  |
| Veto LLD | 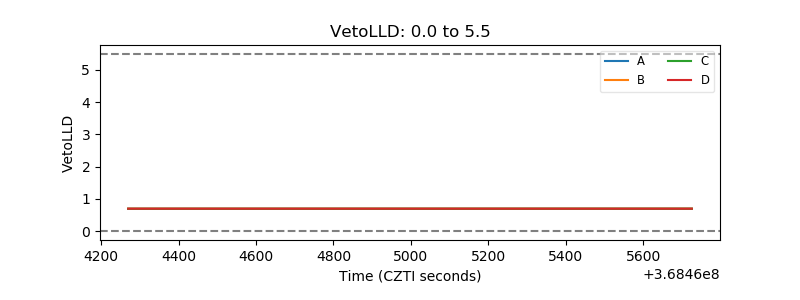 |
| Alpha Counter | 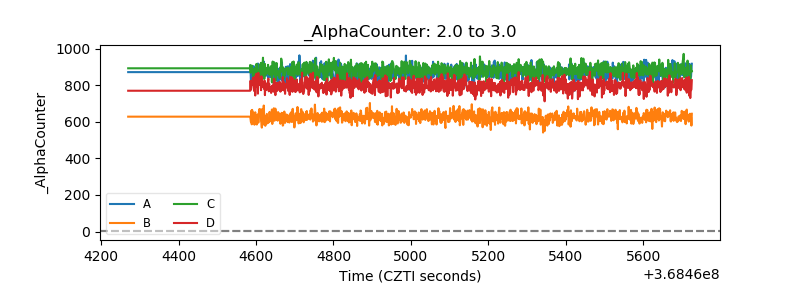 |
| _CPM_Rate | 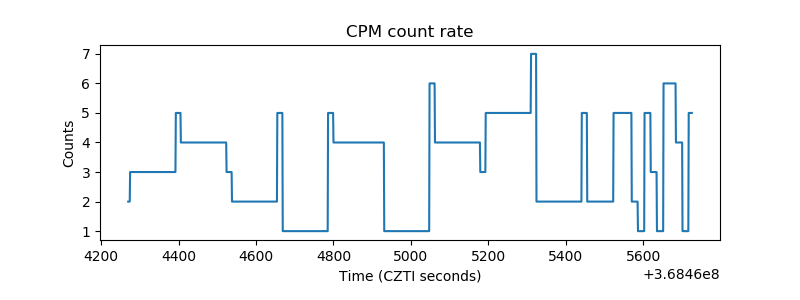 |
| CZT Counter | 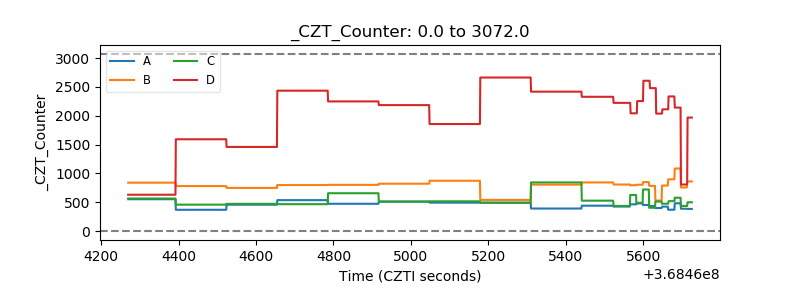 |
| +2.5 Volts monitor |  |
| +5 Volts monitor |  |
| _ROLL_ROT | 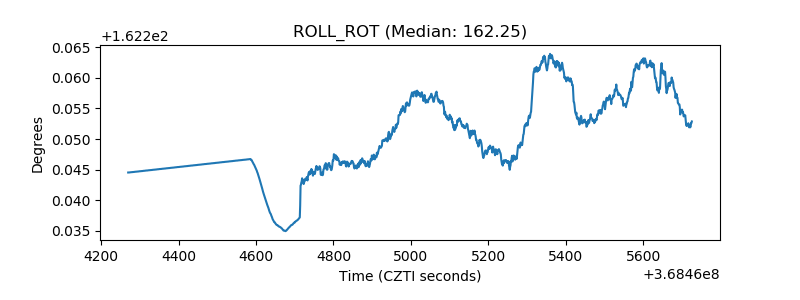 |
| _Roll_DEC |  |
| _Roll_RA | 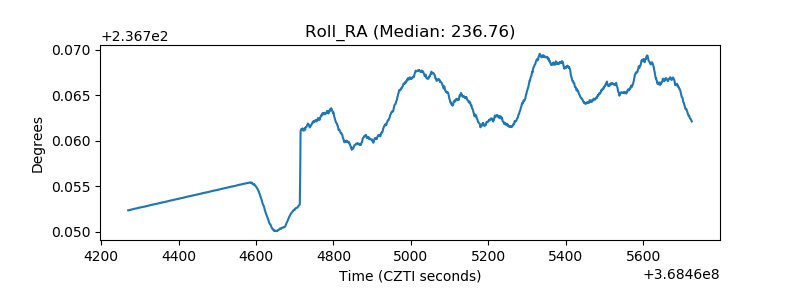 |
| Veto Counter | 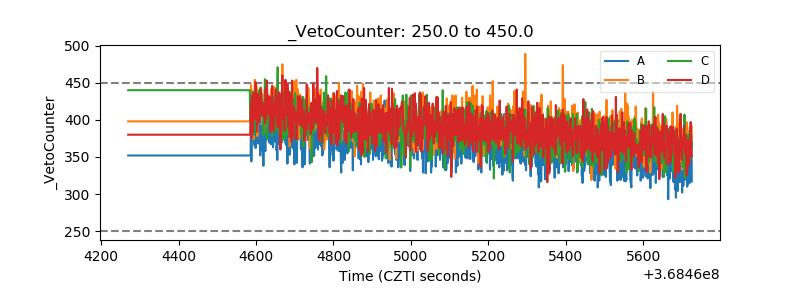 |