| Param | Original file | Final file |
|---|---|---|
| Filename | modeM0/AS1T04_051T01_9000004686_32100cztM0_level2.evt | modeM0/AS1T04_051T01_9000004686_32100cztM0_level2_quad_clean.evt |
| Size (bytes) | 2,612,655,360 | 301,438,080 |
| Size | 2.4 GB | 287.5 MB |
| Events in quadrant A | 10,934,930 | 2,007,870 |
| Events in quadrant B | 20,836,833 | 1,930,626 |
| Events in quadrant C | 15,189,306 | 1,871,284 |
| Events in quadrant D | 30,612,531 | 1,726,467 |
| Mode M9 | |||
|---|---|---|---|
| Quadrant | BADHDUFLAG | Total packets | Discarded packets |
| A | 0 | 24 | 0 |
| B | 0 | 24 | 0 |
| C | 0 | 24 | 0 |
| D | 0 | 24 | 0 |
| Mode M0 | |||
|---|---|---|---|
| Quadrant | BADHDUFLAG | Total packets | Discarded packets |
| A | 0 | 47494 | 4 |
| B | 0 | 78156 | 4 |
| C | 0 | 60016 | 4 |
| D | 0 | 107328 | 4 |
| Mode SS | |||
|---|---|---|---|
| Quadrant | BADHDUFLAG | Total packets | Discarded packets |
| A | 0 | 470 | 0 |
| B | 0 | 470 | 0 |
| C | 0 | 470 | 0 |
| D | 0 | 470 | 0 |
| Quadrant | Total seconds | Saturated seconds | Saturation percentage |
|---|---|---|---|
| A | 23125 | 115 | 0.497297% |
| B | 23126 | 1242 | 5.370579% |
| C | 23126 | 2232 | 9.651475% |
| D | 23126 | 4849 | 20.967742% |
Noise dominated data is calculated using 1-second bins in cleaned event files. If a bin has >2000 counts, and if more than 50% of those come from <1% of pixels, then it is considered to be noise-dominated and hence unusable.
| Quadrant | # 1 sec bins | Bins with >0 counts | Bins with >2000 counts | High rate bins dominated by noise | Noise dominated (total time) | Noise dominated (detector-on time) | Marked lightcurve |
|---|---|---|---|---|---|---|---|
| A | 25530 | 23128 | 1 | 1 | 0.00% | 0.00% | 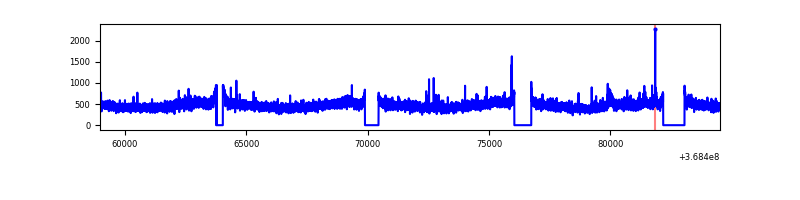 |
| B | 25531 | 23127 | 700 | 700 | 2.74% | 3.03% | 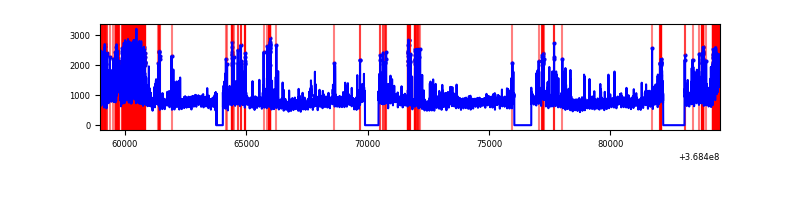 |
| C | 25531 | 23128 | 850 | 850 | 3.33% | 3.68% | 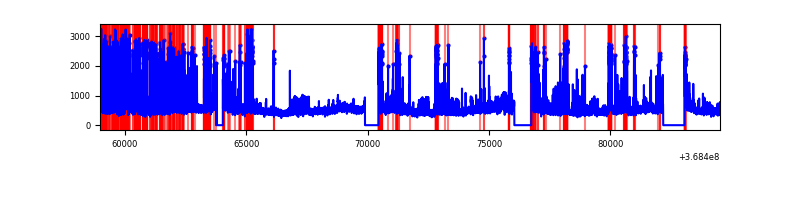 |
| D | 25531 | 23128 | 5012 | 5012 | 19.63% | 21.67% | 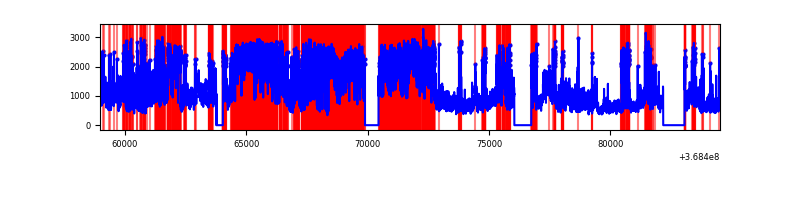 |
Top three noisy pixels from each quadrant. If the there are fewer than three noisy pixels in the level2.evt file, extra rows are filled as -1
| Pixel properties | Quadrant properties | ||||||
|---|---|---|---|---|---|---|---|
| Quadrant | DetID | PixID | Counts | Sigma | Mean | Median | Sigma |
| A | 15 | 174 | 79210 | 137.04 | 2796 | 2741 | 558.0 |
| A | 13 | 6 | 52377 | 88.95 | 2796 | 2741 | 558.0 |
| A | 13 | 254 | 46005 | 77.53 | 2796 | 2741 | 558.0 |
| B | 6 | 159 | 6530840 | 12708.8 | 2725 | 2656 | 513.7 |
| B | 10 | 245 | 1947895 | 3786.91 | 2725 | 2656 | 513.7 |
| B | 12 | 18 | 538017 | 1042.22 | 2725 | 2656 | 513.7 |
| C | 0 | 10 | 3802464 | 6335.59 | 2573 | 2591 | 599.8 |
| C | 14 | 238 | 728151 | 1209.74 | 2573 | 2591 | 599.8 |
| C | 14 | 254 | 435355 | 721.55 | 2573 | 2591 | 599.8 |
| D | 12 | 79 | 9870980 | 16370.6 | 2534 | 2464 | 602.8 |
| D | 8 | 195 | 7522516 | 12474.8 | 2534 | 2464 | 602.8 |
| D | 12 | 218 | 1943359 | 3219.7 | 2534 | 2464 | 602.8 |
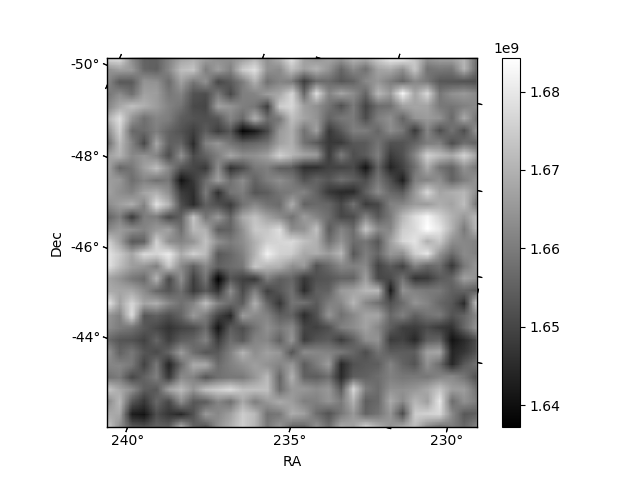
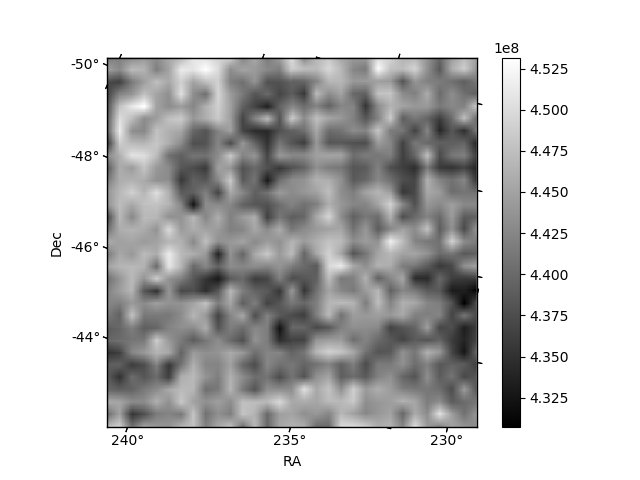
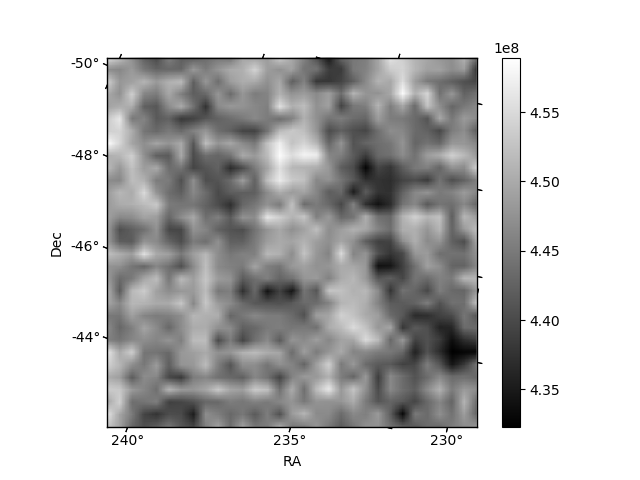
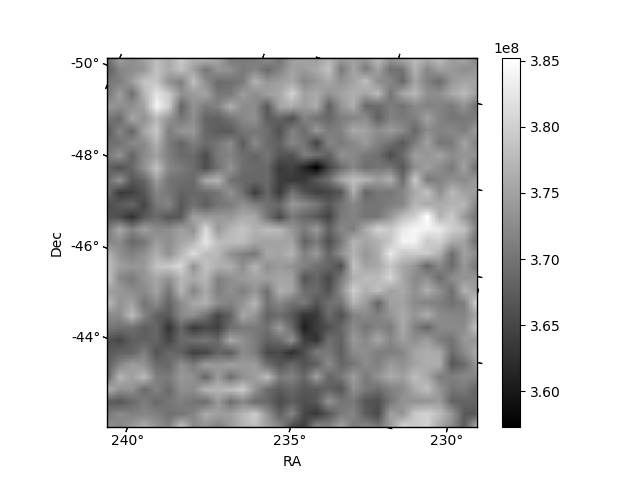
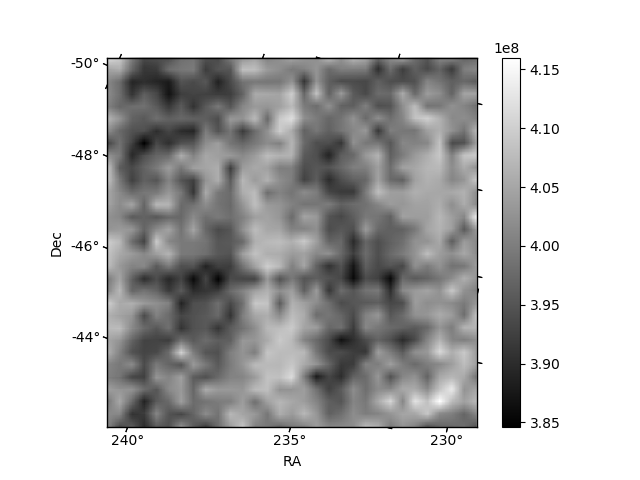
Histogram calculated using DETX and DETY for each event in the final _common_clean file
| Quadrant A | 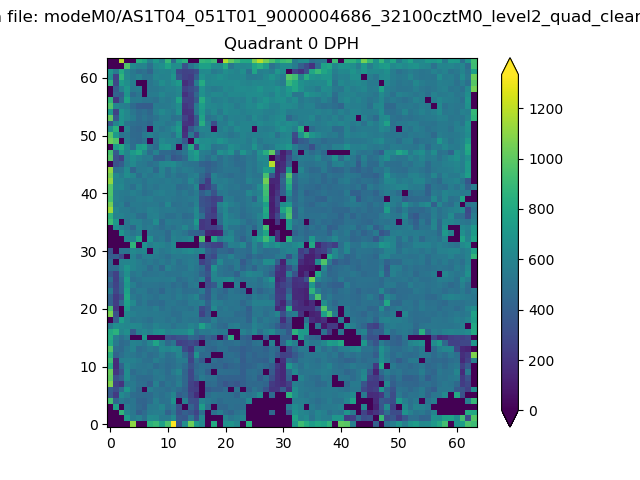 |
 |
Quadrant B |
|---|---|---|---|
| Quadrant D | 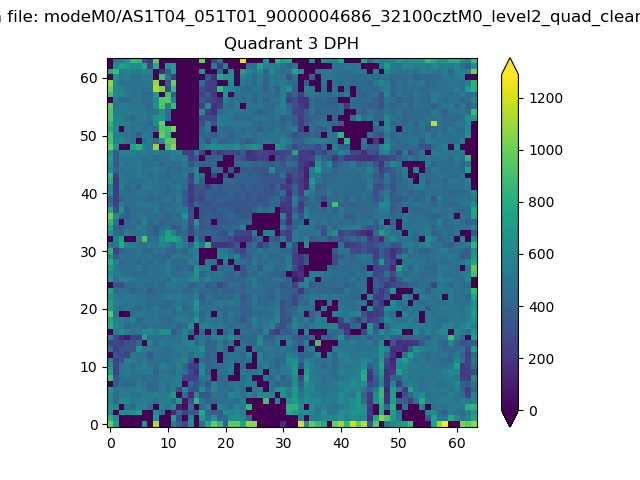 |
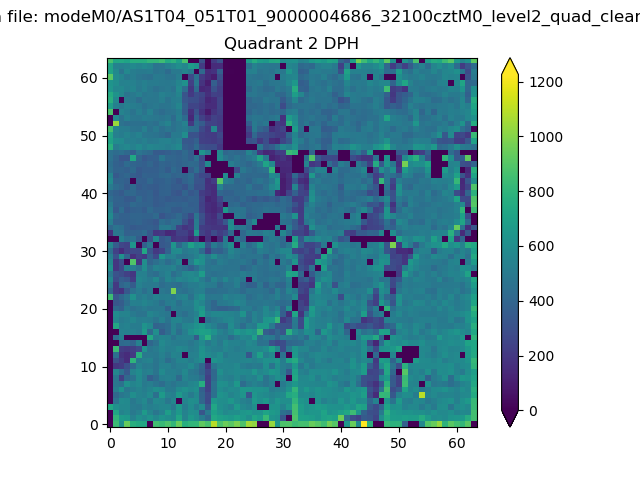 |
Quadrant C |
| Plot type | Count rate plots | Images |
|---|---|---|
| Comparison with Poisson distribution Blue bars denote a histogram of data divided into 1 sec bins. Red curve is a Poisson curve with rate = median count rate of data. |
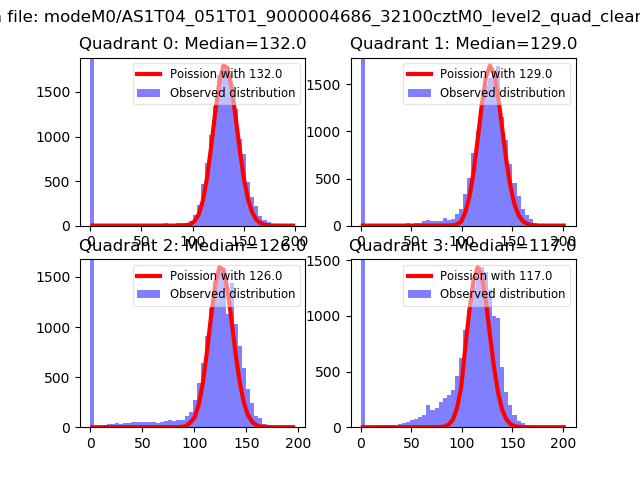 |
 |
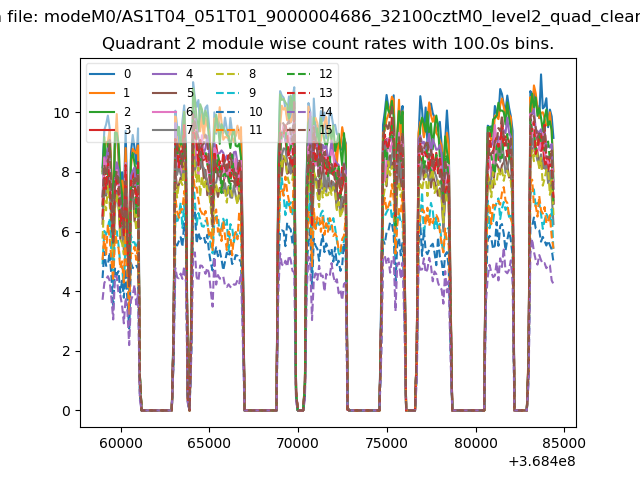
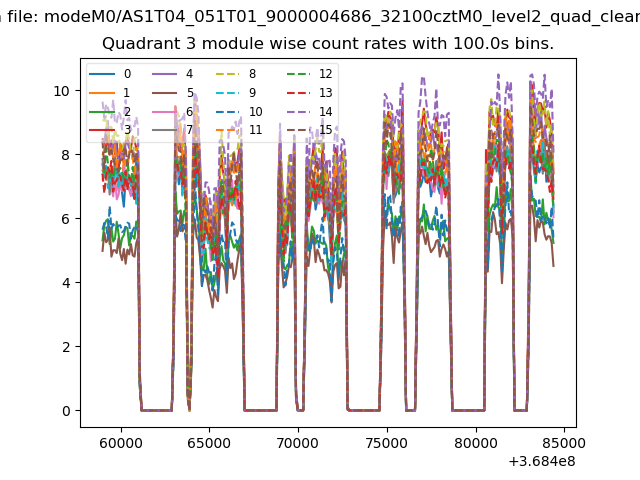
| Quadrant-wise count rates Data is divided into 100 sec bins |
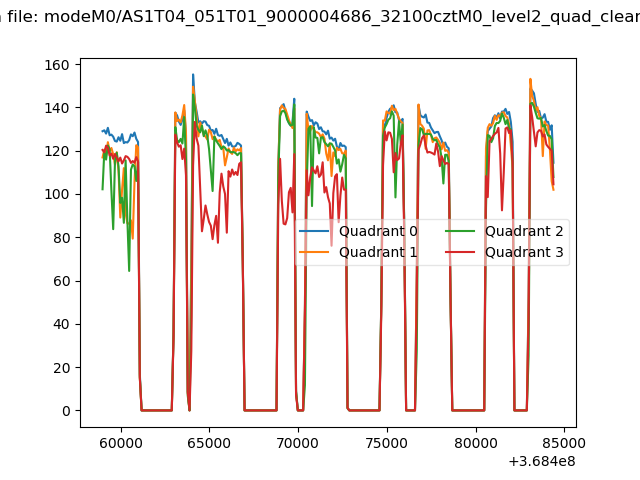 |
|
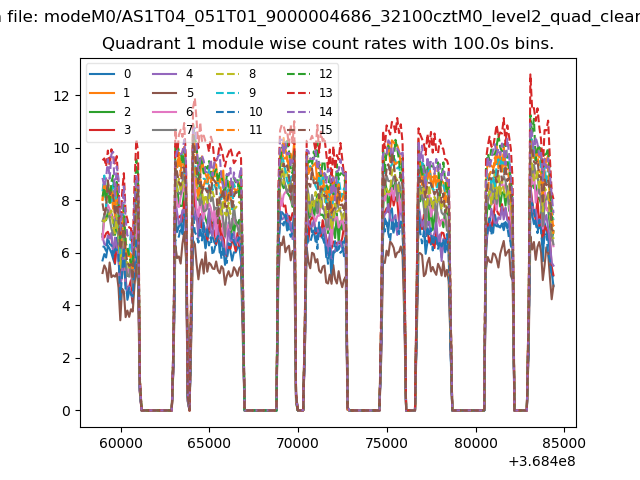
| Module-wise count rates for Quadrant A Data is divided into 100 sec bins |
 |
 |
| Module-wise count rates for Quadrant B Data is divided into 100 sec bins |
 |
 |
| Module-wise count rates for Quadrant C Data is divided into 100 sec bins |
 |
 |
| Module-wise count rates for Quadrant D Data is divided into 100 sec bins |
 |
 |
| Parameter | Plot |
|---|---|
| CZT HV Monitor | 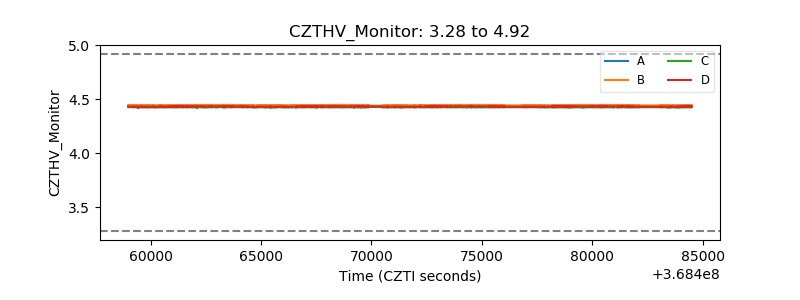 |
| D_VDD | 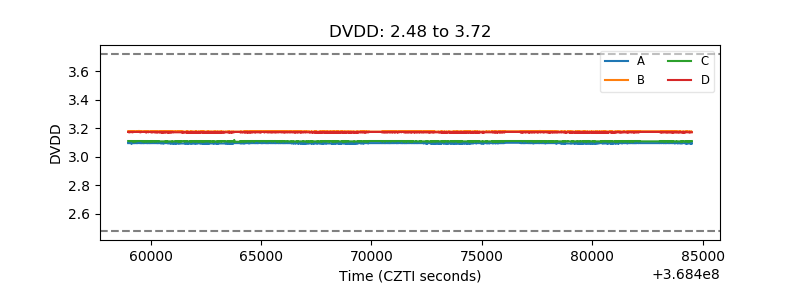 |
| Temperature 1 | 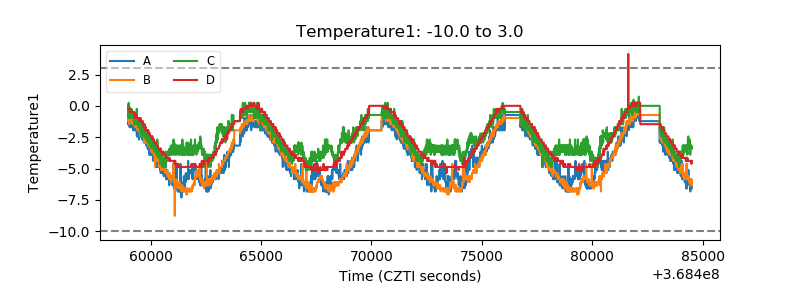 |
| Veto HV Monitor | 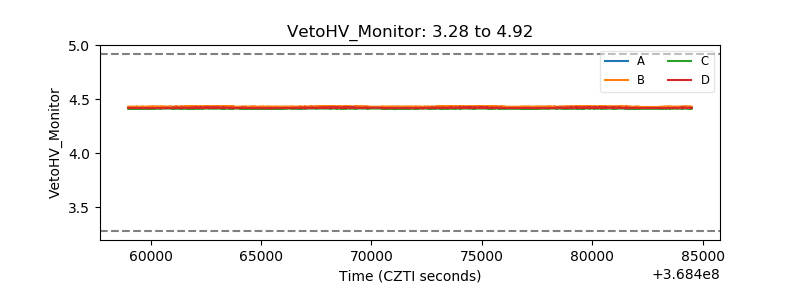 |
| Veto LLD | 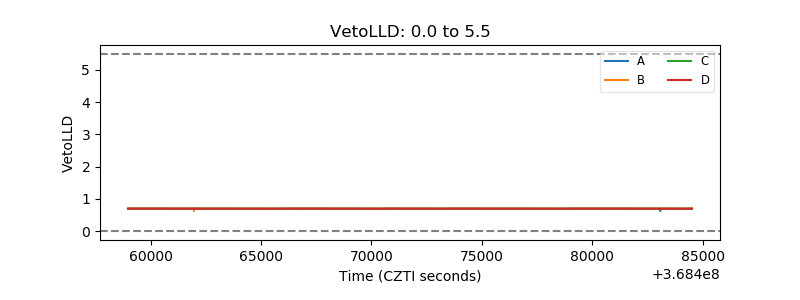 |
| Alpha Counter | 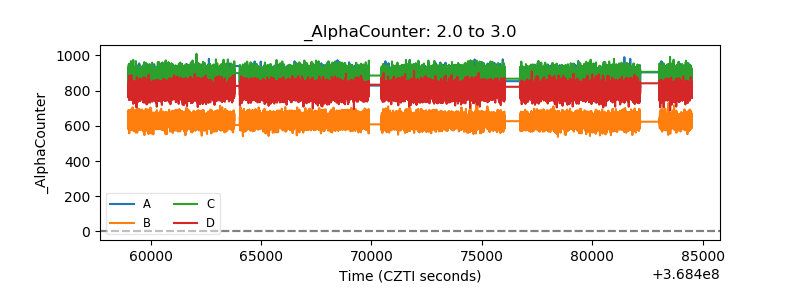 |
| _CPM_Rate | 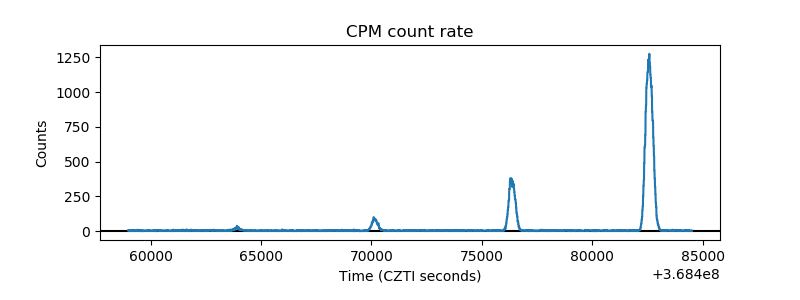 |
| CZT Counter | 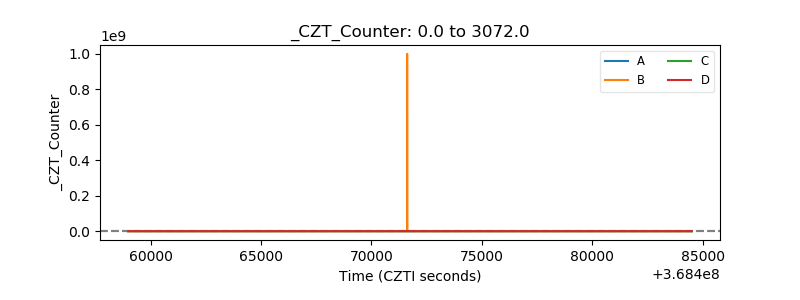 |
| +2.5 Volts monitor |  |
| +5 Volts monitor |  |
| _ROLL_ROT |  |
| _Roll_DEC | 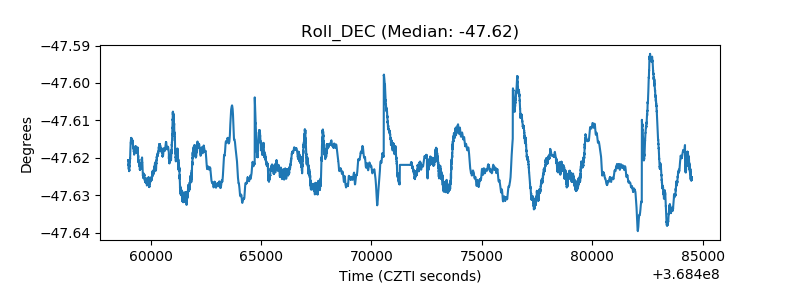 |
| _Roll_RA | 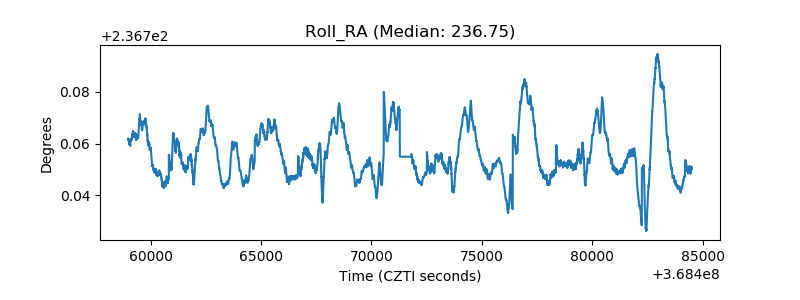 |
| Veto Counter |  |