| Param | Original file | Final file |
|---|---|---|
| Filename | modeM0/AS1T04_051T01_9000004686_32101cztM0_level2.evt | modeM0/AS1T04_051T01_9000004686_32101cztM0_level2_quad_clean.evt |
| Size (bytes) | 617,379,840 | 86,993,280 |
| Size | 588.8 MB | 83.0 MB |
| Events in quadrant A | 3,005,937 | 572,470 |
| Events in quadrant B | 7,380,102 | 536,272 |
| Events in quadrant C | 3,253,538 | 552,102 |
| Events in quadrant D | 4,631,126 | 532,754 |
| Mode M9 | |||
|---|---|---|---|
| Quadrant | BADHDUFLAG | Total packets | Discarded packets |
| A | 0 | 10 | 0 |
| B | 0 | 10 | 0 |
| C | 0 | 10 | 0 |
| D | 0 | 10 | 0 |
| Mode M0 | |||
|---|---|---|---|
| Quadrant | BADHDUFLAG | Total packets | Discarded packets |
| A | 0 | 12887 | 1 |
| B | 0 | 26400 | 1 |
| C | 0 | 13549 | 1 |
| D | 0 | 18276 | 1 |
| Mode SS | |||
|---|---|---|---|
| Quadrant | BADHDUFLAG | Total packets | Discarded packets |
| A | 0 | 130 | 0 |
| B | 0 | 130 | 0 |
| C | 0 | 130 | 0 |
| D | 0 | 130 | 0 |
| Quadrant | Total seconds | Saturated seconds | Saturation percentage |
|---|---|---|---|
| A | 6305 | 13 | 0.206186% |
| B | 6306 | 1026 | 16.270219% |
| C | 6306 | 96 | 1.522360% |
| D | 6306 | 62 | 0.983191% |
Noise dominated data is calculated using 1-second bins in cleaned event files. If a bin has >2000 counts, and if more than 50% of those come from <1% of pixels, then it is considered to be noise-dominated and hence unusable.
| Quadrant | # 1 sec bins | Bins with >0 counts | Bins with >2000 counts | High rate bins dominated by noise | Noise dominated (total time) | Noise dominated (detector-on time) | Marked lightcurve |
|---|---|---|---|---|---|---|---|
| A | 7360 | 6306 | 0 | 0 | 0.00% | 0.00% |  |
| B | 7360 | 6306 | 771 | 771 | 10.48% | 12.23% |  |
| C | 7361 | 6307 | 23 | 23 | 0.31% | 0.36% |  |
| D | 7361 | 6307 | 56 | 56 | 0.76% | 0.89% |  |
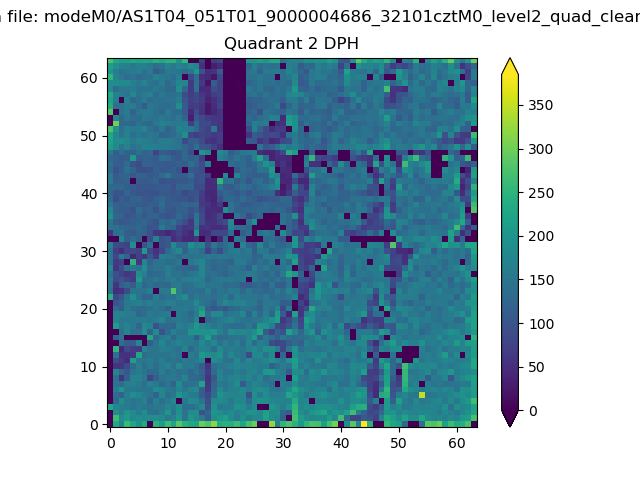
Top three noisy pixels from each quadrant. If the there are fewer than three noisy pixels in the level2.evt file, extra rows are filled as -1
| Pixel properties | Quadrant properties | ||||||
|---|---|---|---|---|---|---|---|
| Quadrant | DetID | PixID | Counts | Sigma | Mean | Median | Sigma |
| A | 13 | 6 | 14836 | 91.21 | 774 | 761 | 154.3 |
| A | 13 | 254 | 12808 | 78.07 | 774 | 761 | 154.3 |
| A | 3 | 137 | 7543 | 43.95 | 774 | 761 | 154.3 |
| B | 10 | 245 | 2512983 | 17864.42 | 741 | 722 | 140.6 |
| B | 6 | 159 | 1738240 | 12355.31 | 741 | 722 | 140.6 |
| B | 5 | 172 | 68180 | 479.69 | 741 | 722 | 140.6 |
| C | 0 | 10 | 202514 | 1167.72 | 737 | 741 | 172.8 |
| C | 14 | 238 | 129930 | 747.66 | 737 | 741 | 172.8 |
| C | 4 | 175 | 17308 | 95.88 | 737 | 741 | 172.8 |
| D | 8 | 195 | 1556972 | 8777.66 | 737 | 717 | 177.3 |
| D | 12 | 233 | 96402 | 539.69 | 737 | 717 | 177.3 |
| D | 12 | 218 | 80959 | 452.58 | 737 | 717 | 177.3 |
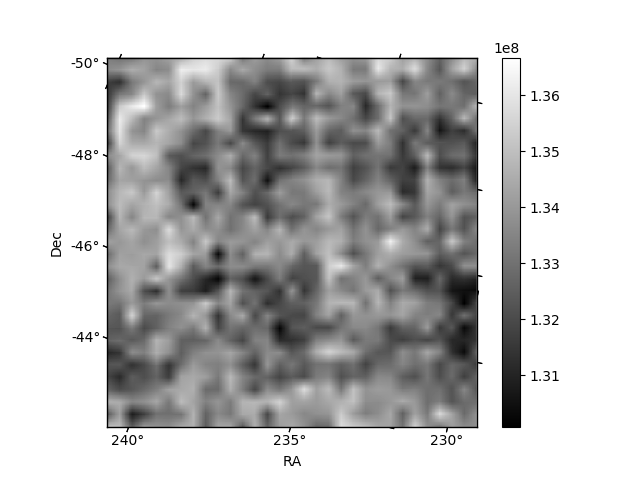
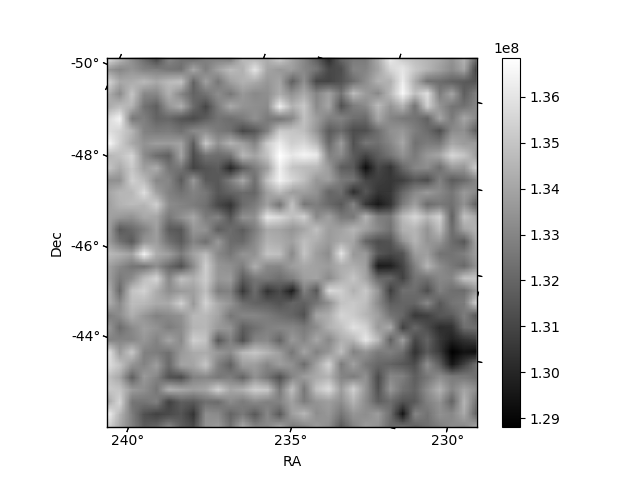
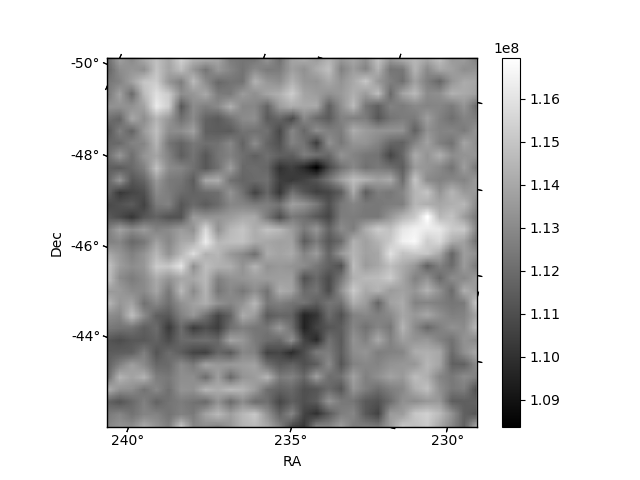
Histogram calculated using DETX and DETY for each event in the final _common_clean file
| Quadrant A | 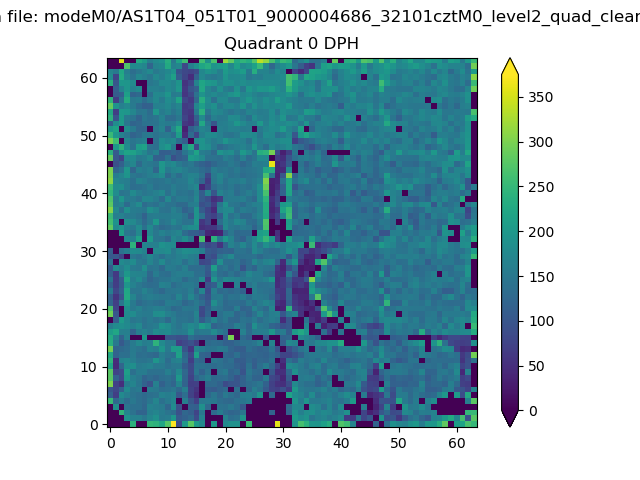 |
 |
Quadrant B |
|---|---|---|---|
| Quadrant D | 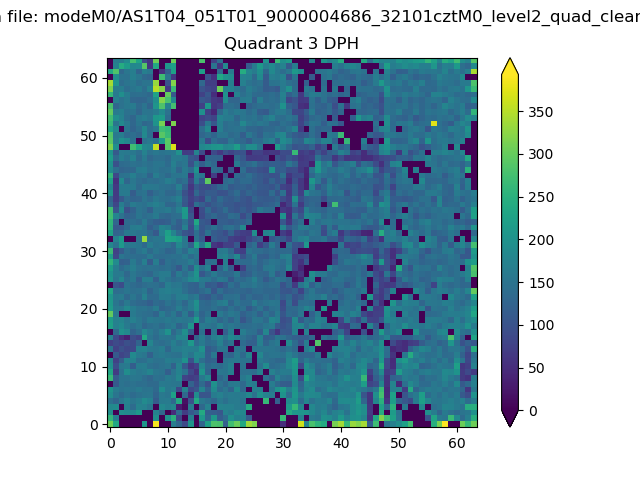 |
 |
Quadrant C |
| Plot type | Count rate plots | Images |
|---|---|---|
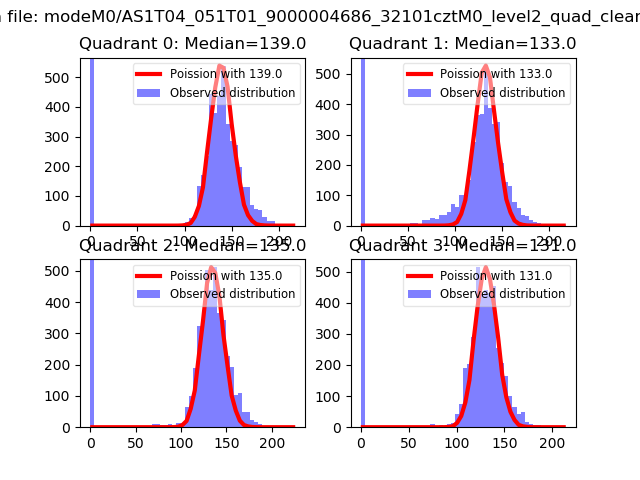
| Comparison with Poisson distribution Blue bars denote a histogram of data divided into 1 sec bins. Red curve is a Poisson curve with rate = median count rate of data. |
 |
 |
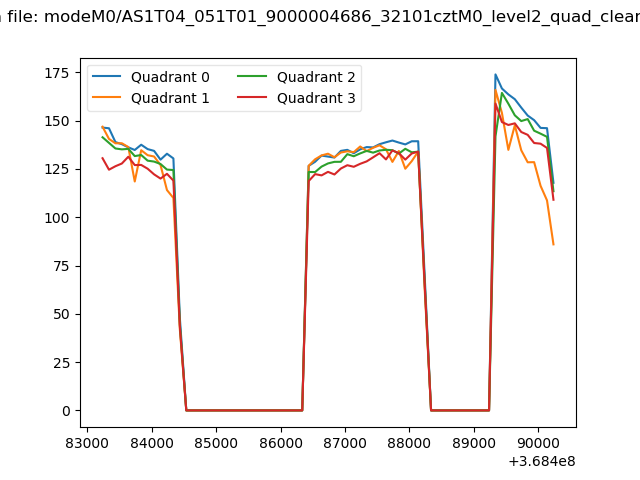
| Quadrant-wise count rates Data is divided into 100 sec bins |
 |
|
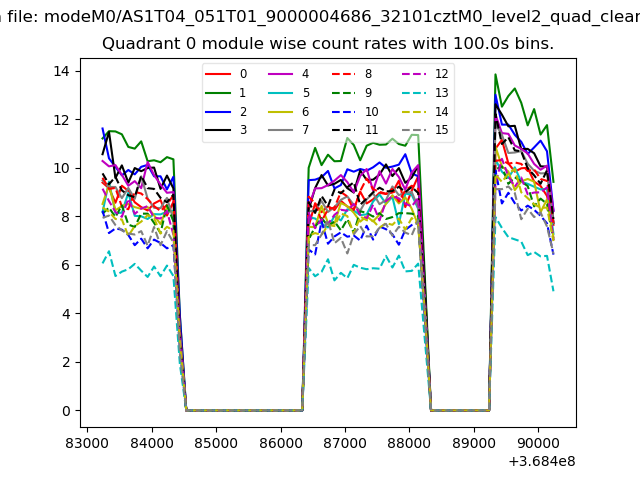
| Module-wise count rates for Quadrant A Data is divided into 100 sec bins |
 |
 |
| Module-wise count rates for Quadrant B Data is divided into 100 sec bins |
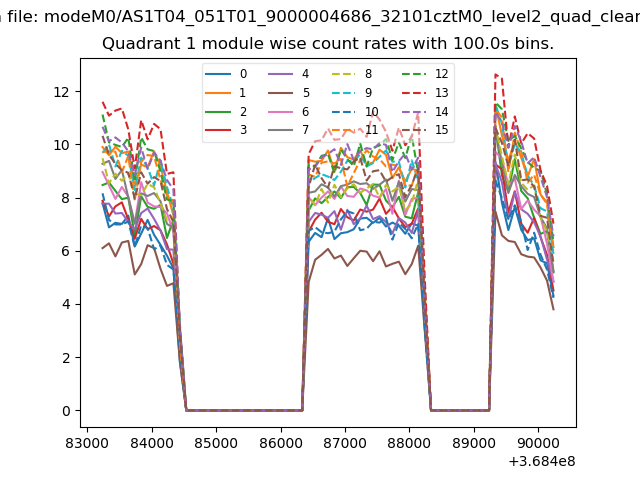 |
 |
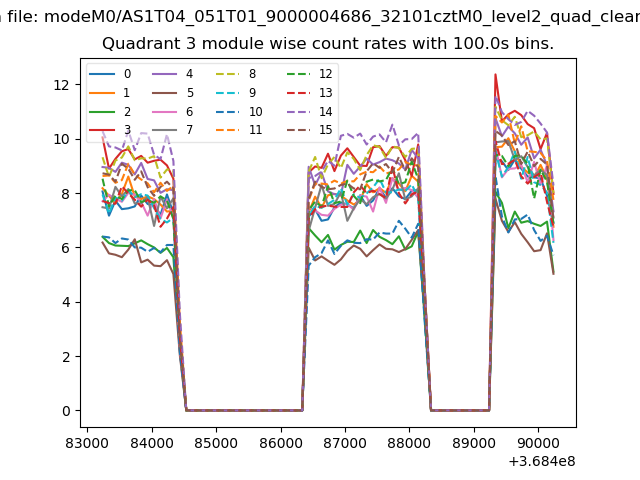
| Module-wise count rates for Quadrant C Data is divided into 100 sec bins |
 |
 |
| Module-wise count rates for Quadrant D Data is divided into 100 sec bins |
 |
 |
| Parameter | Plot |
|---|---|
| CZT HV Monitor | 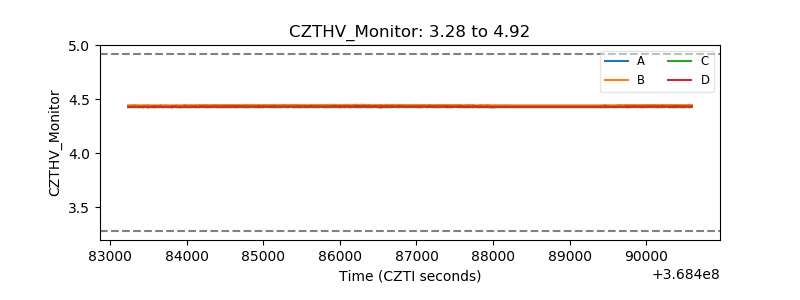 |
| D_VDD | 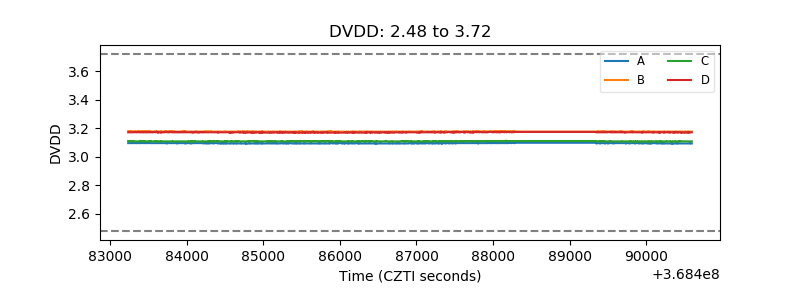 |
| Temperature 1 | 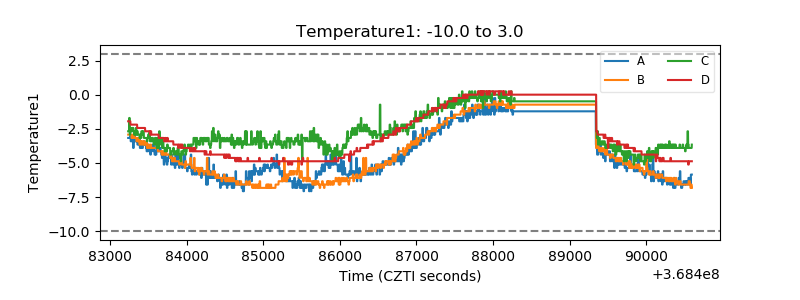 |
| Veto HV Monitor | 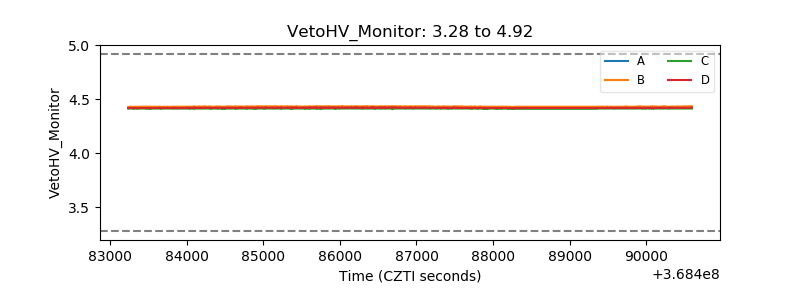 |
| Veto LLD | 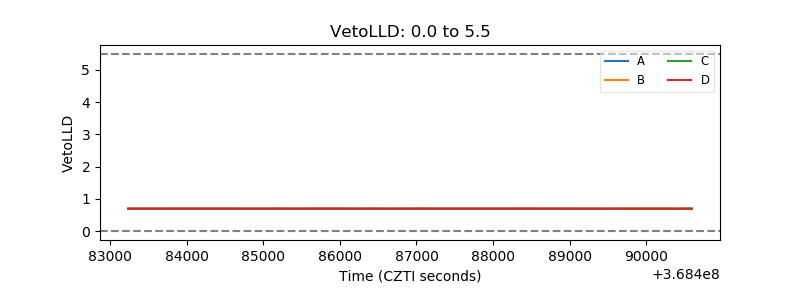 |
| Alpha Counter | 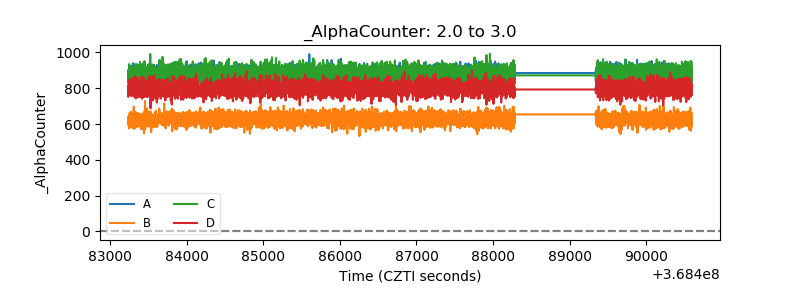 |
| _CPM_Rate | 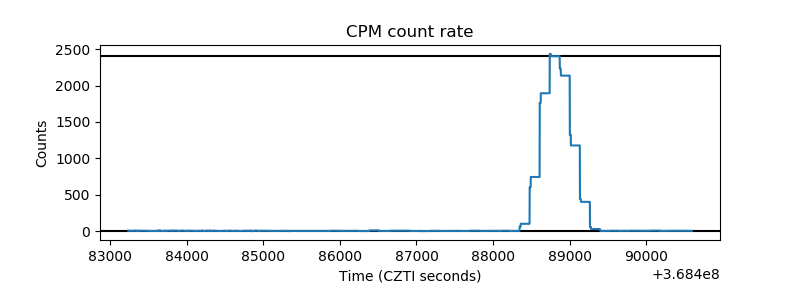 |
| CZT Counter | 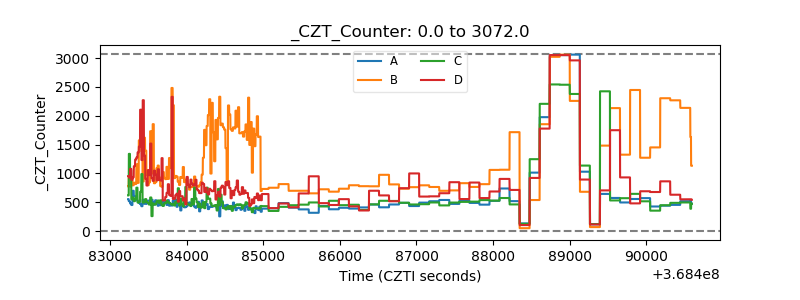 |
| +2.5 Volts monitor |  |
| +5 Volts monitor |  |
| _ROLL_ROT | 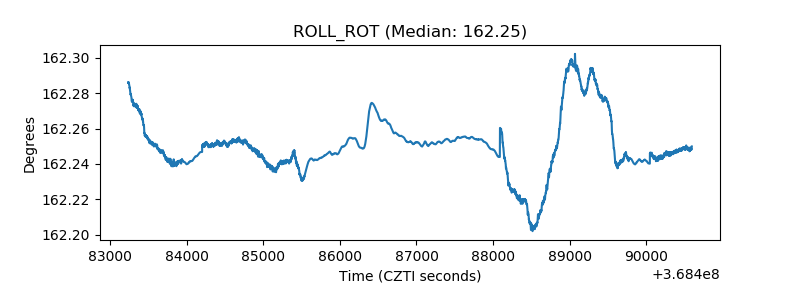 |
| _Roll_DEC | 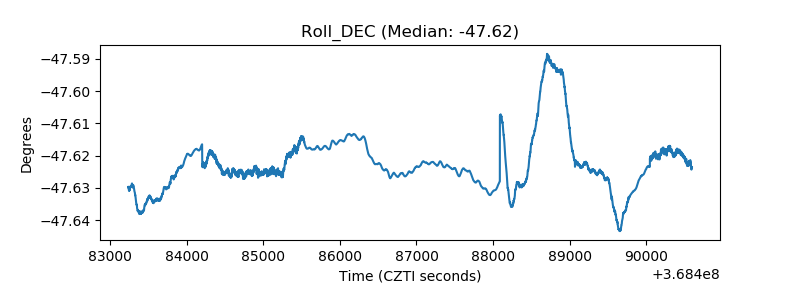 |
| _Roll_RA | 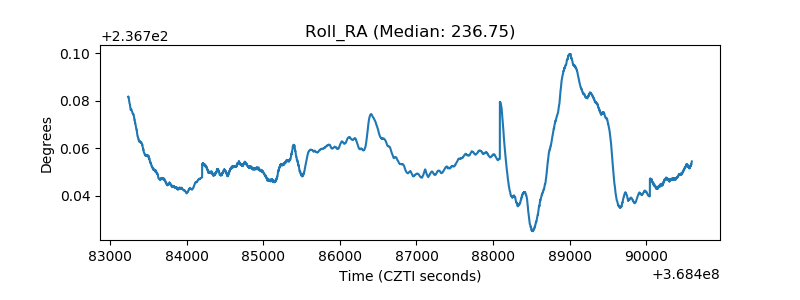 |
| Veto Counter | 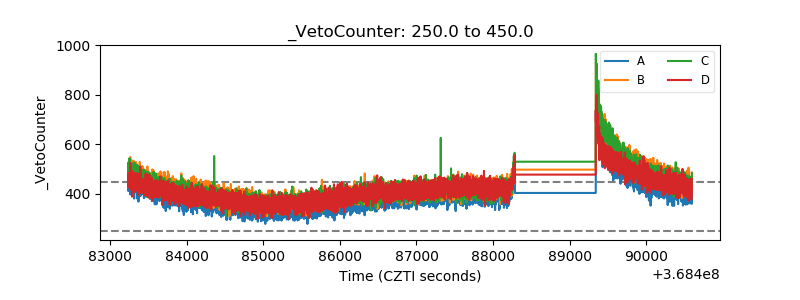 |