| Param | Original file | Final file |
|---|---|---|
| Filename | modeM0/AS1T04_051T01_9000004686_32103cztM0_level2.evt | modeM0/AS1T04_051T01_9000004686_32103cztM0_level2_quad_clean.evt |
| Size (bytes) | 729,599,040 | 82,840,320 |
| Size | 695.8 MB | 79.0 MB |
| Events in quadrant A | 3,147,355 | 552,577 |
| Events in quadrant B | 9,805,027 | 472,783 |
| Events in quadrant C | 3,543,693 | 531,007 |
| Events in quadrant D | 5,175,286 | 512,206 |
| Mode M9 | |||
|---|---|---|---|
| Quadrant | BADHDUFLAG | Total packets | Discarded packets |
| A | 0 | 17 | 0 |
| B | 0 | 18 | 0 |
| C | 0 | 18 | 0 |
| D | 0 | 18 | 0 |
| Mode M0 | |||
|---|---|---|---|
| Quadrant | BADHDUFLAG | Total packets | Discarded packets |
| A | 0 | 13188 | 2 |
| B | 0 | 33342 | 2 |
| C | 0 | 14380 | 2 |
| D | 0 | 19792 | 2 |
| Mode SS | |||
|---|---|---|---|
| Quadrant | BADHDUFLAG | Total packets | Discarded packets |
| A | 0 | 128 | 0 |
| B | 0 | 128 | 0 |
| C | 0 | 128 | 0 |
| D | 0 | 128 | 0 |
| Quadrant | Total seconds | Saturated seconds | Saturation percentage |
|---|---|---|---|
| A | 6290 | 23 | 0.365660% |
| B | 6290 | 2208 | 35.103339% |
| C | 6290 | 175 | 2.782194% |
| D | 6290 | 121 | 1.923688% |
Noise dominated data is calculated using 1-second bins in cleaned event files. If a bin has >2000 counts, and if more than 50% of those come from <1% of pixels, then it is considered to be noise-dominated and hence unusable.
| Quadrant | # 1 sec bins | Bins with >0 counts | Bins with >2000 counts | High rate bins dominated by noise | Noise dominated (total time) | Noise dominated (detector-on time) | Marked lightcurve |
|---|---|---|---|---|---|---|---|
| A | 7470 | 6290 | 0 | 0 | 0.00% | 0.00% | 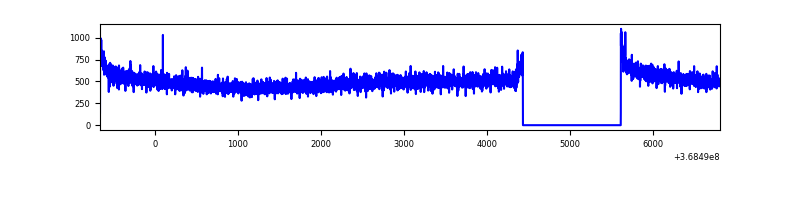 |
| B | 7470 | 6290 | 1580 | 1580 | 21.15% | 25.12% | 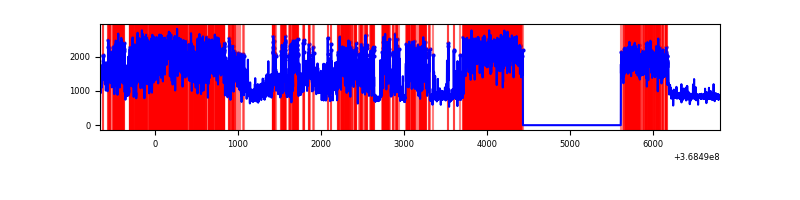 |
| C | 7470 | 6291 | 58 | 58 | 0.78% | 0.92% | 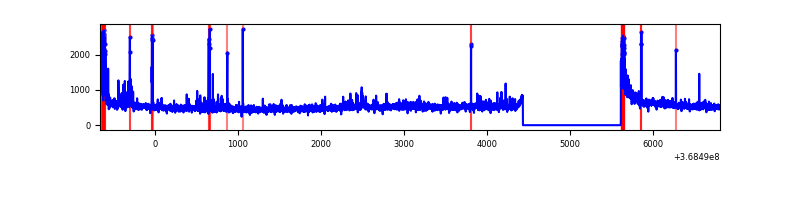 |
| D | 7470 | 6290 | 103 | 103 | 1.38% | 1.64% | 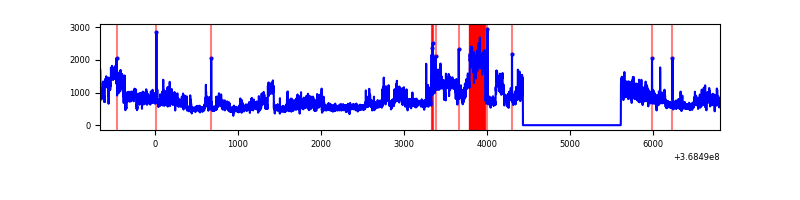 |
Top three noisy pixels from each quadrant. If the there are fewer than three noisy pixels in the level2.evt file, extra rows are filled as -1
| Pixel properties | Quadrant properties | ||||||
|---|---|---|---|---|---|---|---|
| Quadrant | DetID | PixID | Counts | Sigma | Mean | Median | Sigma |
| A | 13 | 6 | 19280 | 114.88 | 810 | 797 | 160.9 |
| A | 13 | 254 | 12247 | 71.17 | 810 | 797 | 160.9 |
| A | 3 | 137 | 7608 | 42.33 | 810 | 797 | 160.9 |
| B | 10 | 245 | 4903653 | 35513.86 | 743 | 727 | 138.1 |
| B | 6 | 159 | 1663971 | 12047.54 | 743 | 727 | 138.1 |
| B | 5 | 172 | 121130 | 872.13 | 743 | 727 | 138.1 |
| C | 0 | 10 | 350315 | 1956.32 | 771 | 777 | 178.7 |
| C | 14 | 238 | 133862 | 744.86 | 771 | 777 | 178.7 |
| C | 4 | 175 | 20218 | 108.81 | 771 | 777 | 178.7 |
| D | 8 | 195 | 2139370 | 11558.81 | 777 | 755 | 185.0 |
| D | 2 | 234 | 29156 | 153.5 | 777 | 755 | 185.0 |
| D | 12 | 233 | 24773 | 129.81 | 777 | 755 | 185.0 |
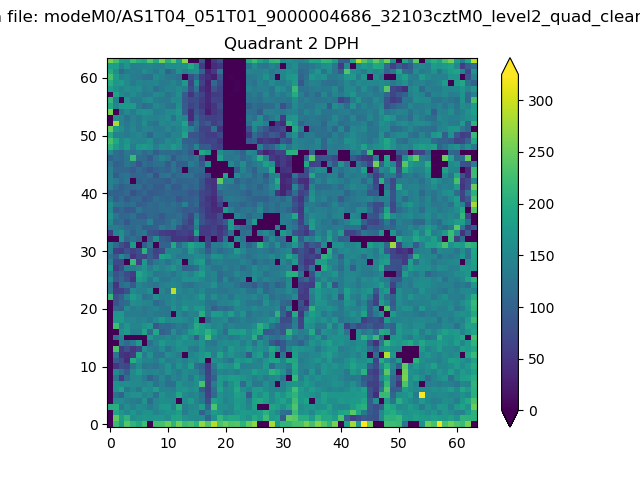
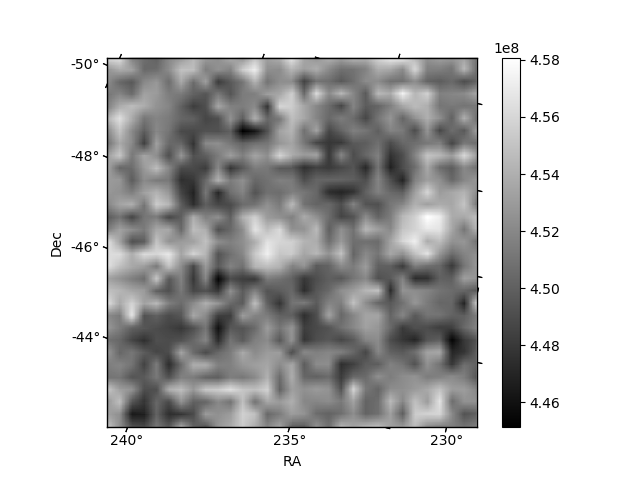
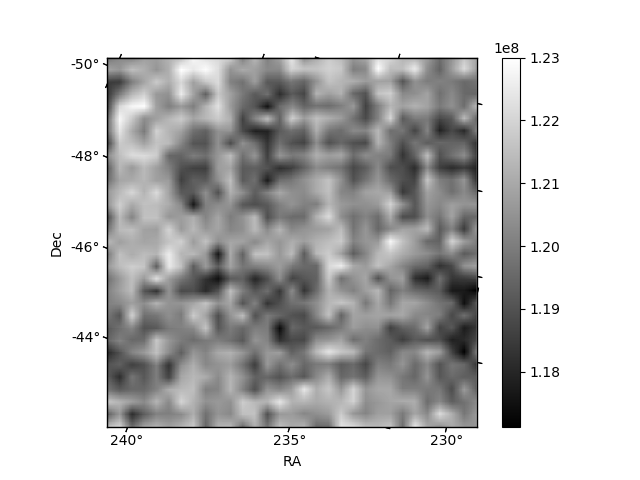
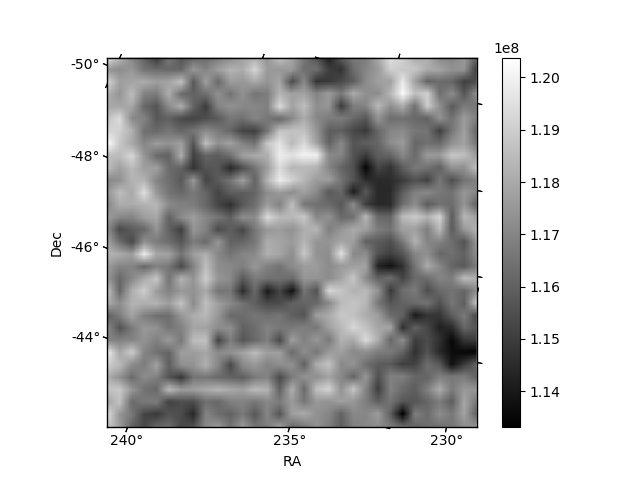
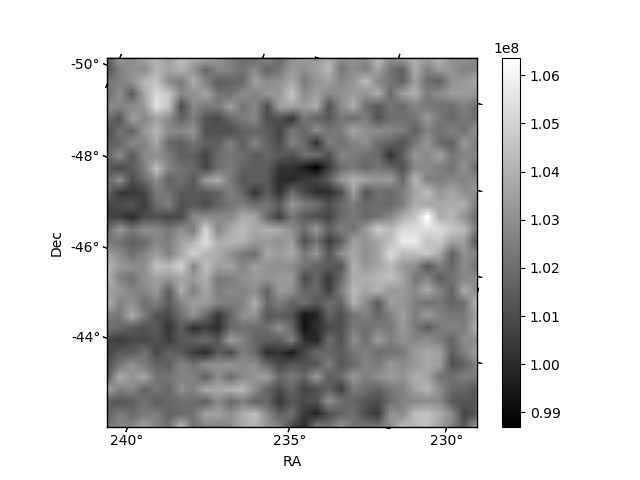
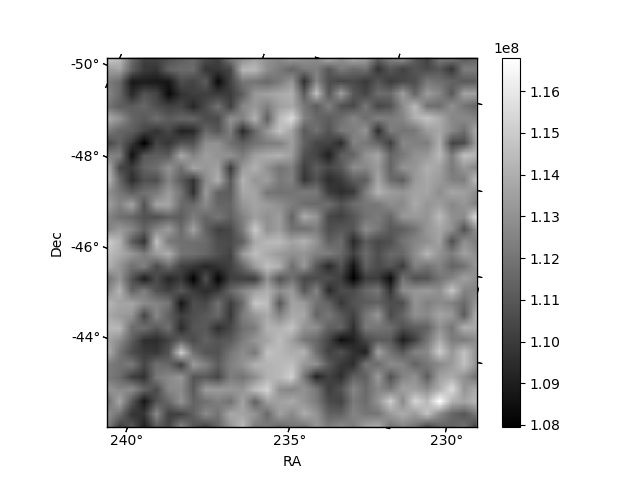
Histogram calculated using DETX and DETY for each event in the final _common_clean file
| Quadrant A | 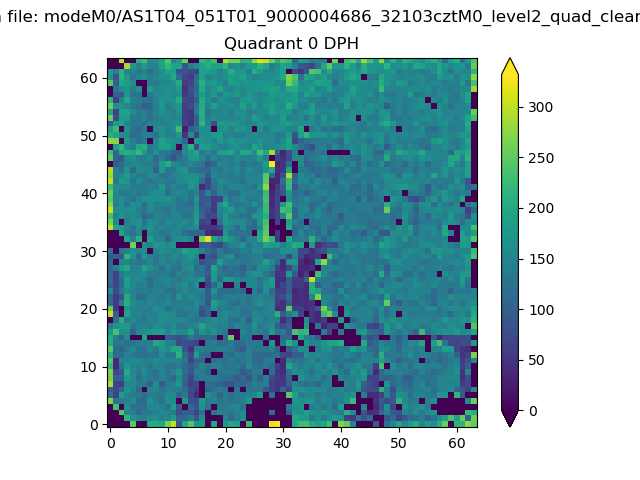 |
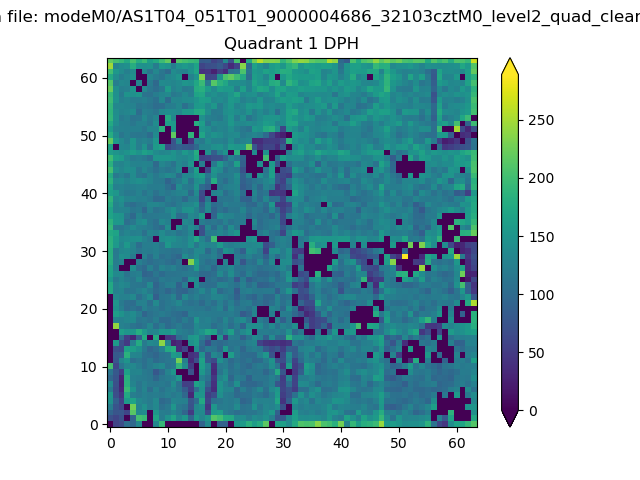 |
Quadrant B |
|---|---|---|---|
| Quadrant D | 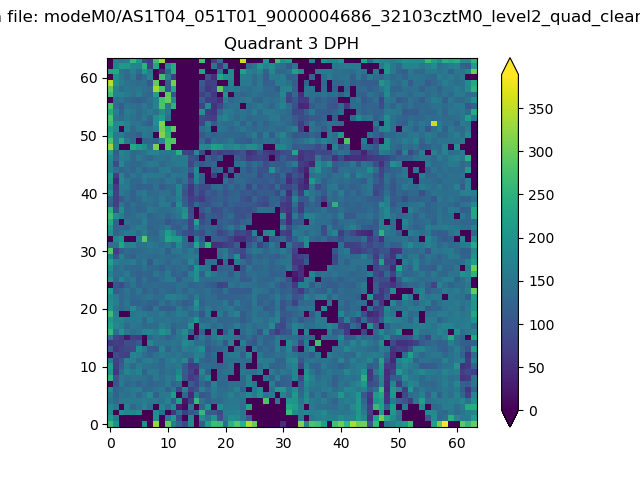 |
 |
Quadrant C |
| Plot type | Count rate plots | Images |
|---|---|---|
| Comparison with Poisson distribution Blue bars denote a histogram of data divided into 1 sec bins. Red curve is a Poisson curve with rate = median count rate of data. |
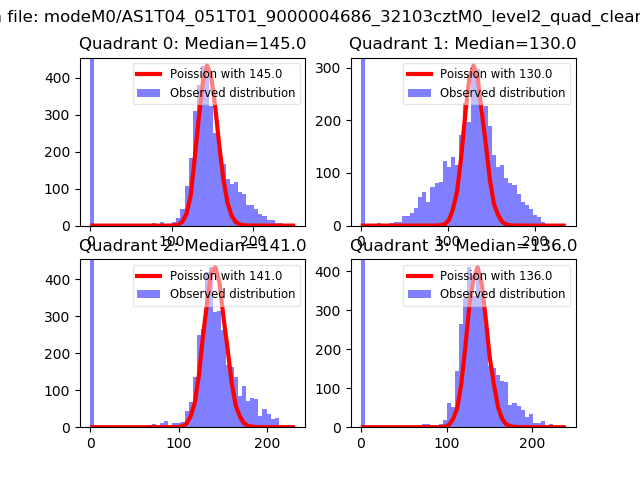 |
 |
| Quadrant-wise count rates Data is divided into 100 sec bins |
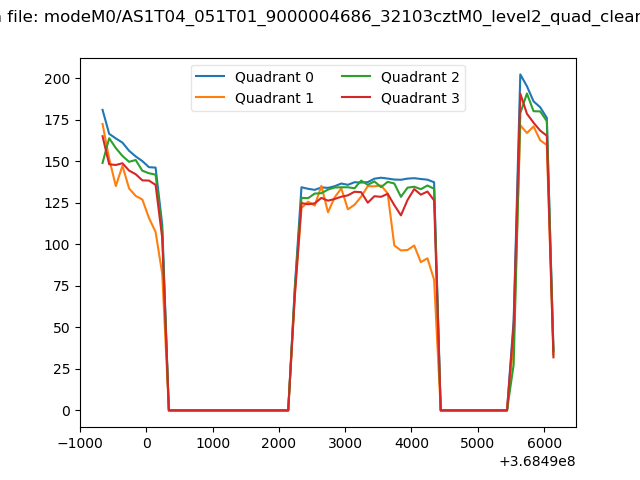 |
|
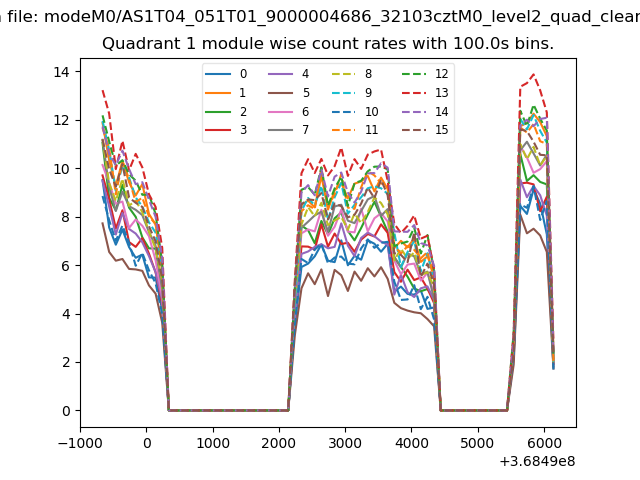
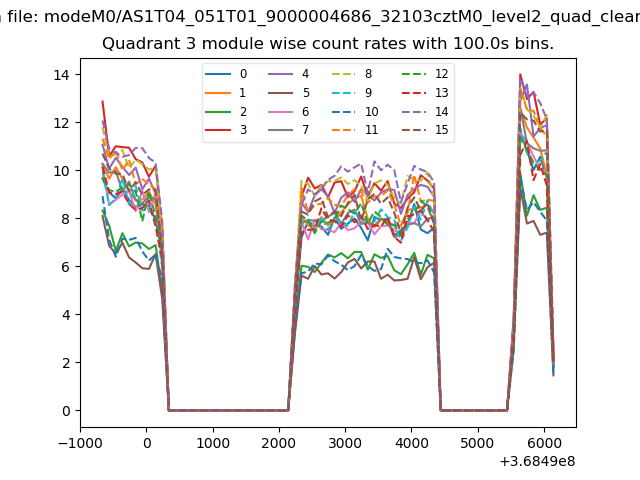
| Module-wise count rates for Quadrant A Data is divided into 100 sec bins |
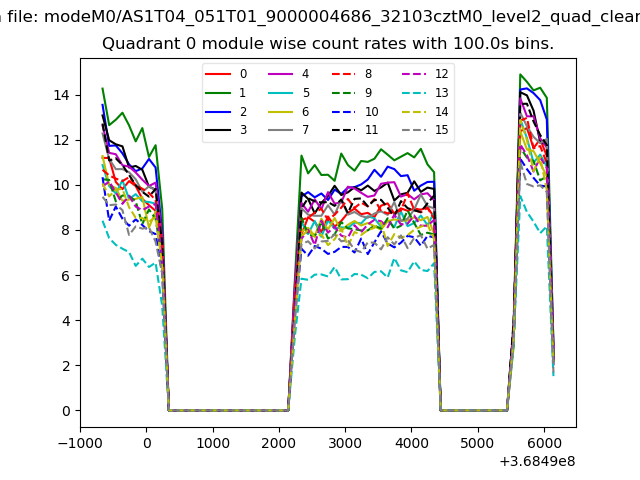 |
 |
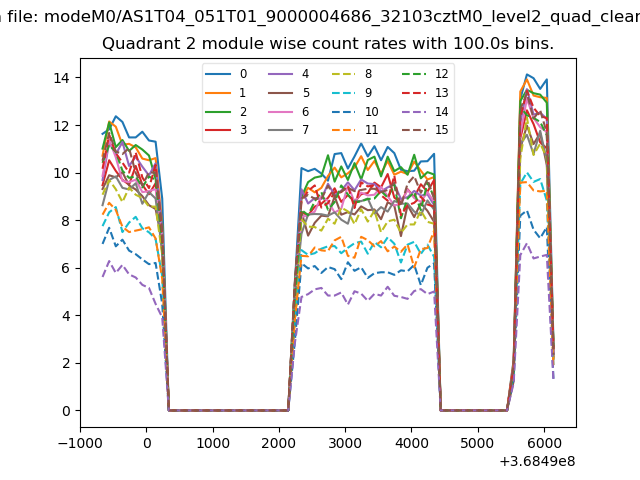
| Module-wise count rates for Quadrant B Data is divided into 100 sec bins |
 |
 |
| Module-wise count rates for Quadrant C Data is divided into 100 sec bins |
 |
 |
| Module-wise count rates for Quadrant D Data is divided into 100 sec bins |
 |
 |
| Parameter | Plot |
|---|---|
| CZT HV Monitor | 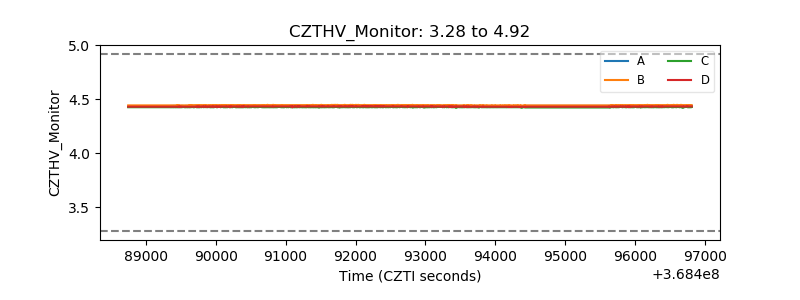 |
| D_VDD | 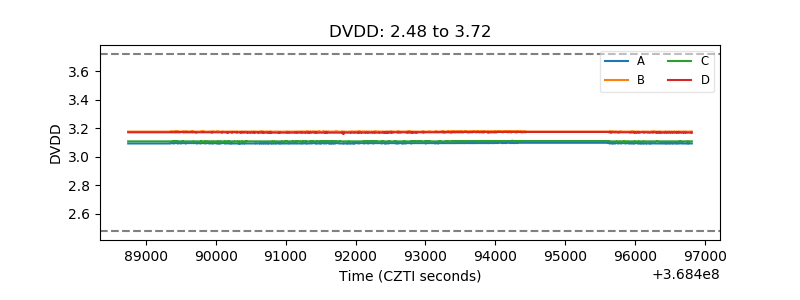 |
| Temperature 1 | 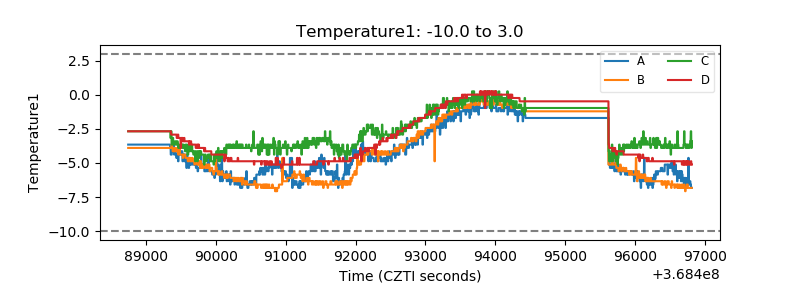 |
| Veto HV Monitor | 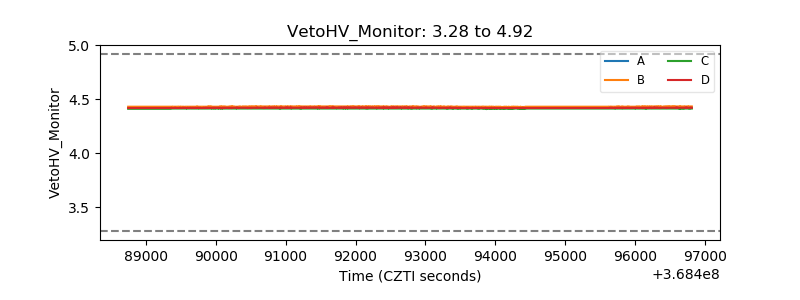 |
| Veto LLD | 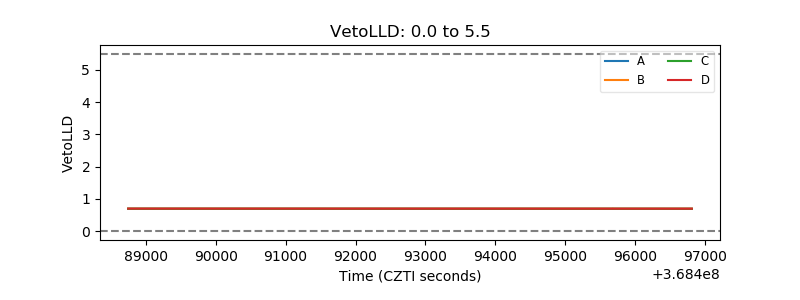 |
| Alpha Counter | 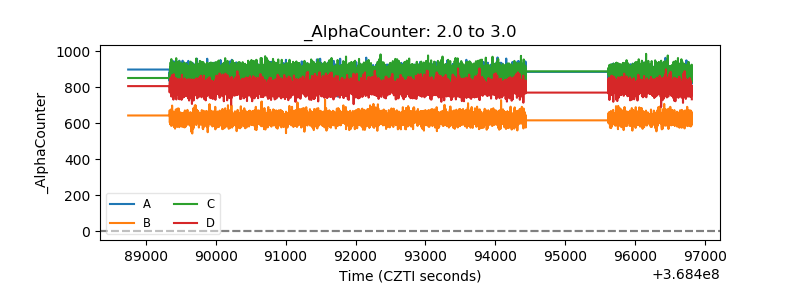 |
| _CPM_Rate | 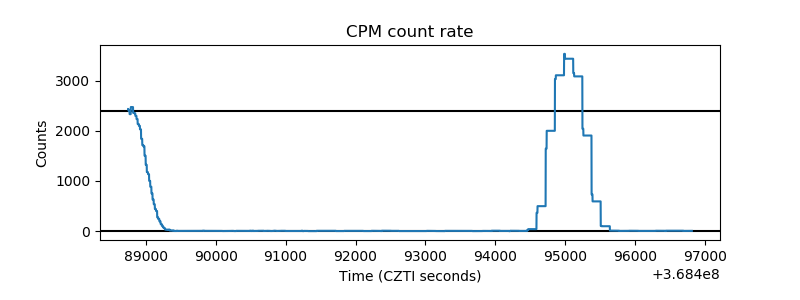 |
| CZT Counter | 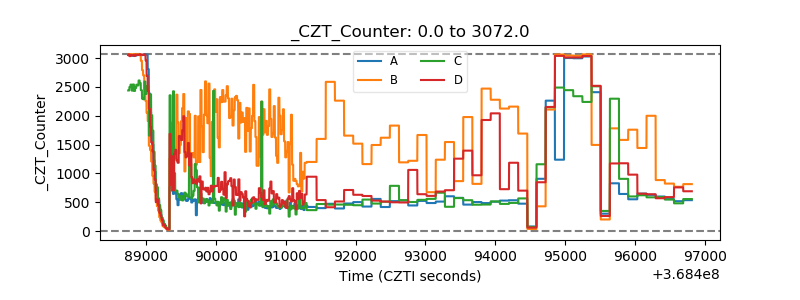 |
| +2.5 Volts monitor |  |
| +5 Volts monitor |  |
| _ROLL_ROT | 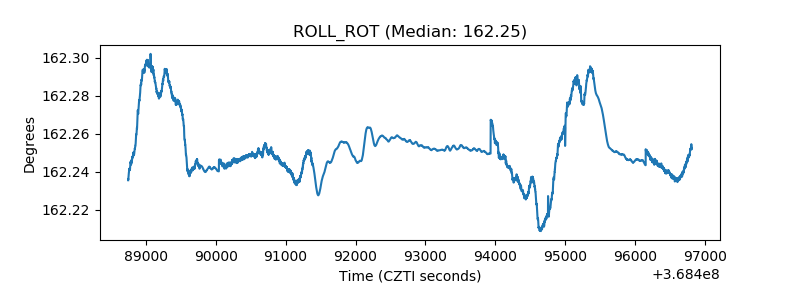 |
| _Roll_DEC | 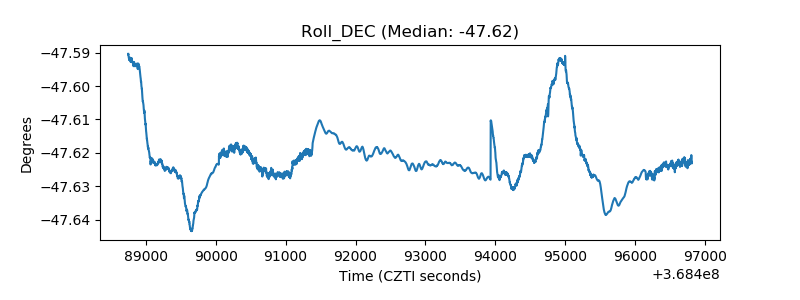 |
| _Roll_RA | 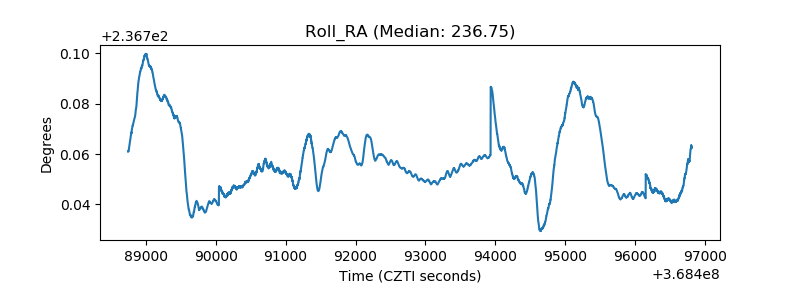 |
| Veto Counter | 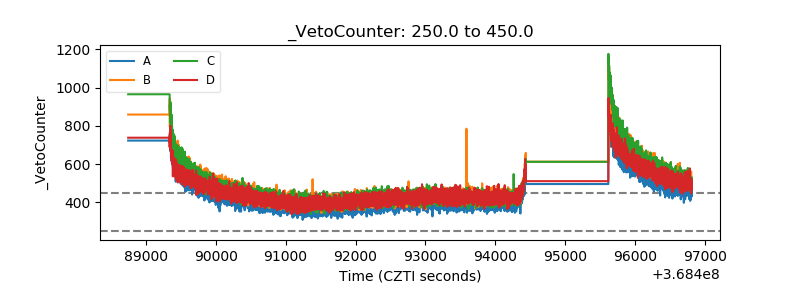 |