| Param | Original file | Final file |
|---|---|---|
| Filename | modeM0/AS1T04_051T01_9000004686_32106cztM0_level2.evt | modeM0/AS1T04_051T01_9000004686_32106cztM0_level2_quad_clean.evt |
| Size (bytes) | 619,332,480 | 80,141,760 |
| Size | 590.6 MB | 76.4 MB |
| Events in quadrant A | 3,552,690 | 505,093 |
| Events in quadrant B | 6,025,588 | 496,649 |
| Events in quadrant C | 4,058,525 | 500,531 |
| Events in quadrant D | 4,693,417 | 483,756 |
| Mode M9 | |||
|---|---|---|---|
| Quadrant | BADHDUFLAG | Total packets | Discarded packets |
| A | 0 | 19 | 0 |
| B | 0 | 20 | 0 |
| C | 0 | 20 | 0 |
| D | 0 | 20 | 0 |
| Mode M0 | |||
|---|---|---|---|
| Quadrant | BADHDUFLAG | Total packets | Discarded packets |
| A | 0 | 14252 | 3 |
| B | 0 | 22004 | 3 |
| C | 0 | 16203 | 3 |
| D | 0 | 18930 | 3 |
| Mode SS | |||
|---|---|---|---|
| Quadrant | BADHDUFLAG | Total packets | Discarded packets |
| A | 0 | 130 | 0 |
| B | 0 | 130 | 0 |
| C | 0 | 130 | 0 |
| D | 0 | 130 | 0 |
| Quadrant | Total seconds | Saturated seconds | Saturation percentage |
|---|---|---|---|
| A | 6309 | 79 | 1.252179% |
| B | 6309 | 244 | 3.867491% |
| C | 6309 | 342 | 5.420827% |
| D | 6309 | 81 | 1.283880% |
Noise dominated data is calculated using 1-second bins in cleaned event files. If a bin has >2000 counts, and if more than 50% of those come from <1% of pixels, then it is considered to be noise-dominated and hence unusable.
| Quadrant | # 1 sec bins | Bins with >0 counts | Bins with >2000 counts | High rate bins dominated by noise | Noise dominated (total time) | Noise dominated (detector-on time) | Marked lightcurve |
|---|---|---|---|---|---|---|---|
| A | 7699 | 6310 | 1 | 1 | 0.01% | 0.02% | 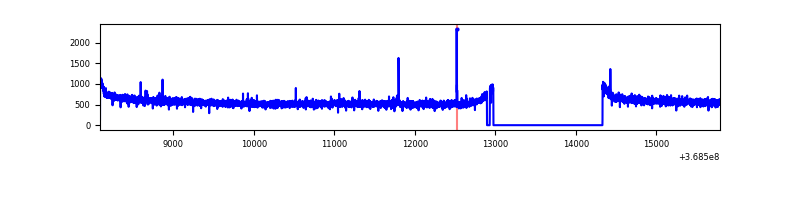 |
| B | 7699 | 6309 | 18 | 18 | 0.23% | 0.29% | 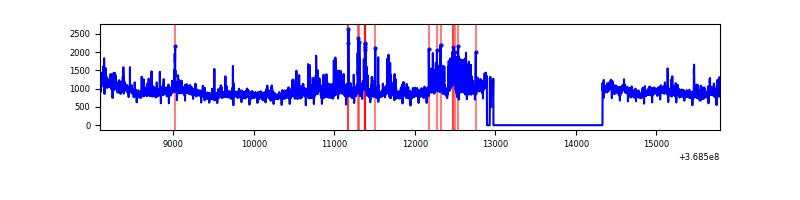 |
| C | 7699 | 6310 | 30 | 30 | 0.39% | 0.48% | 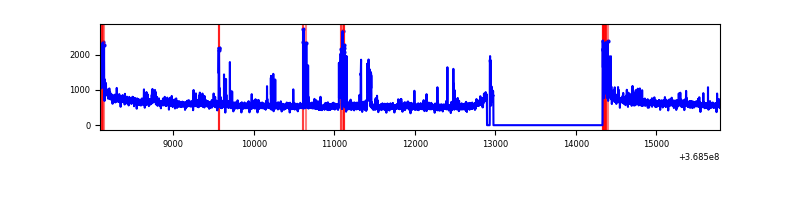 |
| D | 7699 | 6310 | 9 | 9 | 0.12% | 0.14% | 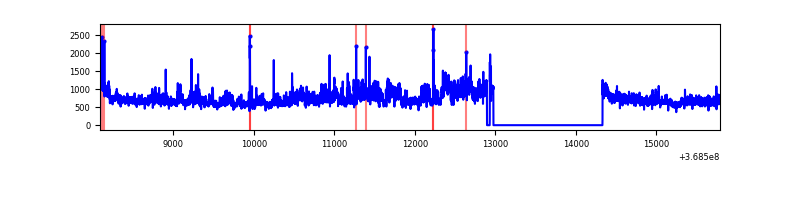 |
Top three noisy pixels from each quadrant. If the there are fewer than three noisy pixels in the level2.evt file, extra rows are filled as -1
| Pixel properties | Quadrant properties | ||||||
|---|---|---|---|---|---|---|---|
| Quadrant | DetID | PixID | Counts | Sigma | Mean | Median | Sigma |
| A | 2 | 79 | 12697 | 66.35 | 914 | 900 | 177.8 |
| A | 13 | 254 | 11822 | 61.43 | 914 | 900 | 177.8 |
| A | 3 | 137 | 7962 | 39.72 | 914 | 900 | 177.8 |
| B | 6 | 159 | 1711694 | 10521.2 | 898 | 880 | 162.6 |
| B | 10 | 245 | 605363 | 3717.46 | 898 | 880 | 162.6 |
| B | 4 | 80 | 62287 | 377.64 | 898 | 880 | 162.6 |
| C | 0 | 10 | 329056 | 1659.25 | 878 | 889 | 197.8 |
| C | 14 | 238 | 182238 | 916.92 | 878 | 889 | 197.8 |
| C | 4 | 175 | 50349 | 250.08 | 878 | 889 | 197.8 |
| D | 8 | 195 | 1223243 | 5827.79 | 896 | 874 | 209.7 |
| D | 12 | 233 | 48607 | 227.57 | 896 | 874 | 209.7 |
| D | 2 | 250 | 35732 | 166.19 | 896 | 874 | 209.7 |
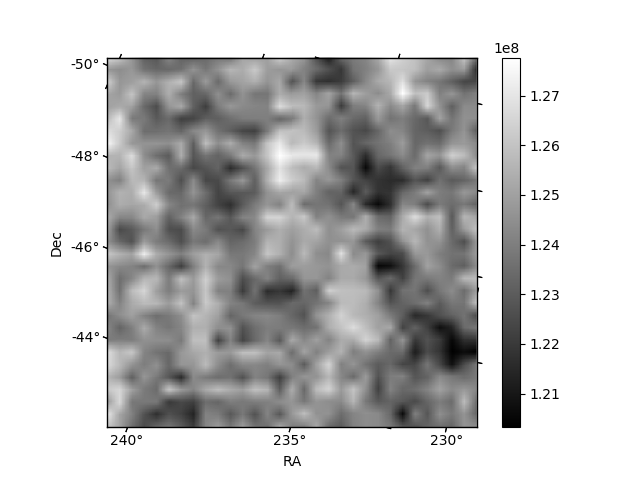
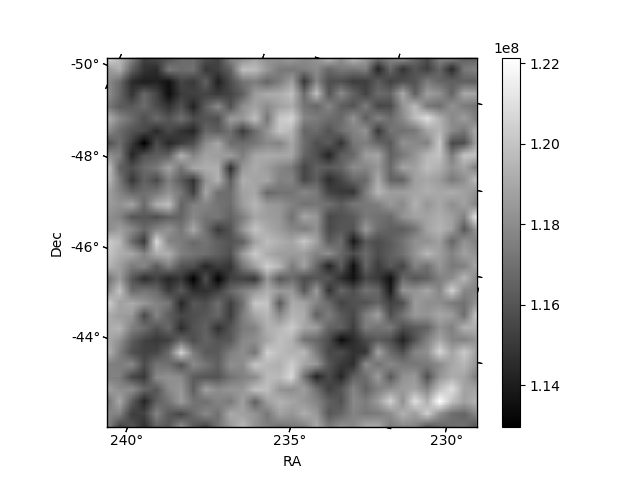
Histogram calculated using DETX and DETY for each event in the final _common_clean file
| Quadrant A | 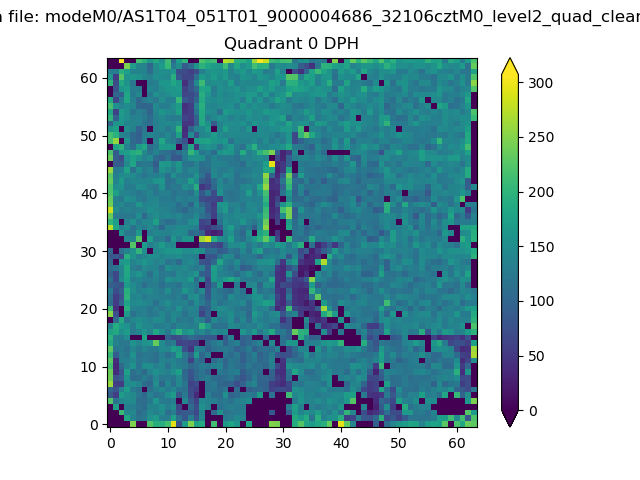 |
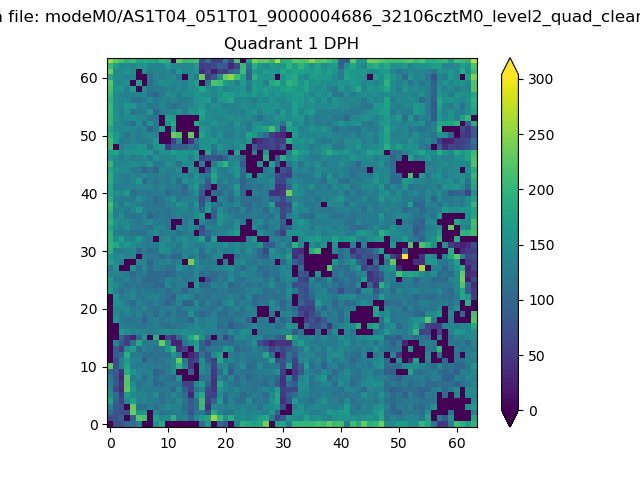 |
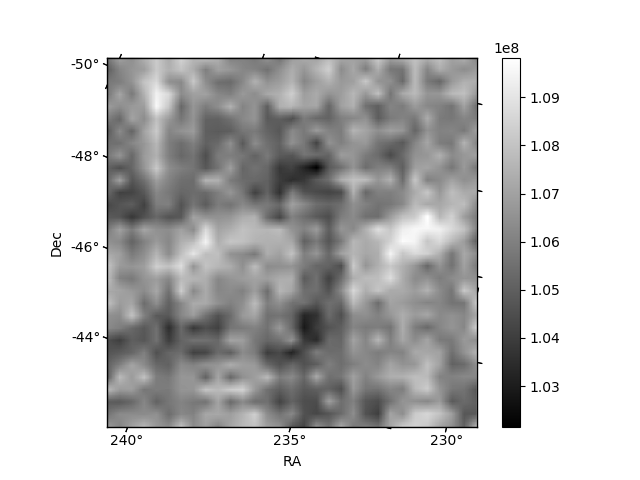
Quadrant B |
|---|---|---|---|
| Quadrant D | 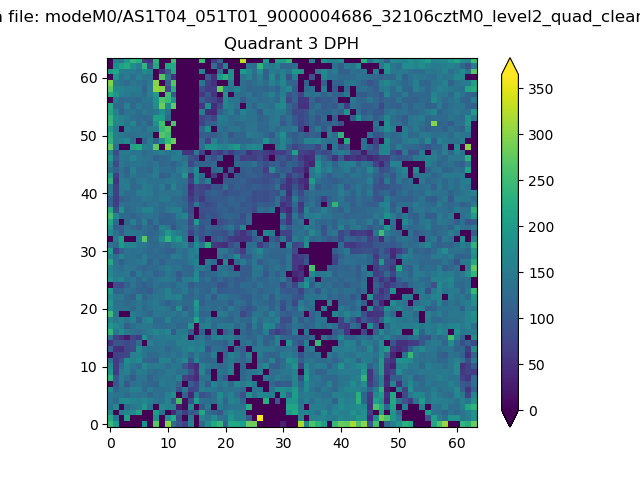 |
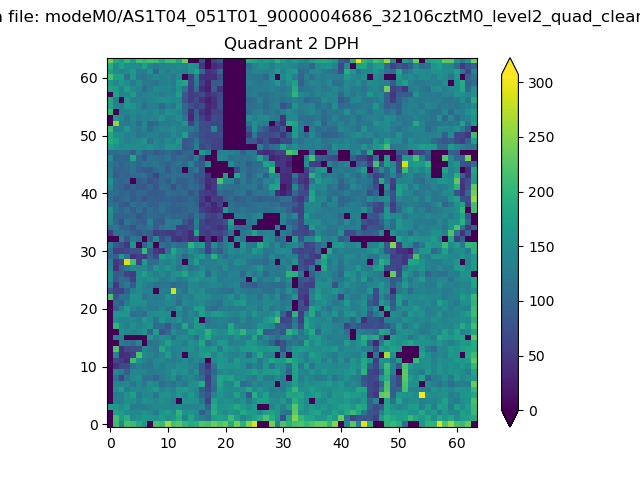 |
Quadrant C |
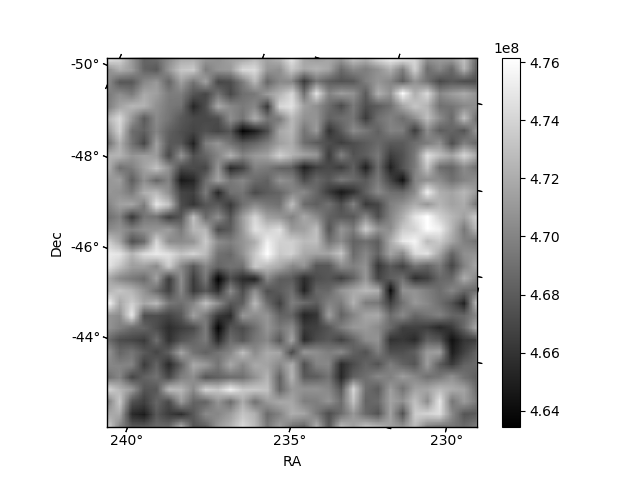
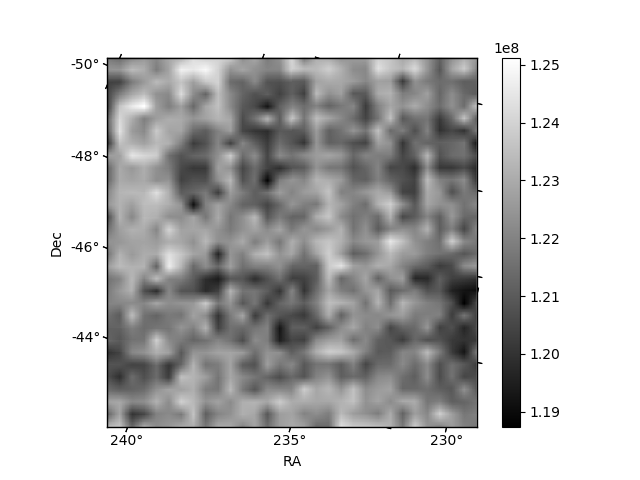
| Plot type | Count rate plots | Images |
|---|---|---|
| Comparison with Poisson distribution Blue bars denote a histogram of data divided into 1 sec bins. Red curve is a Poisson curve with rate = median count rate of data. |
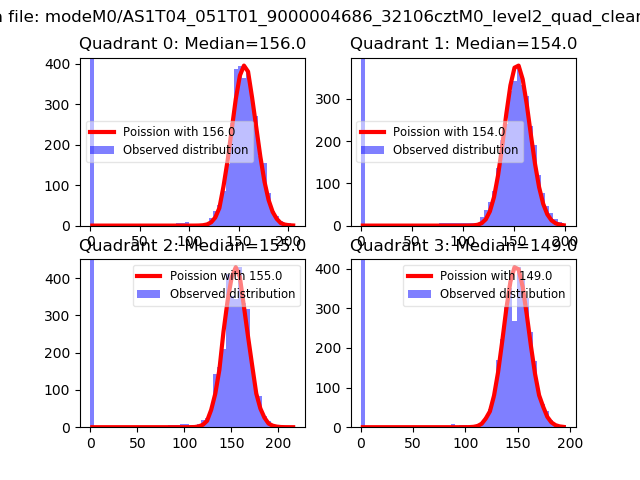 |
 |
| Quadrant-wise count rates Data is divided into 100 sec bins |
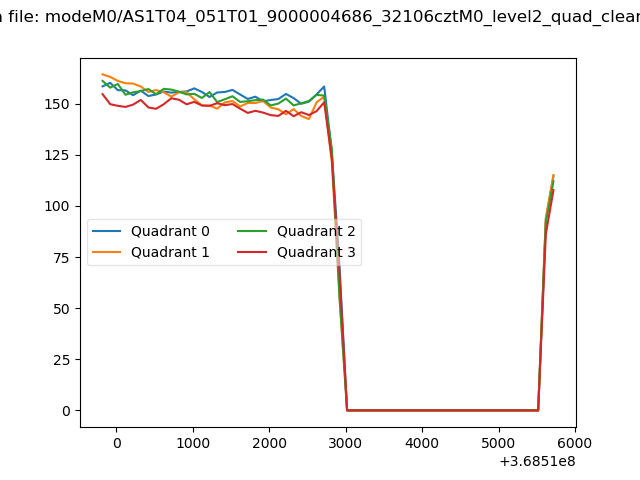 |
|
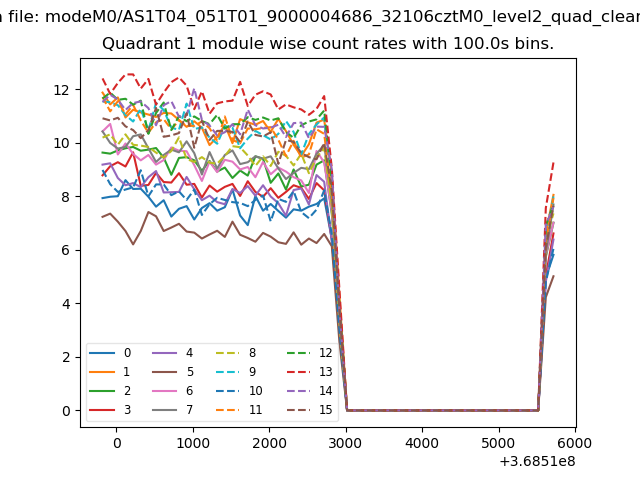
| Module-wise count rates for Quadrant A Data is divided into 100 sec bins |
 |
 |
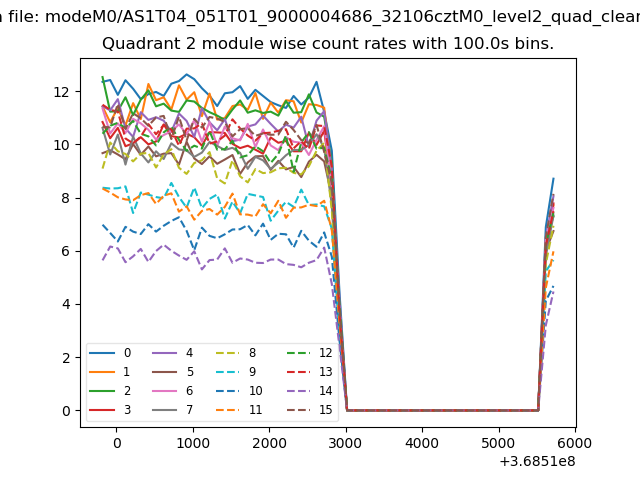
| Module-wise count rates for Quadrant B Data is divided into 100 sec bins |
 |
 |
| Module-wise count rates for Quadrant C Data is divided into 100 sec bins |
 |
 |
| Module-wise count rates for Quadrant D Data is divided into 100 sec bins |
 |
 |
| Parameter | Plot |
|---|---|
| CZT HV Monitor | 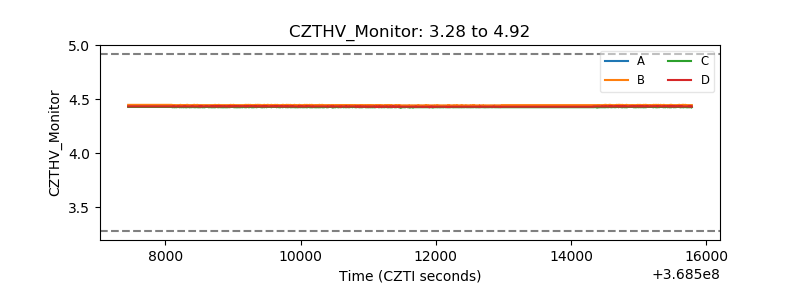 |
| D_VDD |  |
| Temperature 1 | 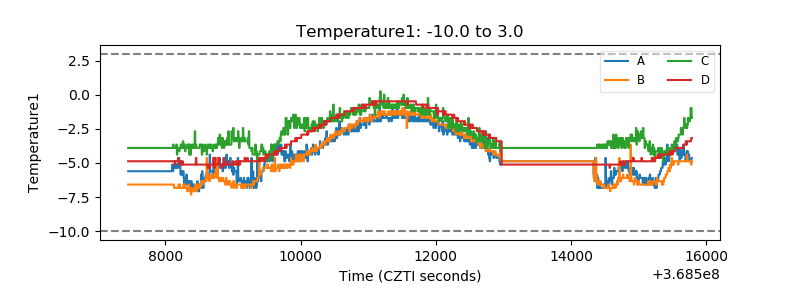 |
| Veto HV Monitor | 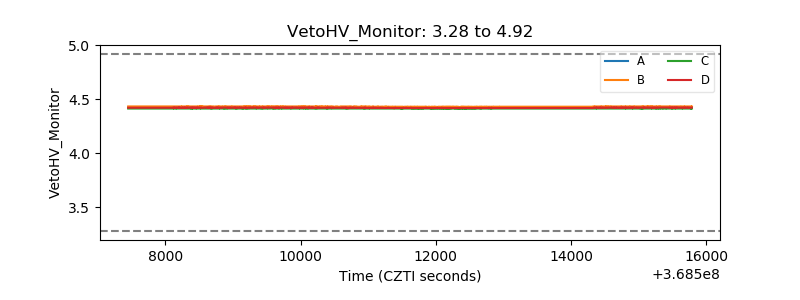 |
| Veto LLD | 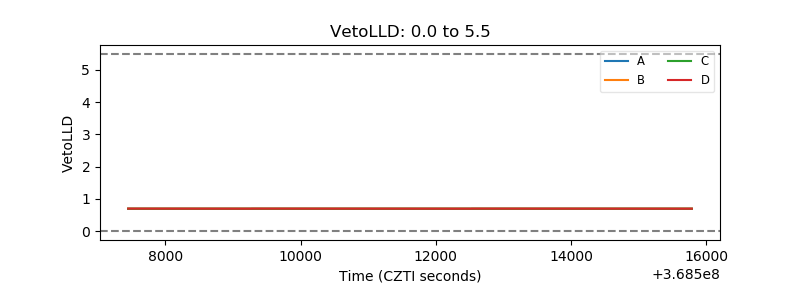 |
| Alpha Counter | 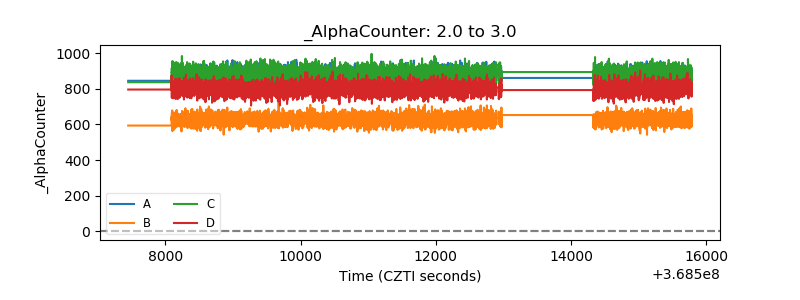 |
| _CPM_Rate | 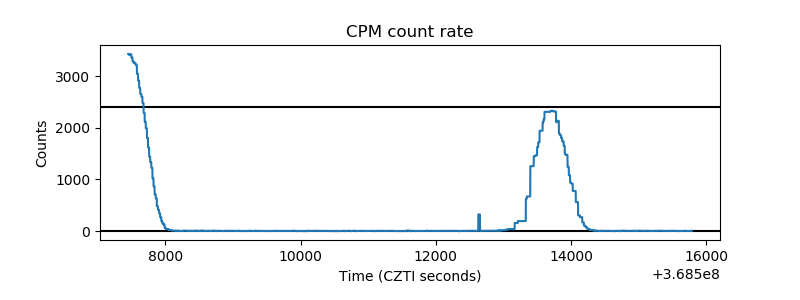 |
| CZT Counter | 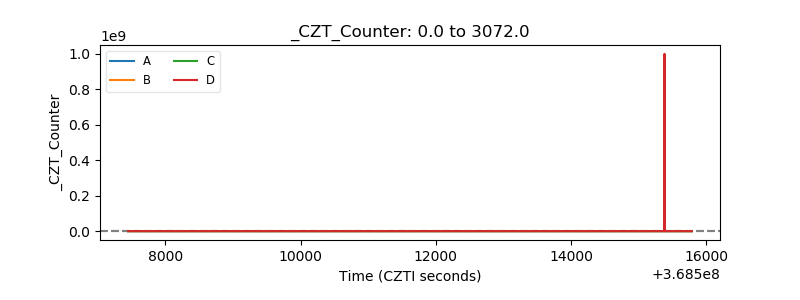 |
| +2.5 Volts monitor | 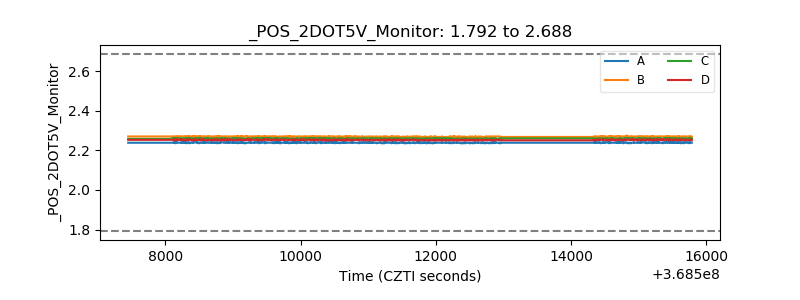 |
| +5 Volts monitor |  |
| _ROLL_ROT | 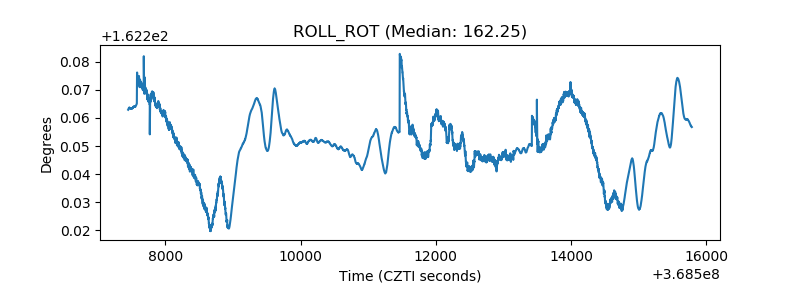 |
| _Roll_DEC | 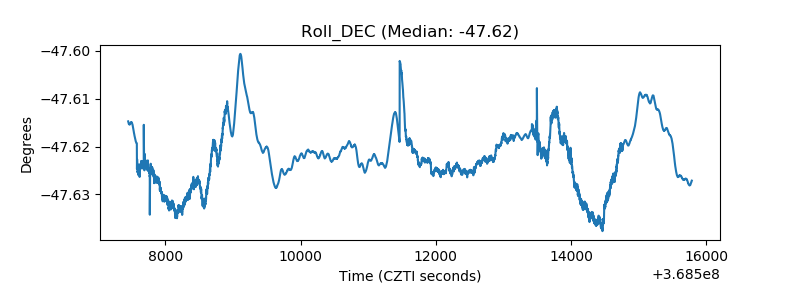 |
| _Roll_RA | 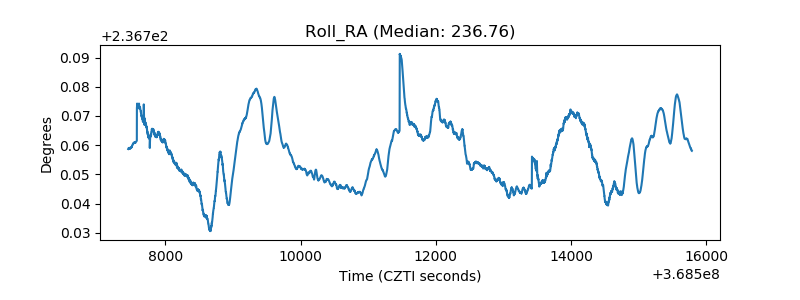 |
| Veto Counter | 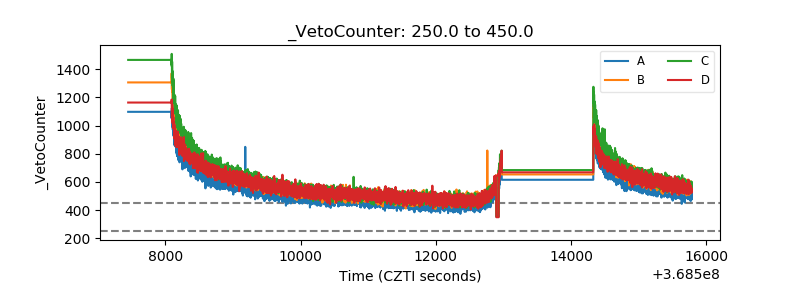 |