| Param | Original file | Final file |
|---|---|---|
| Filename | modeM0/AS1T04_051T01_9000004686_32110cztM0_level2.evt | modeM0/AS1T04_051T01_9000004686_32110cztM0_level2_quad_clean.evt |
| Size (bytes) | 1,605,240,000 | 271,584,000 |
| Size | 1.5 GB | 259.0 MB |
| Events in quadrant A | 8,671,415 | 1,815,734 |
| Events in quadrant B | 15,857,722 | 1,748,164 |
| Events in quadrant C | 9,412,543 | 1,770,663 |
| Events in quadrant D | 13,519,540 | 1,709,301 |
| Mode M9 | |||
|---|---|---|---|
| Quadrant | BADHDUFLAG | Total packets | Discarded packets |
| A | 0 | 26 | 0 |
| B | 0 | 27 | 1 |
| C | 0 | 26 | 0 |
| D | 0 | 29 | 3 |
| Mode M0 | |||
|---|---|---|---|
| Quadrant | BADHDUFLAG | Total packets | Discarded packets |
| A | 0 | 37961 | 1931 |
| B | 0 | 61743 | 3084 |
| C | 0 | 40362 | 1981 |
| D | 0 | 55957 | 3027 |
| Mode SS | |||
|---|---|---|---|
| Quadrant | BADHDUFLAG | Total packets | Discarded packets |
| A | 0 | 369 | 19 |
| B | 0 | 370 | 20 |
| C | 0 | 373 | 23 |
| D | 0 | 369 | 19 |
| Quadrant | Total seconds | Saturated seconds | Saturation percentage |
|---|---|---|---|
| A | 17141 | 440 | 2.566945% |
| B | 17132 | 1378 | 8.043428% |
| C | 17151 | 909 | 5.299983% |
| D | 17123 | 529 | 3.089412% |
Noise dominated data is calculated using 1-second bins in cleaned event files. If a bin has >2000 counts, and if more than 50% of those come from <1% of pixels, then it is considered to be noise-dominated and hence unusable.
| Quadrant | # 1 sec bins | Bins with >0 counts | Bins with >2000 counts | High rate bins dominated by noise | Noise dominated (total time) | Noise dominated (detector-on time) | Marked lightcurve |
|---|---|---|---|---|---|---|---|
| A | 23033 | 17167 | 0 | 0 | 0.00% | 0.00% | 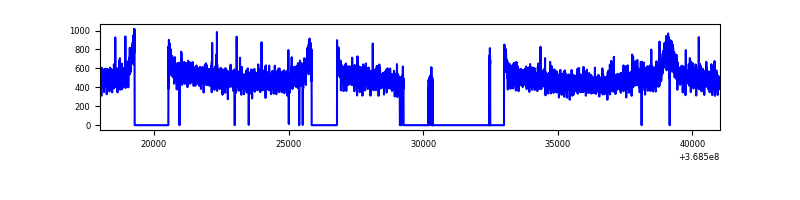 |
| B | 23032 | 17154 | 585 | 585 | 2.54% | 3.41% |  |
| C | 23035 | 17175 | 55 | 55 | 0.24% | 0.32% | 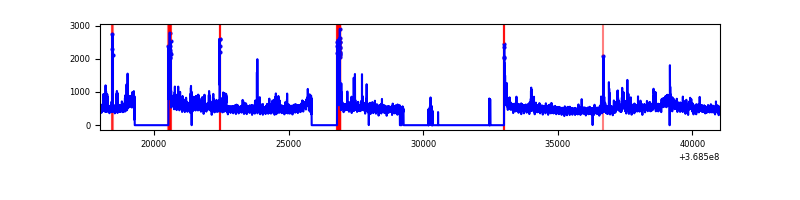 |
| D | 23031 | 17154 | 157 | 157 | 0.68% | 0.92% | 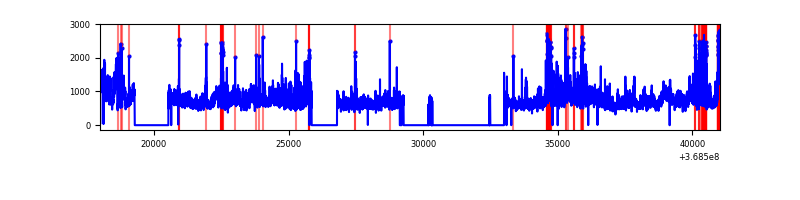 |
Top three noisy pixels from each quadrant. If the there are fewer than three noisy pixels in the level2.evt file, extra rows are filled as -1
| Pixel properties | Quadrant properties | ||||||
|---|---|---|---|---|---|---|---|
| Quadrant | DetID | PixID | Counts | Sigma | Mean | Median | Sigma |
| A | 13 | 6 | 35250 | 74.47 | 2237 | 2195 | 443.9 |
| A | 13 | 254 | 34959 | 73.81 | 2237 | 2195 | 443.9 |
| A | 3 | 137 | 21868 | 44.32 | 2237 | 2195 | 443.9 |
| B | 6 | 159 | 4609917 | 11422.56 | 2156 | 2104 | 403.4 |
| B | 10 | 245 | 2140817 | 5301.77 | 2156 | 2104 | 403.4 |
| B | 0 | 190 | 242669 | 596.35 | 2156 | 2104 | 403.4 |
| C | 14 | 238 | 421188 | 860.95 | 2112 | 2126 | 486.7 |
| C | 0 | 10 | 360411 | 736.09 | 2112 | 2126 | 486.7 |
| C | 3 | 233 | 173302 | 351.68 | 2112 | 2126 | 486.7 |
| D | 8 | 195 | 3777914 | 7451.14 | 2159 | 2104 | 506.7 |
| D | 12 | 79 | 698385 | 1374.03 | 2159 | 2104 | 506.7 |
| D | 12 | 233 | 685257 | 1348.13 | 2159 | 2104 | 506.7 |
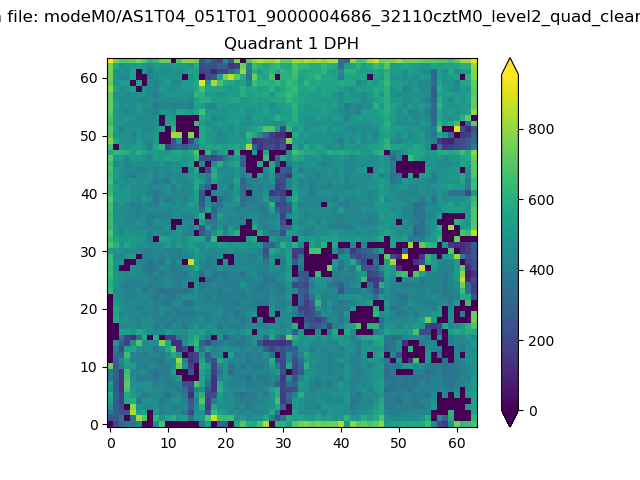
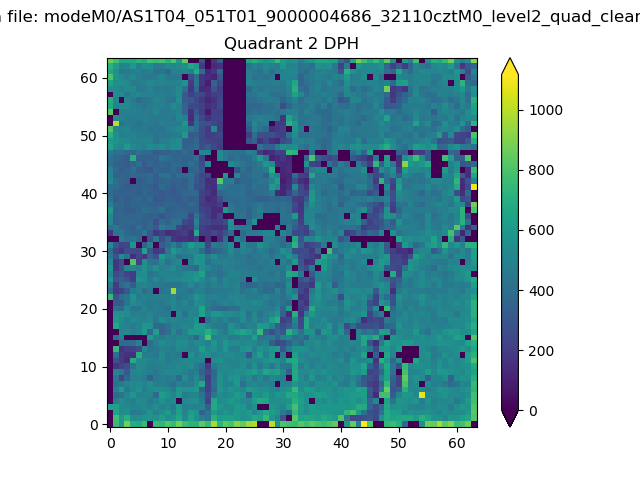
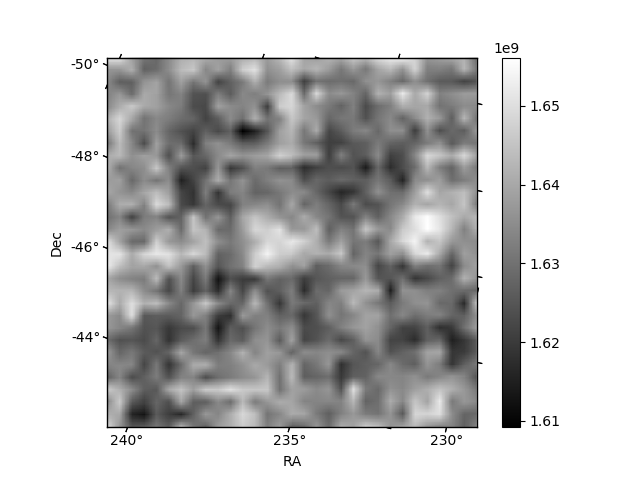
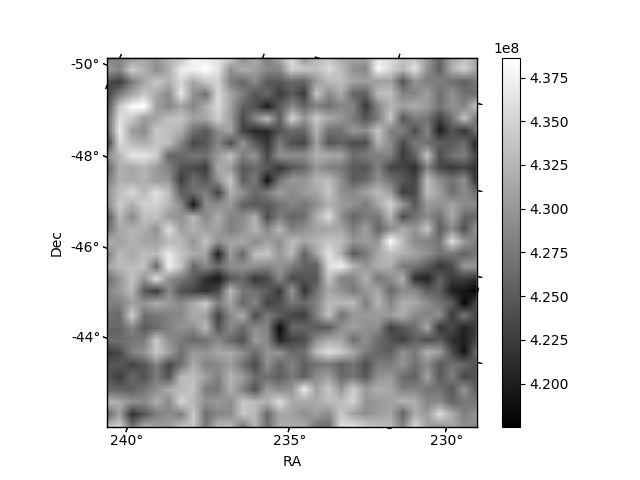
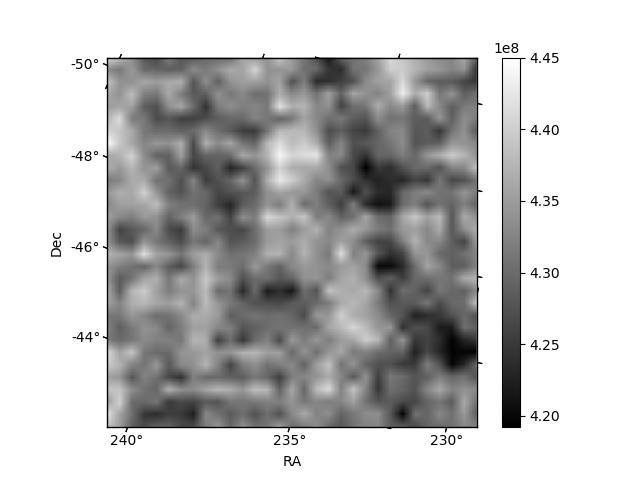
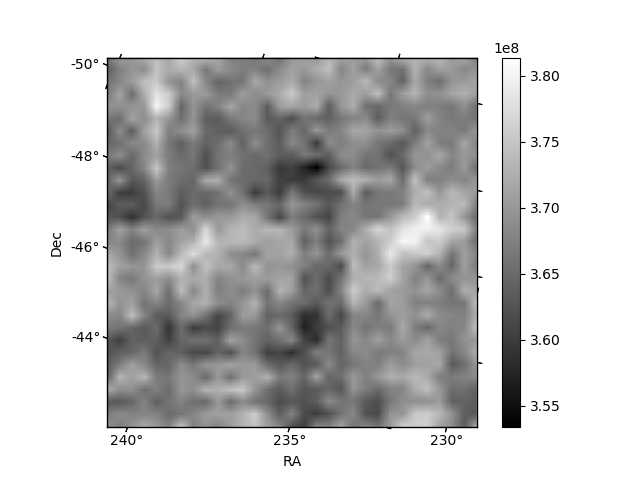
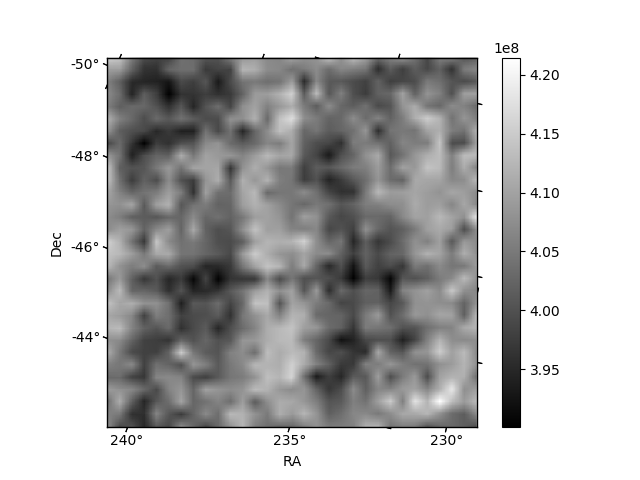
Histogram calculated using DETX and DETY for each event in the final _common_clean file
| Quadrant A | 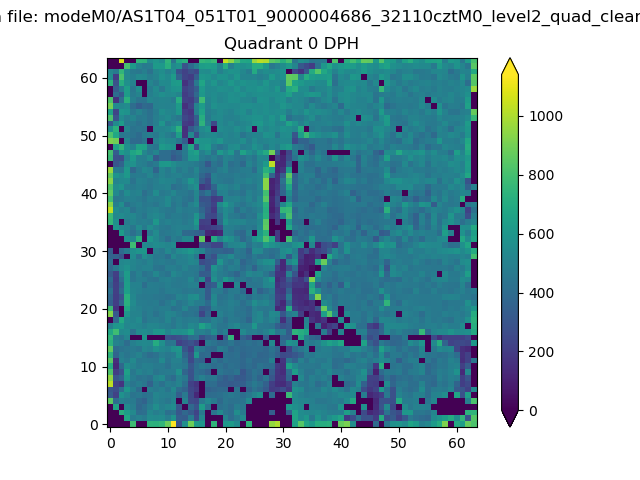 |
 |
Quadrant B |
|---|---|---|---|
| Quadrant D | 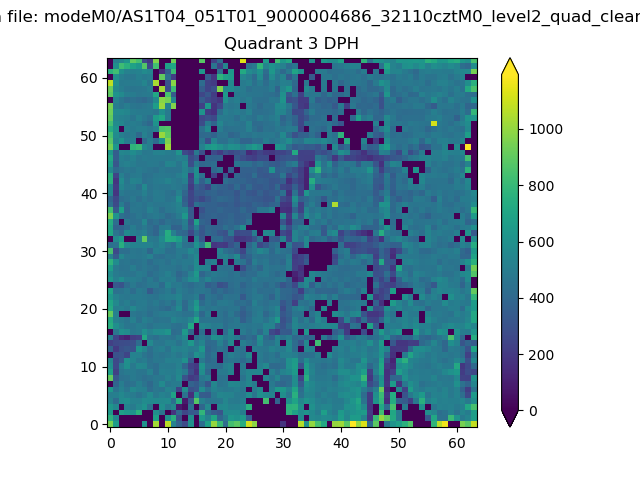 |
 |
Quadrant C |
| Plot type | Count rate plots | Images |
|---|---|---|
| Comparison with Poisson distribution Blue bars denote a histogram of data divided into 1 sec bins. Red curve is a Poisson curve with rate = median count rate of data. |
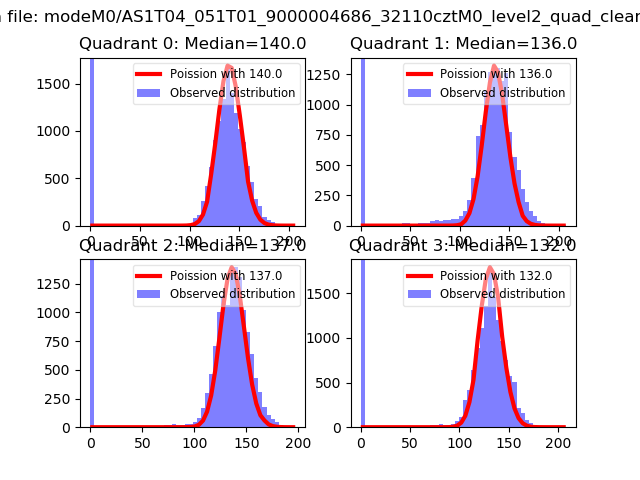 |
 |
| Quadrant-wise count rates Data is divided into 100 sec bins |
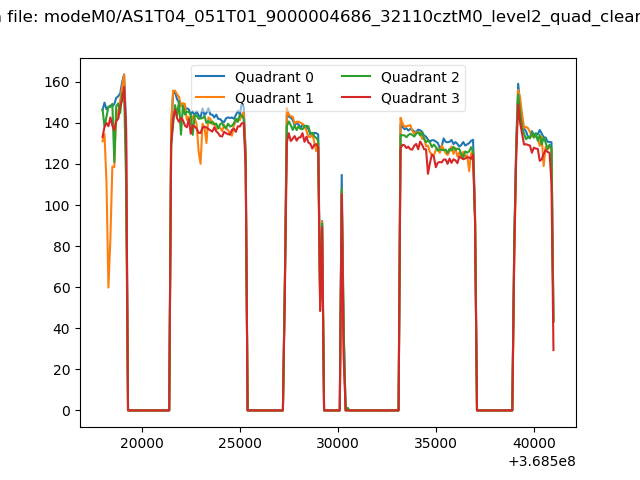 |
|
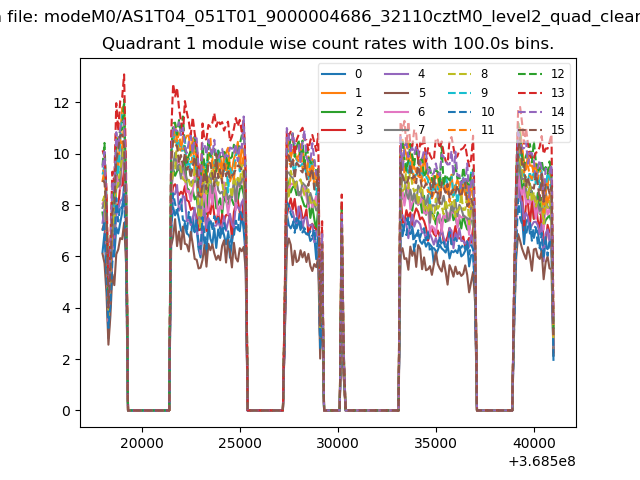
| Module-wise count rates for Quadrant A Data is divided into 100 sec bins |
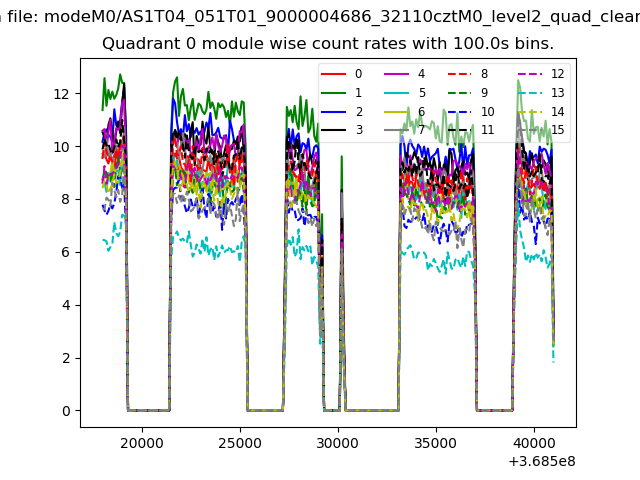 |
 |
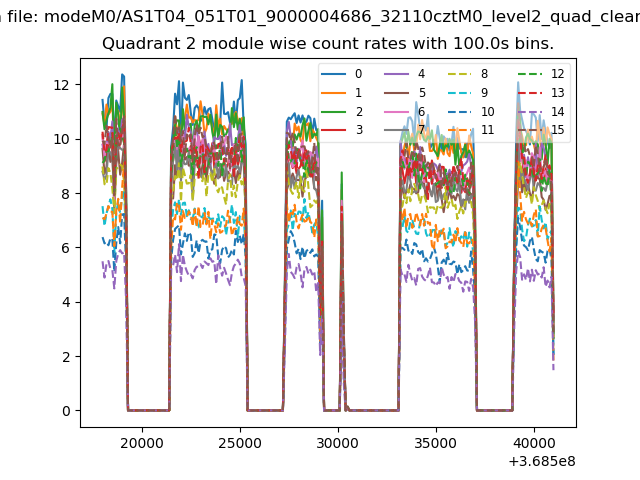
| Module-wise count rates for Quadrant B Data is divided into 100 sec bins |
 |
 |
| Module-wise count rates for Quadrant C Data is divided into 100 sec bins |
 |
 |
| Module-wise count rates for Quadrant D Data is divided into 100 sec bins |
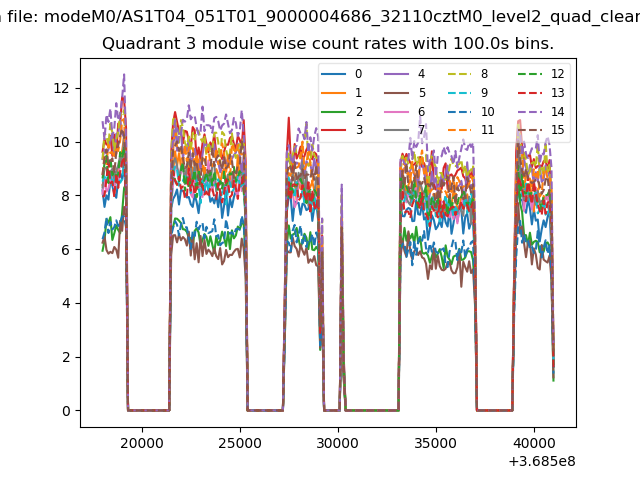 |
 |
| Parameter | Plot |
|---|---|
| CZT HV Monitor | 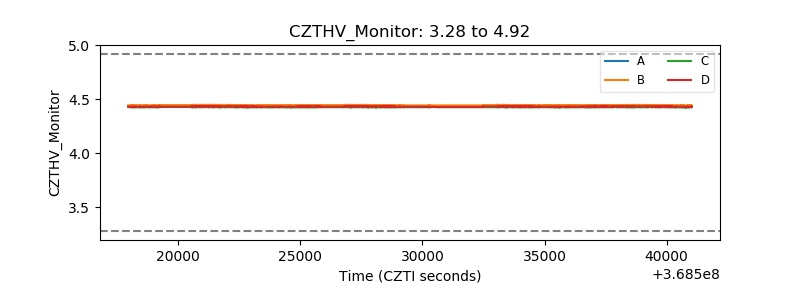 |
| D_VDD | 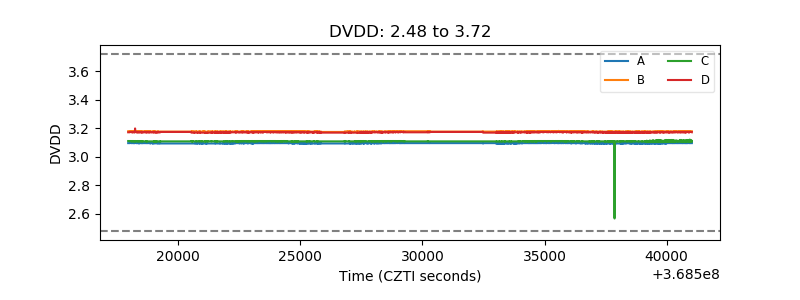 |
| Temperature 1 | 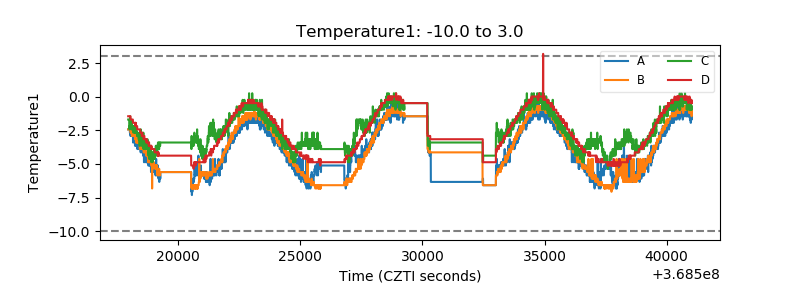 |
| Veto HV Monitor |  |
| Veto LLD | 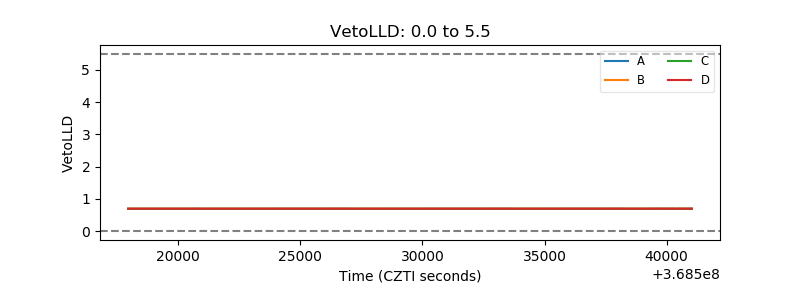 |
| Alpha Counter | 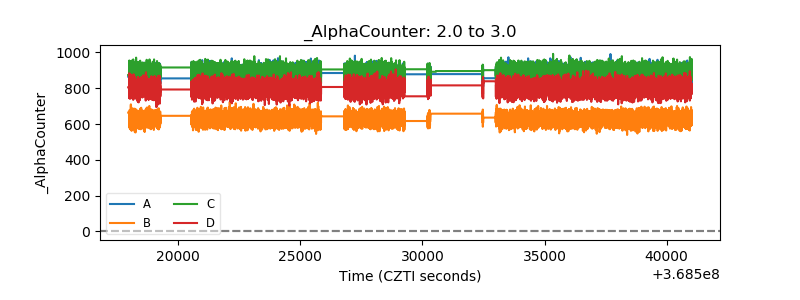 |
| _CPM_Rate | 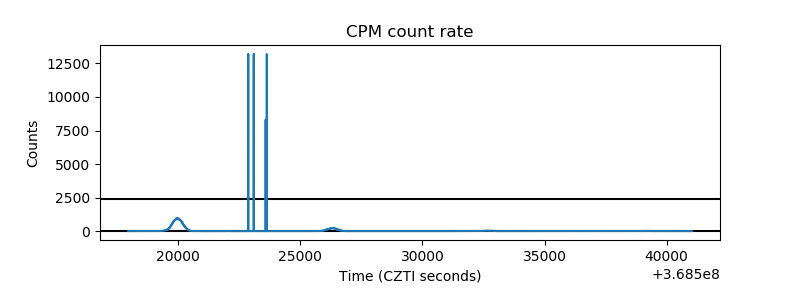 |
| CZT Counter | 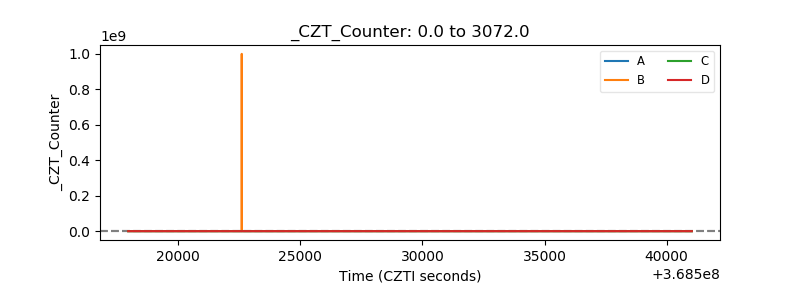 |
| +2.5 Volts monitor |  |
| +5 Volts monitor |  |
| _ROLL_ROT | 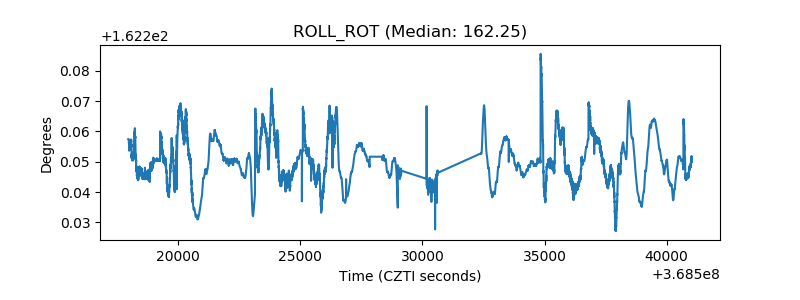 |
| _Roll_DEC | 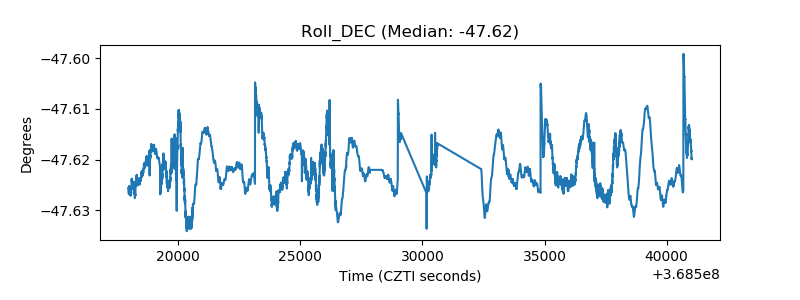 |
| _Roll_RA | 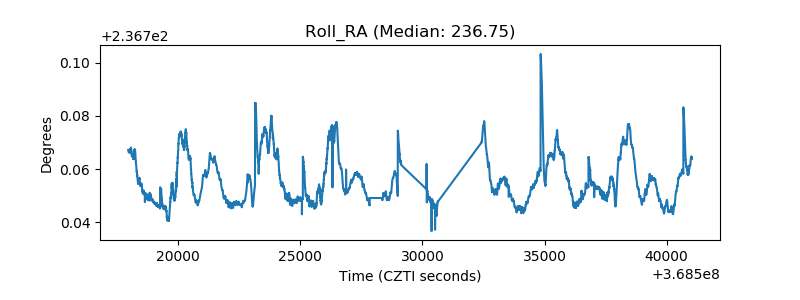 |
| Veto Counter | 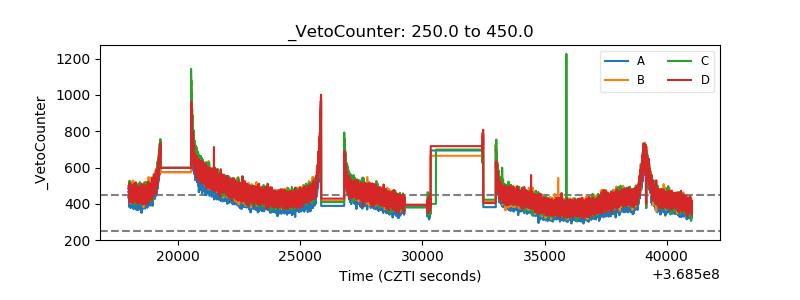 |