| Param | Original file | Final file |
|---|---|---|
| Filename | modeM0/AS1T04_051T01_9000004686_32111cztM0_level2.evt | modeM0/AS1T04_051T01_9000004686_32111cztM0_level2_quad_clean.evt |
| Size (bytes) | 747,158,400 | 126,037,440 |
| Size | 712.5 MB | 120.2 MB |
| Events in quadrant A | 4,117,020 | 831,713 |
| Events in quadrant B | 7,020,852 | 815,217 |
| Events in quadrant C | 4,321,473 | 815,674 |
| Events in quadrant D | 6,612,701 | 782,776 |
| Mode M9 | |||
|---|---|---|---|
| Quadrant | BADHDUFLAG | Total packets | Discarded packets |
| A | 0 | 1 | 0 |
| B | 0 | 1 | 0 |
| C | 0 | 1 | 0 |
| D | 0 | 1 | 0 |
| Mode M0 | |||
|---|---|---|---|
| Quadrant | BADHDUFLAG | Total packets | Discarded packets |
| A | 0 | 17386 | 2 |
| B | 0 | 26533 | 2 |
| C | 0 | 17993 | 2 |
| D | 0 | 25443 | 2 |
| Mode SS | |||
|---|---|---|---|
| Quadrant | BADHDUFLAG | Total packets | Discarded packets |
| A | 0 | 166 | 0 |
| B | 0 | 166 | 0 |
| C | 0 | 166 | 0 |
| D | 0 | 166 | 0 |
| Quadrant | Total seconds | Saturated seconds | Saturation percentage |
|---|---|---|---|
| A | 8223 | 308 | 3.745592% |
| B | 8224 | 590 | 7.174125% |
| C | 8224 | 333 | 4.049125% |
| D | 8224 | 317 | 3.854572% |
Noise dominated data is calculated using 1-second bins in cleaned event files. If a bin has >2000 counts, and if more than 50% of those come from <1% of pixels, then it is considered to be noise-dominated and hence unusable.
| Quadrant | # 1 sec bins | Bins with >0 counts | Bins with >2000 counts | High rate bins dominated by noise | Noise dominated (total time) | Noise dominated (detector-on time) | Marked lightcurve |
|---|---|---|---|---|---|---|---|
| A | 8287 | 8223 | 0 | 0 | 0.00% | 0.00% | 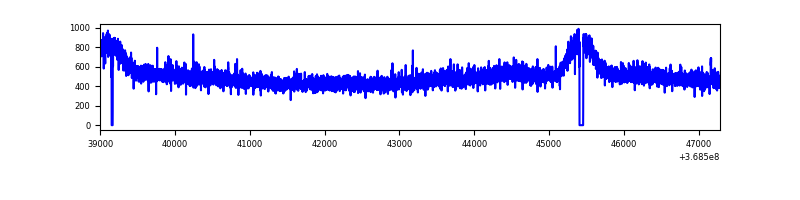 |
| B | 8289 | 8224 | 32 | 32 | 0.39% | 0.39% | 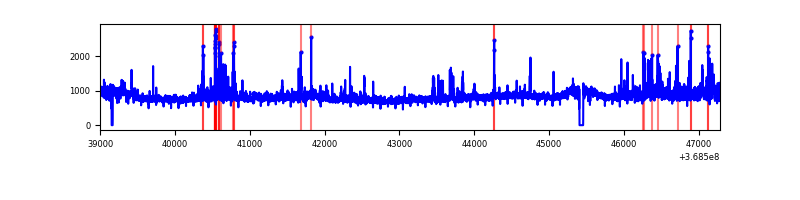 |
| C | 8289 | 8225 | 15 | 15 | 0.18% | 0.18% | 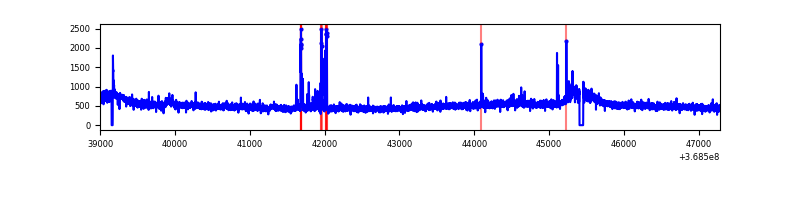 |
| D | 8289 | 8225 | 145 | 145 | 1.75% | 1.76% | 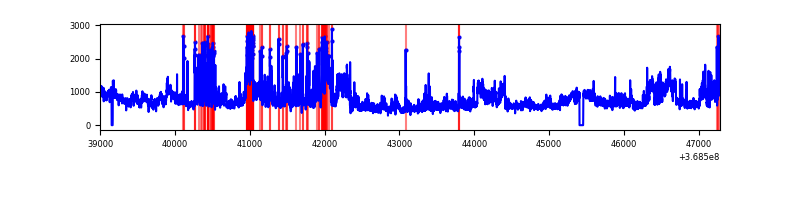 |
Top three noisy pixels from each quadrant. If the there are fewer than three noisy pixels in the level2.evt file, extra rows are filled as -1
| Pixel properties | Quadrant properties | ||||||
|---|---|---|---|---|---|---|---|
| Quadrant | DetID | PixID | Counts | Sigma | Mean | Median | Sigma |
| A | 13 | 6 | 17747 | 78.14 | 1060 | 1037 | 213.8 |
| A | 13 | 254 | 16680 | 73.15 | 1060 | 1037 | 213.8 |
| A | 3 | 137 | 10877 | 46.02 | 1060 | 1037 | 213.8 |
| B | 6 | 159 | 2255520 | 11364.23 | 1030 | 1004 | 198.4 |
| B | 10 | 245 | 282383 | 1418.33 | 1030 | 1004 | 198.4 |
| B | 0 | 190 | 173833 | 871.17 | 1030 | 1004 | 198.4 |
| C | 14 | 238 | 165274 | 691.4 | 1009 | 1014 | 237.6 |
| C | 0 | 10 | 117931 | 492.13 | 1009 | 1014 | 237.6 |
| C | 2 | 16 | 29367 | 119.34 | 1009 | 1014 | 237.6 |
| D | 8 | 195 | 1975827 | 8101.67 | 1022 | 991 | 243.8 |
| D | 12 | 233 | 415687 | 1701.27 | 1022 | 991 | 243.8 |
| D | 12 | 79 | 216212 | 882.93 | 1022 | 991 | 243.8 |
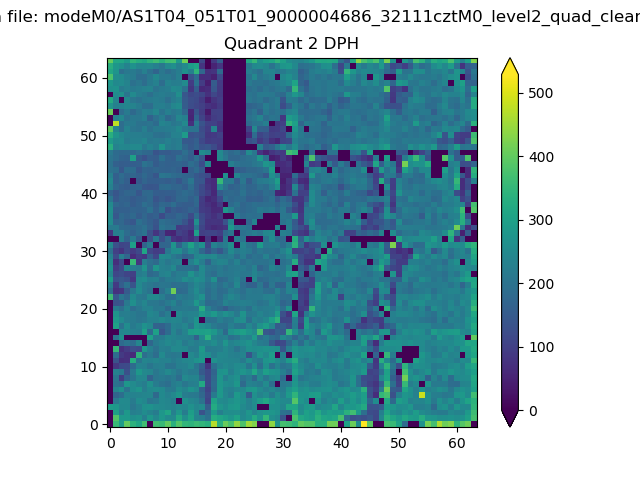
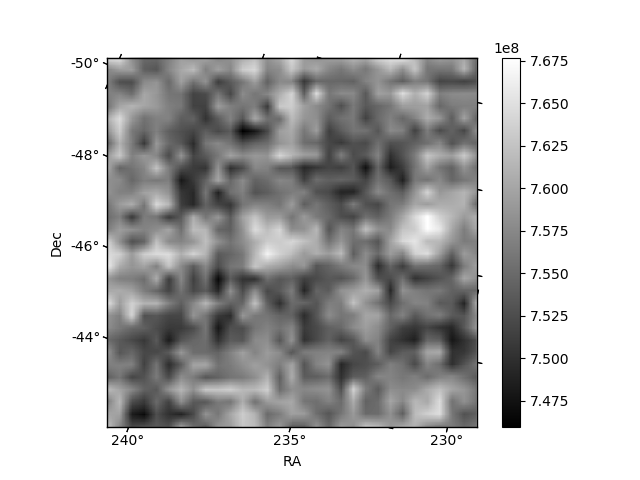
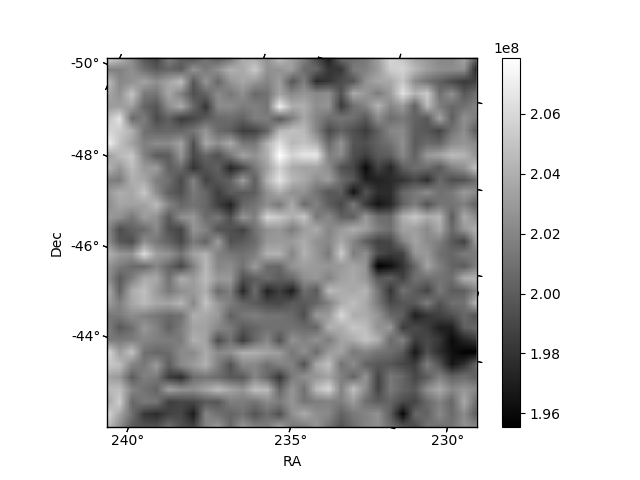
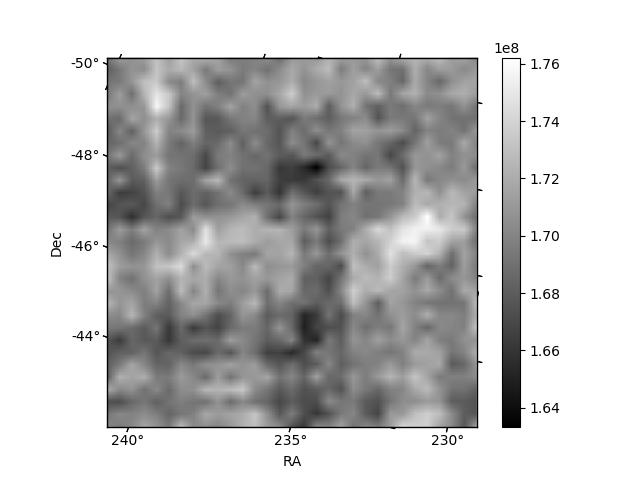
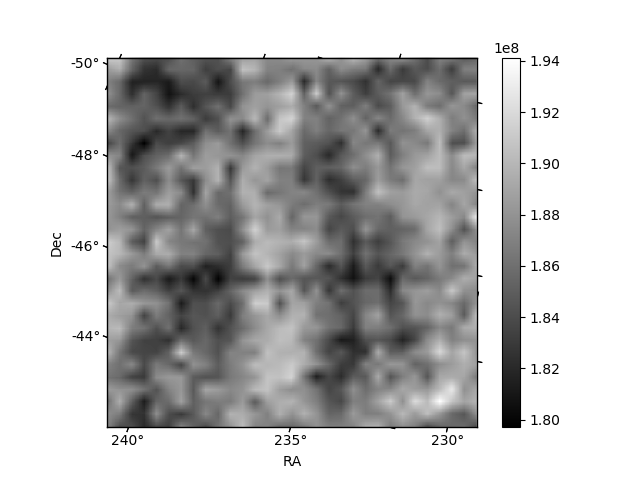
Histogram calculated using DETX and DETY for each event in the final _common_clean file
| Quadrant A | 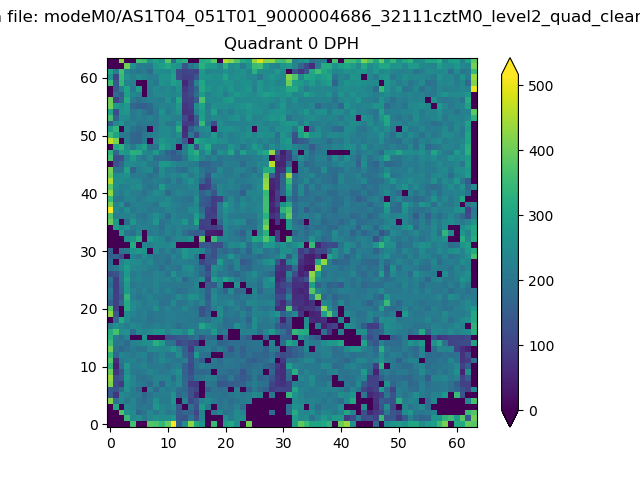 |
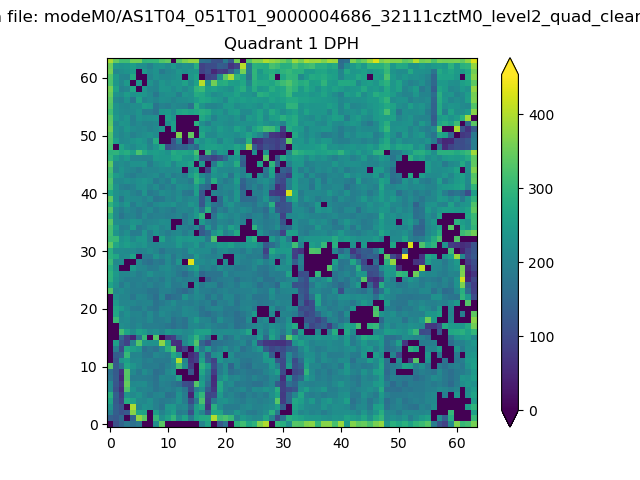 |
Quadrant B |
|---|---|---|---|
| Quadrant D | 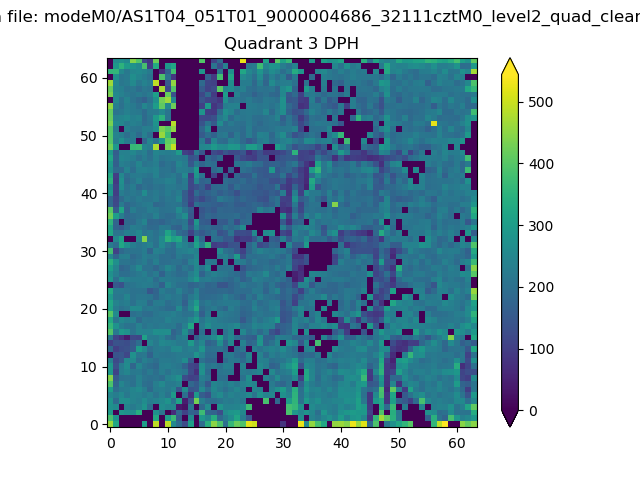 |
 |
Quadrant C |
| Plot type | Count rate plots | Images |
|---|---|---|
| Comparison with Poisson distribution Blue bars denote a histogram of data divided into 1 sec bins. Red curve is a Poisson curve with rate = median count rate of data. |
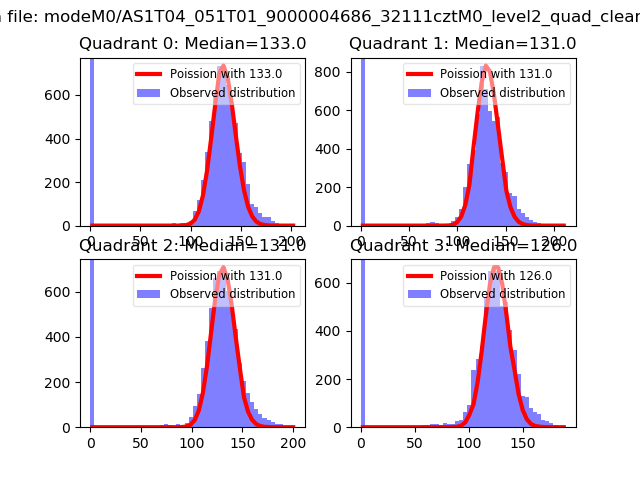 |
 |
| Quadrant-wise count rates Data is divided into 100 sec bins |
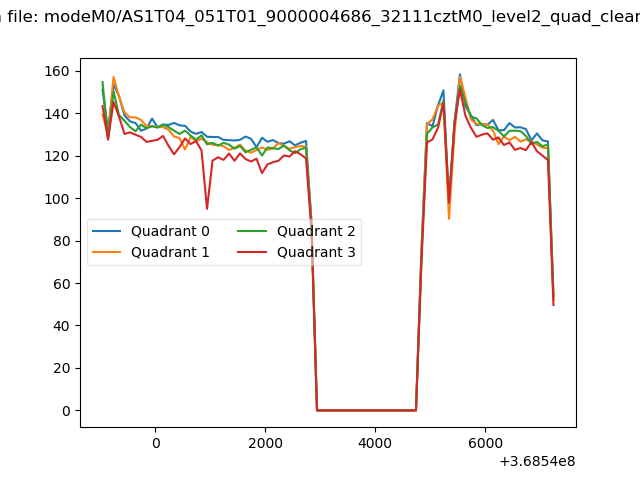 |
|
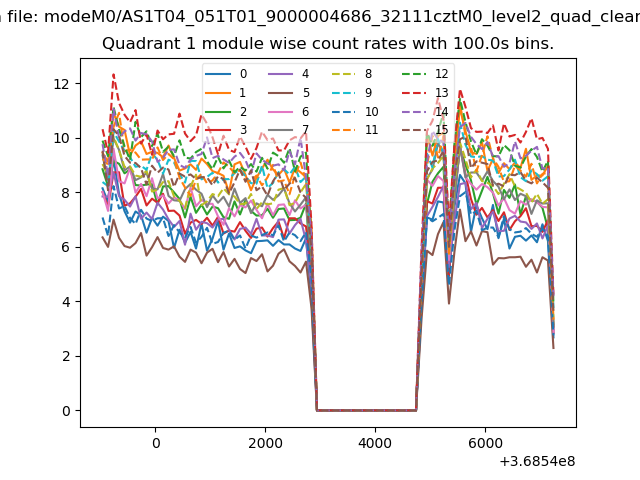
| Module-wise count rates for Quadrant A Data is divided into 100 sec bins |
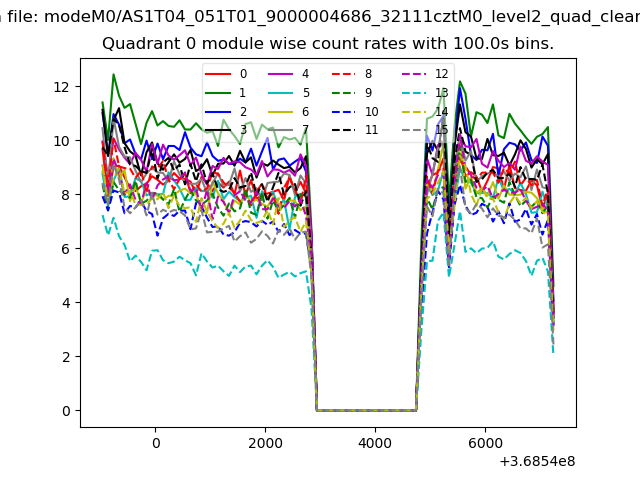 |
 |
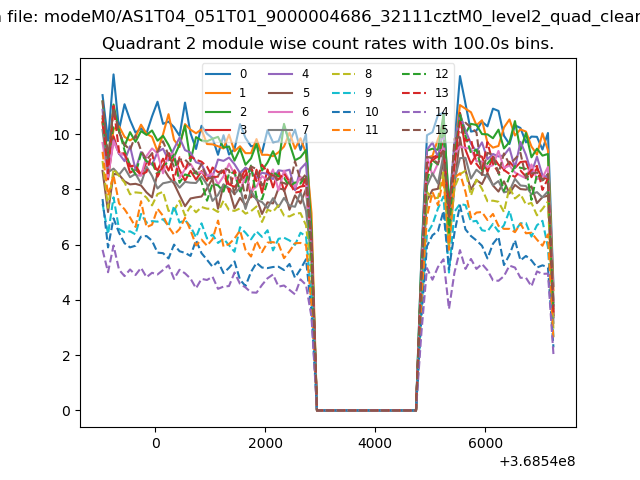
| Module-wise count rates for Quadrant B Data is divided into 100 sec bins |
 |
 |
| Module-wise count rates for Quadrant C Data is divided into 100 sec bins |
 |
 |
| Module-wise count rates for Quadrant D Data is divided into 100 sec bins |
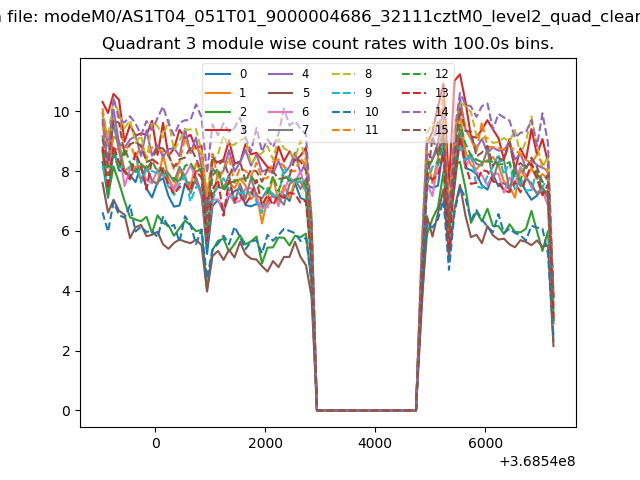 |
 |
| Parameter | Plot |
|---|---|
| CZT HV Monitor | 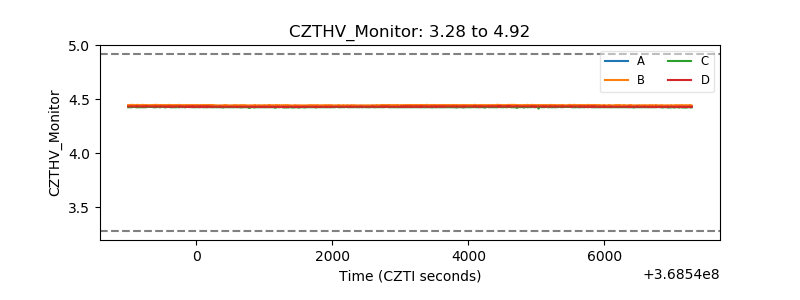 |
| D_VDD | 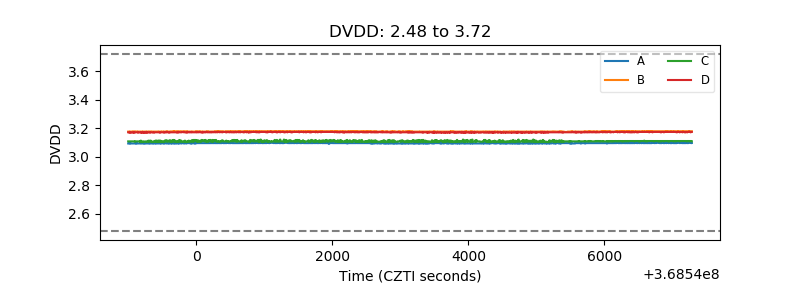 |
| Temperature 1 |  |
| Veto HV Monitor | 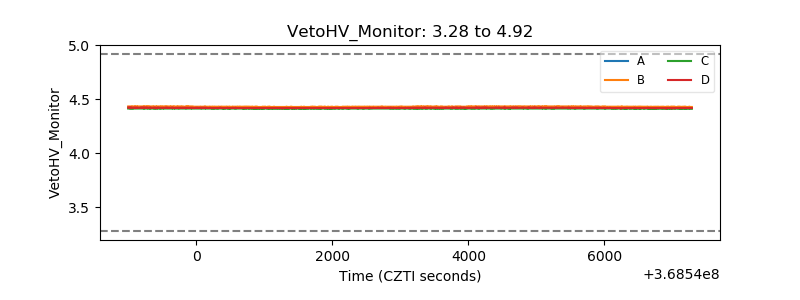 |
| Veto LLD | 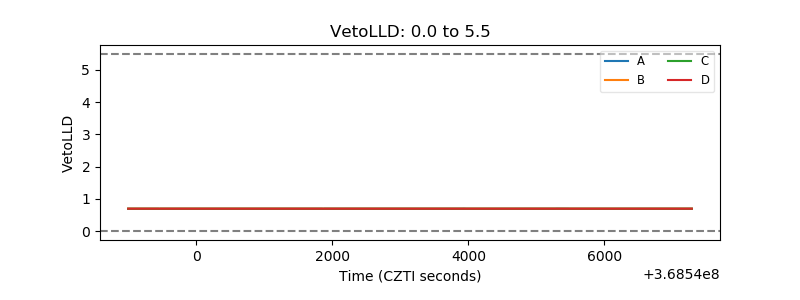 |
| Alpha Counter | 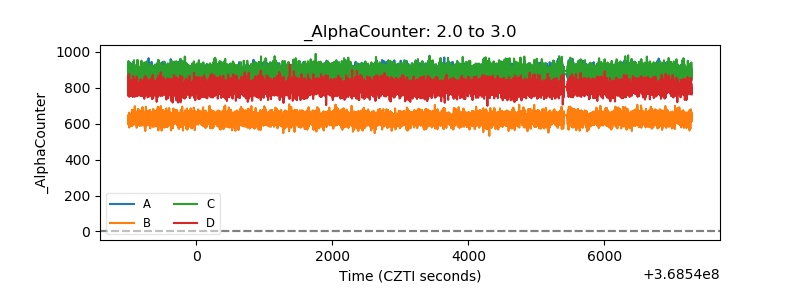 |
| _CPM_Rate | 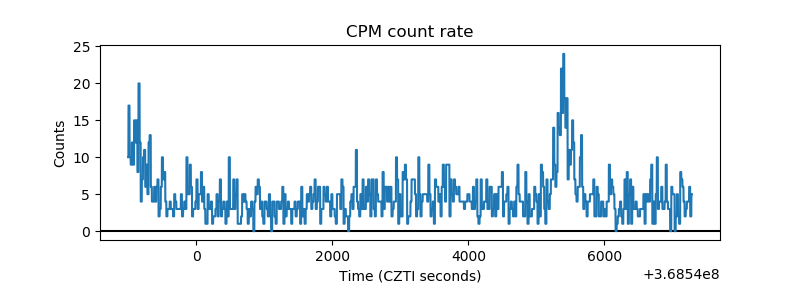 |
| CZT Counter | 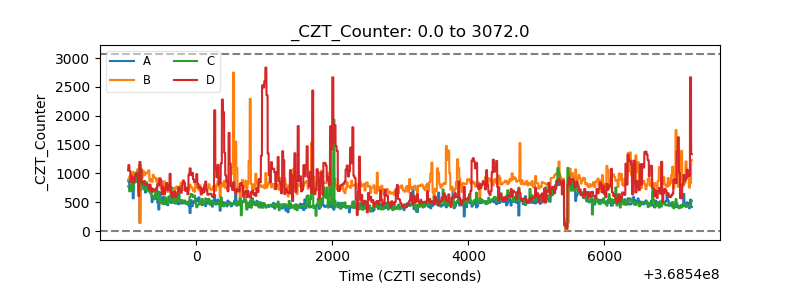 |
| +2.5 Volts monitor |  |
| +5 Volts monitor | 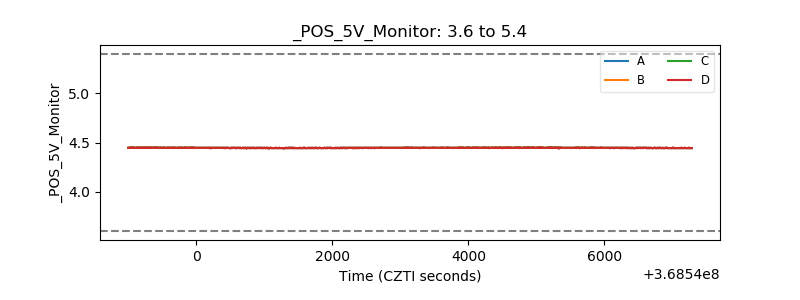 |
| _ROLL_ROT | 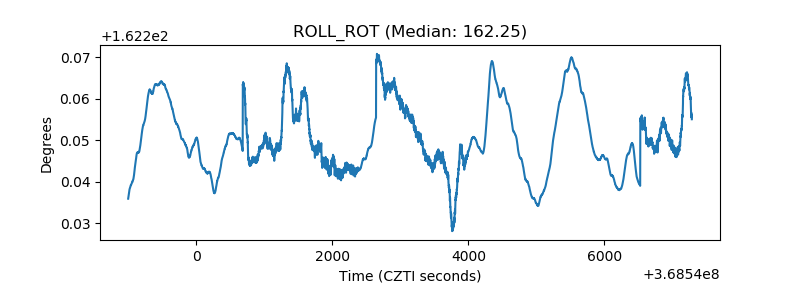 |
| _Roll_DEC | 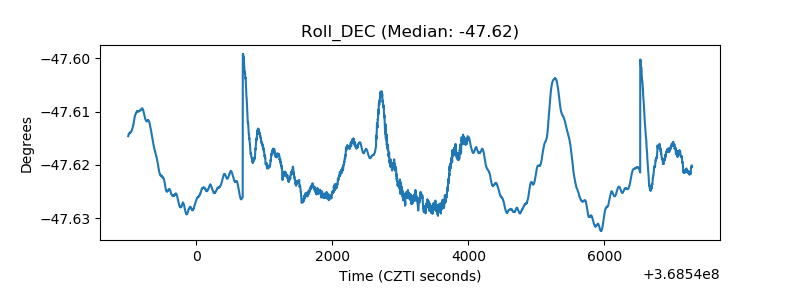 |
| _Roll_RA | 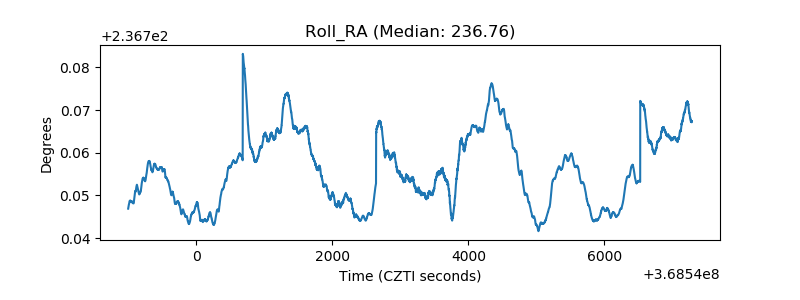 |
| Veto Counter | 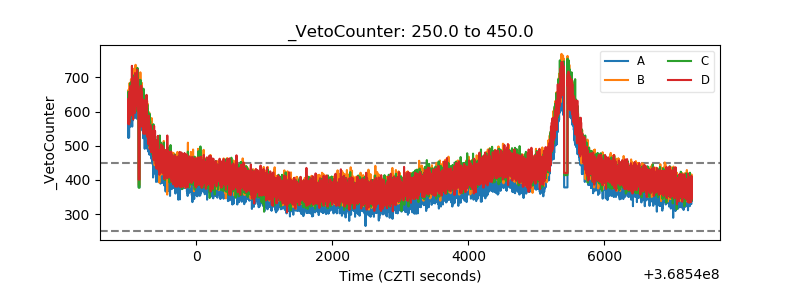 |