| Param | Original file | Final file |
|---|---|---|
| Filename | modeM0/AS1T04_051T01_9000004686_32114cztM0_level2.evt | modeM0/AS1T04_051T01_9000004686_32114cztM0_level2_quad_clean.evt |
| Size (bytes) | 1,289,370,240 | 206,645,760 |
| Size | 1.2 GB | 197.1 MB |
| Events in quadrant A | 6,962,735 | 1,366,852 |
| Events in quadrant B | 13,268,702 | 1,330,061 |
| Events in quadrant C | 7,284,278 | 1,328,839 |
| Events in quadrant D | 10,602,981 | 1,278,399 |
| Mode M9 | |||
|---|---|---|---|
| Quadrant | BADHDUFLAG | Total packets | Discarded packets |
| A | 0 | 18 | 0 |
| B | 0 | 19 | 1 |
| C | 0 | 18 | 0 |
| D | 0 | 18 | 0 |
| Mode M0 | |||
|---|---|---|---|
| Quadrant | BADHDUFLAG | Total packets | Discarded packets |
| A | 0 | 31306 | 940 |
| B | 0 | 51237 | 1624 |
| C | 0 | 31984 | 885 |
| D | 0 | 42594 | 1046 |
| Mode SS | |||
|---|---|---|---|
| Quadrant | BADHDUFLAG | Total packets | Discarded packets |
| A | 0 | 311 | 9 |
| B | 0 | 310 | 8 |
| C | 0 | 310 | 8 |
| D | 0 | -1 | -1 |
| Quadrant | Total seconds | Saturated seconds | Saturation percentage |
|---|---|---|---|
| A | 14789 | 85 | 0.574752% |
| B | 14768 | 547 | 3.703954% |
| C | 14802 | 253 | 1.709228% |
| D | 14790 | 346 | 2.339419% |
Noise dominated data is calculated using 1-second bins in cleaned event files. If a bin has >2000 counts, and if more than 50% of those come from <1% of pixels, then it is considered to be noise-dominated and hence unusable.
| Quadrant | # 1 sec bins | Bins with >0 counts | Bins with >2000 counts | High rate bins dominated by noise | Noise dominated (total time) | Noise dominated (detector-on time) | Marked lightcurve |
|---|---|---|---|---|---|---|---|
| A | 19379 | 14804 | 1 | 1 | 0.01% | 0.01% | 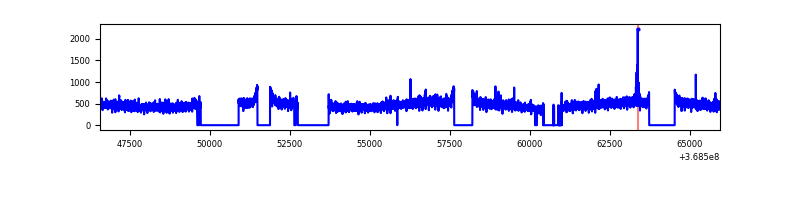 |
| B | 19379 | 14783 | 139 | 139 | 0.72% | 0.94% | 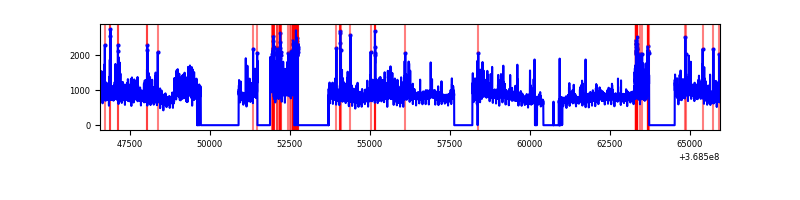 |
| C | 19379 | 14820 | 24 | 24 | 0.12% | 0.16% | 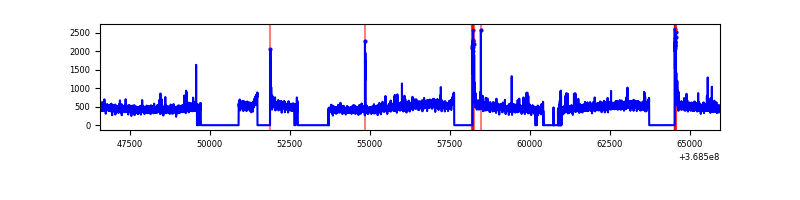 |
| D | 19379 | 14805 | 320 | 320 | 1.65% | 2.16% | 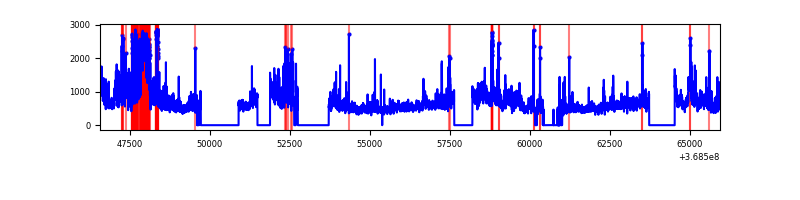 |
Top three noisy pixels from each quadrant. If the there are fewer than three noisy pixels in the level2.evt file, extra rows are filled as -1
| Pixel properties | Quadrant properties | ||||||
|---|---|---|---|---|---|---|---|
| Quadrant | DetID | PixID | Counts | Sigma | Mean | Median | Sigma |
| A | 13 | 254 | 29675 | 77.74 | 1792 | 1754 | 359.1 |
| A | 13 | 6 | 27320 | 71.19 | 1792 | 1754 | 359.1 |
| A | 3 | 137 | 18092 | 45.49 | 1792 | 1754 | 359.1 |
| B | 6 | 159 | 4266262 | 12909.95 | 1750 | 1706 | 330.3 |
| B | 10 | 245 | 1579757 | 4777.18 | 1750 | 1706 | 330.3 |
| B | 0 | 190 | 152449 | 456.34 | 1750 | 1706 | 330.3 |
| C | 14 | 238 | 301036 | 748.4 | 1702 | 1712 | 400.0 |
| C | 0 | 10 | 215483 | 534.49 | 1702 | 1712 | 400.0 |
| C | 14 | 254 | 43843 | 105.34 | 1702 | 1712 | 400.0 |
| D | 8 | 195 | 3065457 | 7583.0 | 1707 | 1664 | 404.0 |
| D | 7 | 38 | 530266 | 1308.31 | 1707 | 1664 | 404.0 |
| D | 12 | 233 | 246168 | 605.16 | 1707 | 1664 | 404.0 |
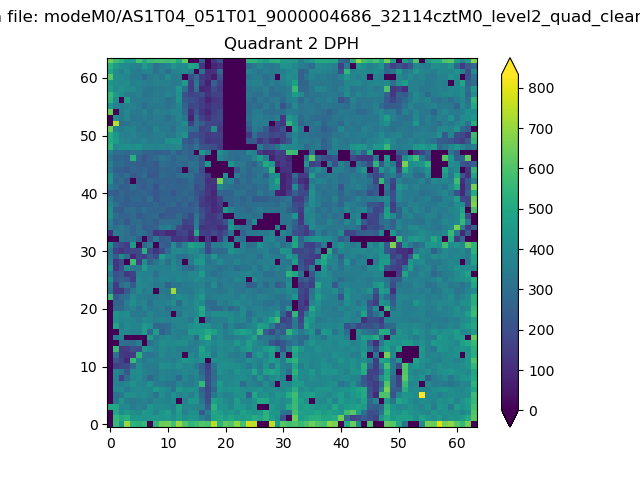
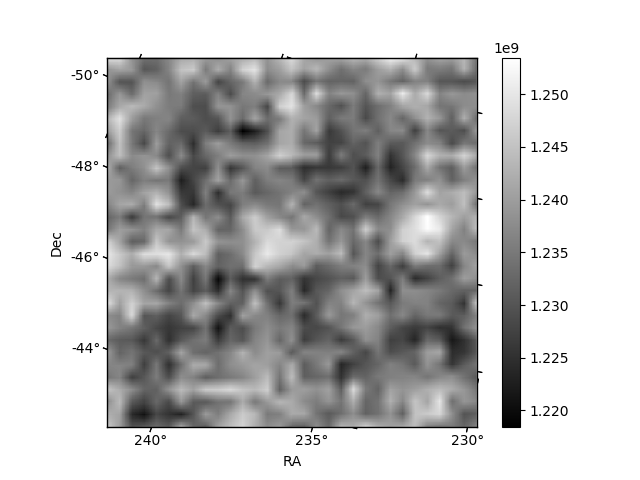
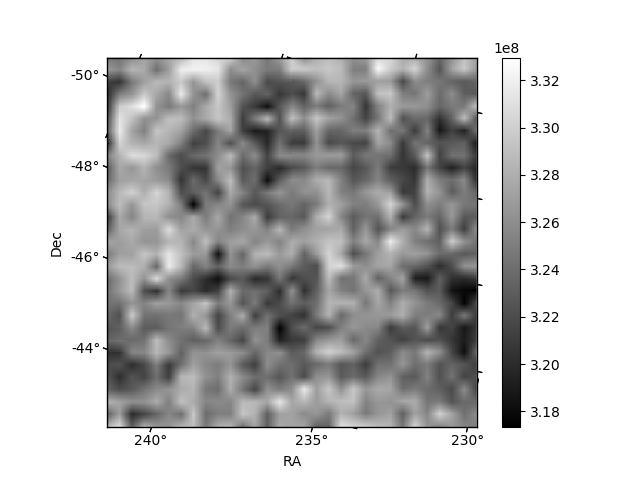
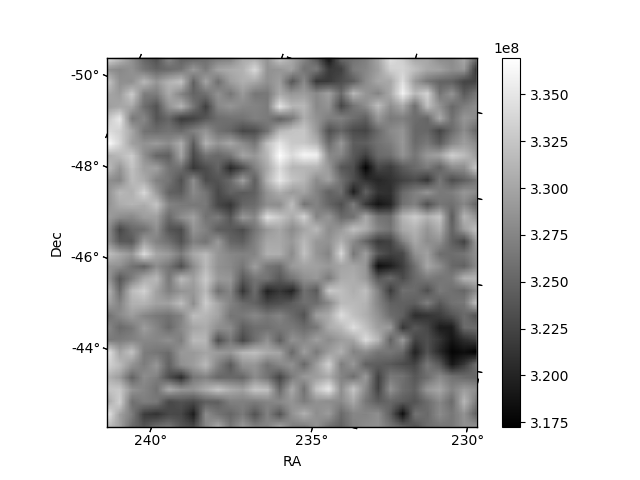
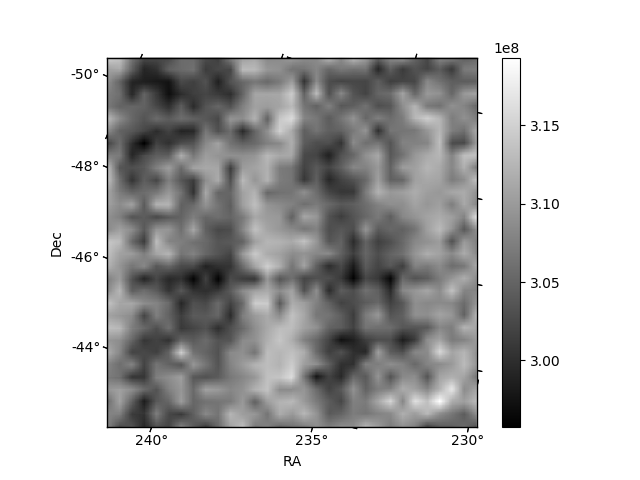
Histogram calculated using DETX and DETY for each event in the final _common_clean file
| Quadrant A | 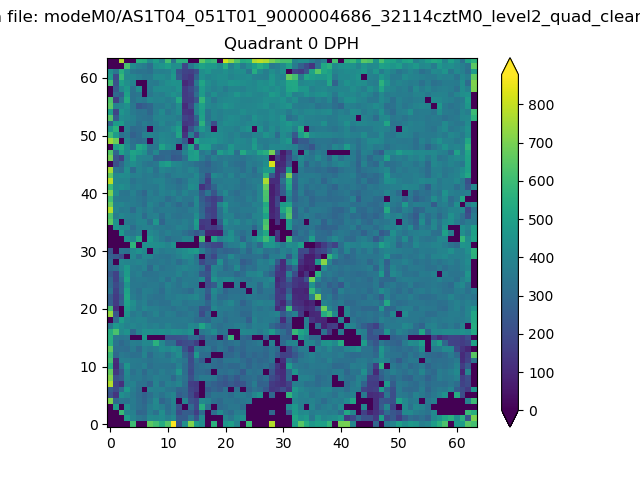 |
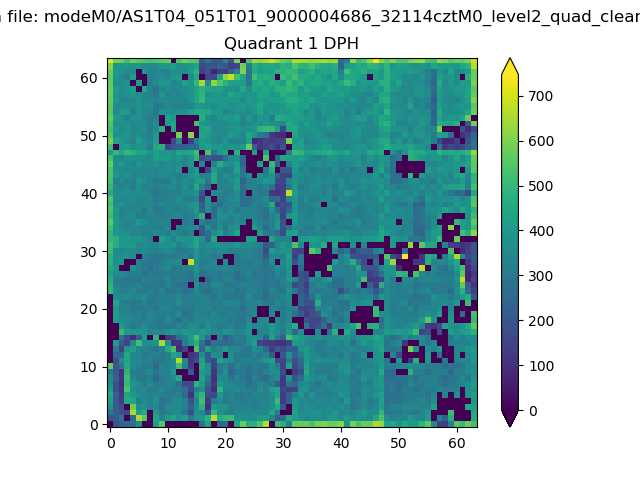 |
Quadrant B |
|---|---|---|---|
| Quadrant D | 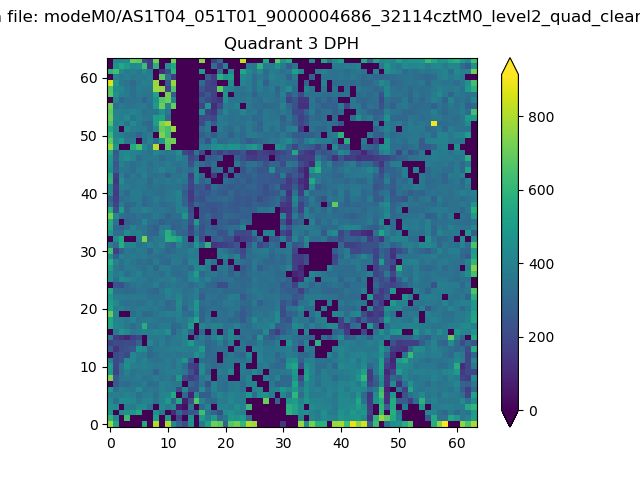 |
 |
Quadrant C |
| Plot type | Count rate plots | Images |
|---|---|---|
| Comparison with Poisson distribution Blue bars denote a histogram of data divided into 1 sec bins. Red curve is a Poisson curve with rate = median count rate of data. |
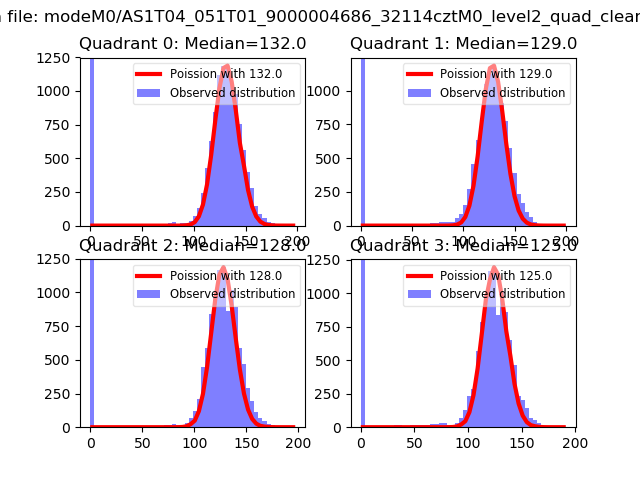 |
 |
| Quadrant-wise count rates Data is divided into 100 sec bins |
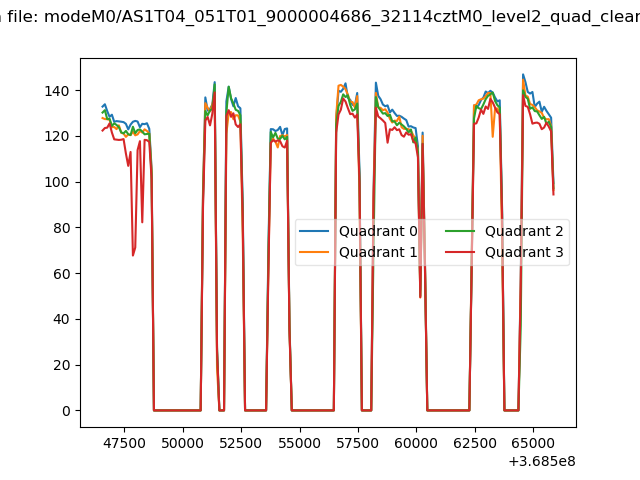 |
|
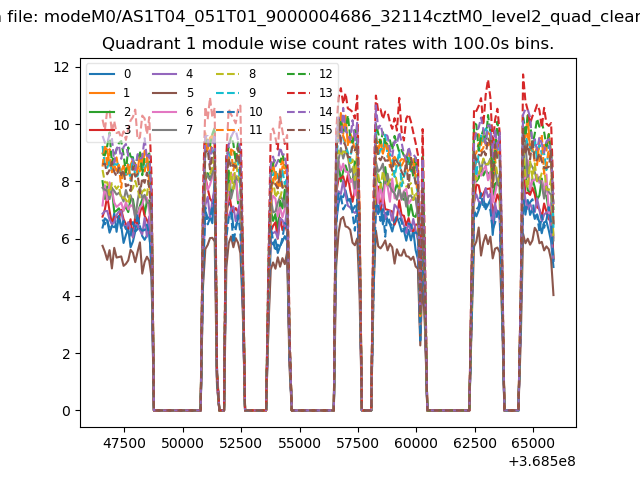
| Module-wise count rates for Quadrant A Data is divided into 100 sec bins |
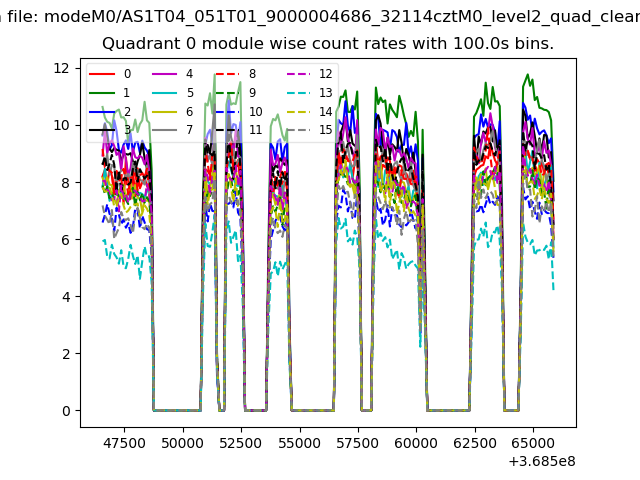 |
 |
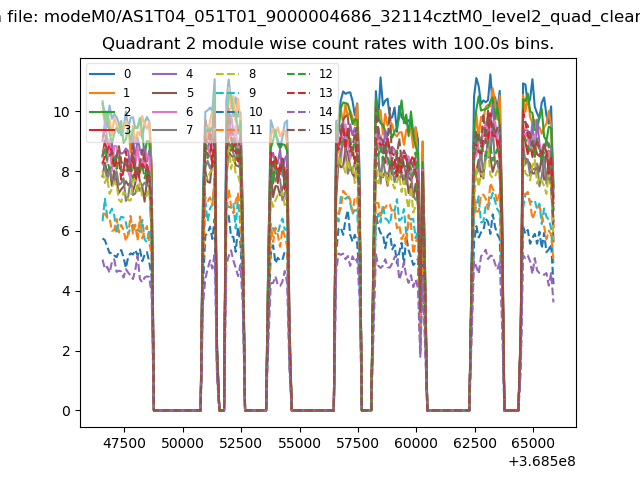
| Module-wise count rates for Quadrant B Data is divided into 100 sec bins |
 |
 |
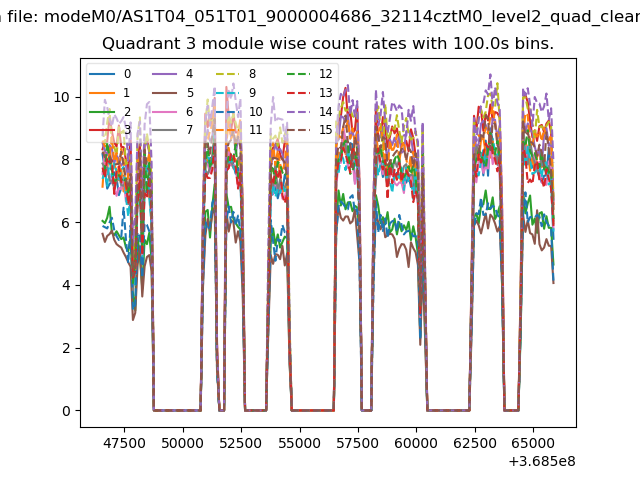
| Module-wise count rates for Quadrant C Data is divided into 100 sec bins |
 |
 |
| Module-wise count rates for Quadrant D Data is divided into 100 sec bins |
 |
 |
| Parameter | Plot |
|---|---|
| CZT HV Monitor | 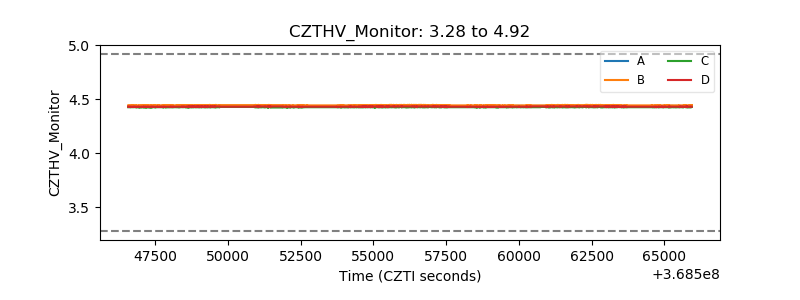 |
| D_VDD | 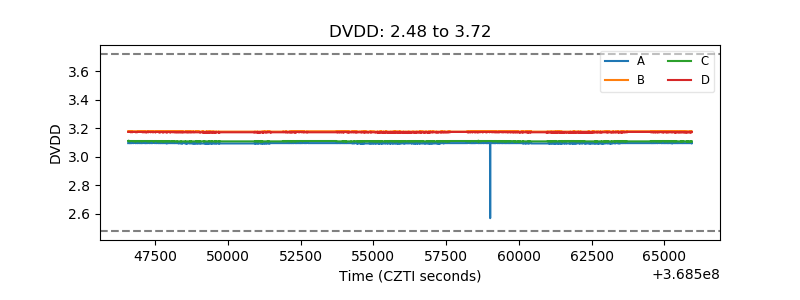 |
| Temperature 1 | 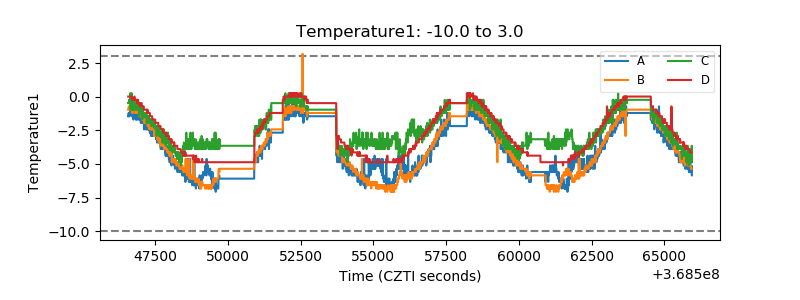 |
| Veto HV Monitor | 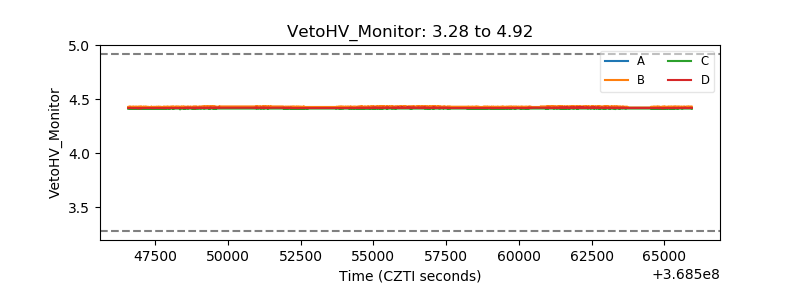 |
| Veto LLD | 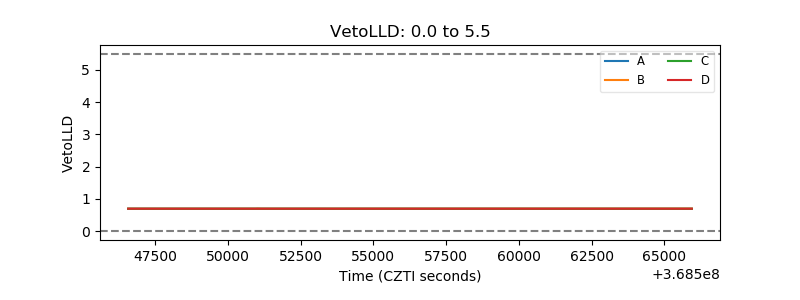 |
| Alpha Counter | 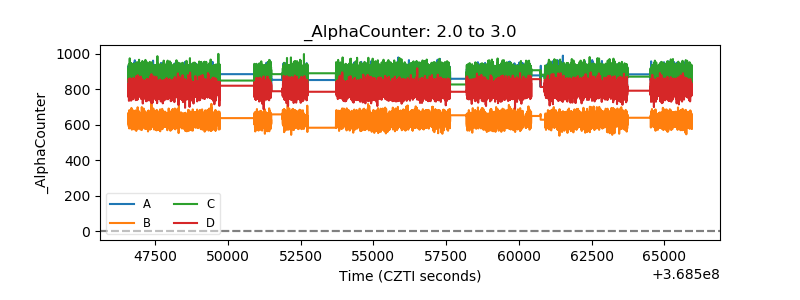 |
| _CPM_Rate | 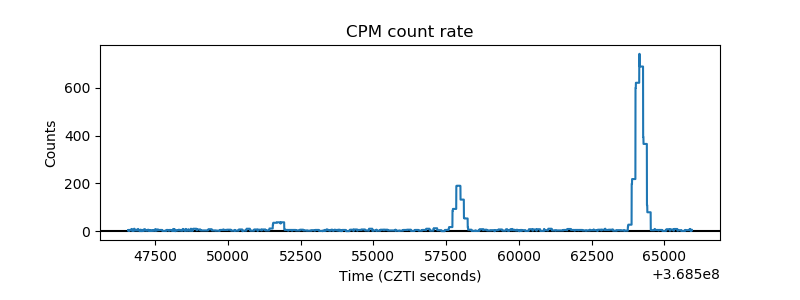 |
| CZT Counter | 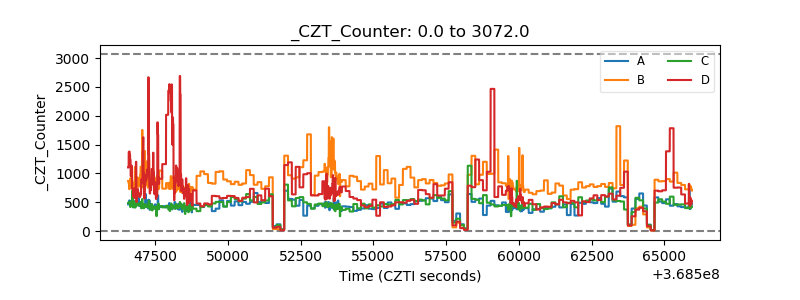 |
| +2.5 Volts monitor |  |
| +5 Volts monitor |  |
| _ROLL_ROT | 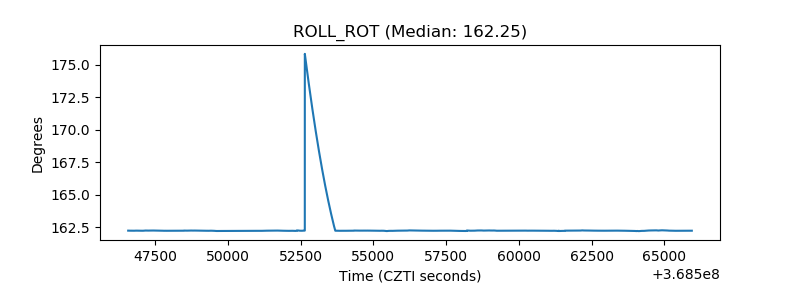 |
| _Roll_DEC | 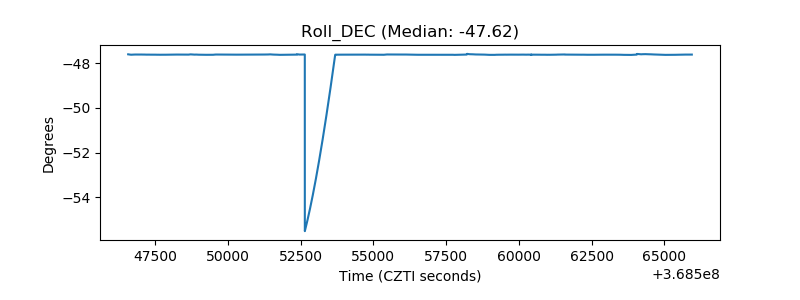 |
| _Roll_RA | 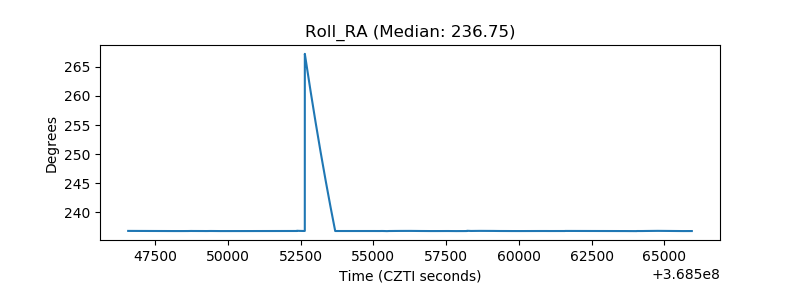 |
| Veto Counter | 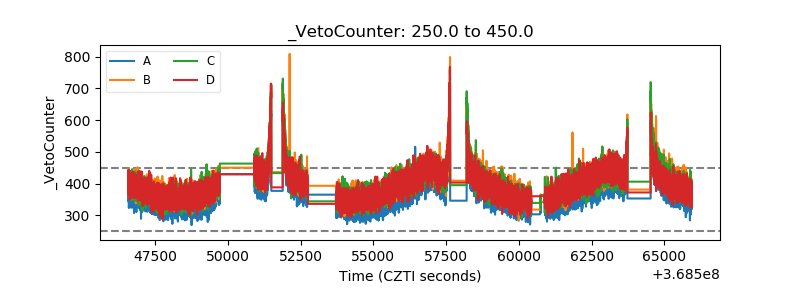 |