| Param | Original file | Final file |
|---|---|---|
| Filename | modeM0/AS1T04_051T01_9000004686_32115cztM0_level2.evt | modeM0/AS1T04_051T01_9000004686_32115cztM0_level2_quad_clean.evt |
| Size (bytes) | 1,965,136,320 | 305,542,080 |
| Size | 1.8 GB | 291.4 MB |
| Events in quadrant A | 10,730,515 | 1,978,033 |
| Events in quadrant B | 20,561,786 | 1,923,031 |
| Events in quadrant C | 11,305,888 | 1,922,065 |
| Events in quadrant D | 15,378,988 | 1,858,947 |
| Mode M9 | |||
|---|---|---|---|
| Quadrant | BADHDUFLAG | Total packets | Discarded packets |
| A | 0 | 27 | 0 |
| B | 0 | 27 | 0 |
| C | 0 | 27 | 0 |
| D | 0 | 27 | 0 |
| Mode M0 | |||
|---|---|---|---|
| Quadrant | BADHDUFLAG | Total packets | Discarded packets |
| A | 0 | 46852 | 96 |
| B | 0 | 77253 | 159 |
| C | 0 | 48178 | 104 |
| D | 0 | 61309 | 158 |
| Mode SS | |||
|---|---|---|---|
| Quadrant | BADHDUFLAG | Total packets | Discarded packets |
| A | 0 | 464 | 0 |
| B | 0 | 465 | 1 |
| C | 0 | 465 | 1 |
| D | 0 | 465 | 1 |
| Quadrant | Total seconds | Saturated seconds | Saturation percentage |
|---|---|---|---|
| A | 22850 | 112 | 0.490153% |
| B | 22848 | 855 | 3.742122% |
| C | 22844 | 392 | 1.715987% |
| D | 22841 | 377 | 1.650541% |
Noise dominated data is calculated using 1-second bins in cleaned event files. If a bin has >2000 counts, and if more than 50% of those come from <1% of pixels, then it is considered to be noise-dominated and hence unusable.
| Quadrant | # 1 sec bins | Bins with >0 counts | Bins with >2000 counts | High rate bins dominated by noise | Noise dominated (total time) | Noise dominated (detector-on time) | Marked lightcurve |
|---|---|---|---|---|---|---|---|
| A | 25673 | 22857 | 1 | 1 | 0.00% | 0.00% | 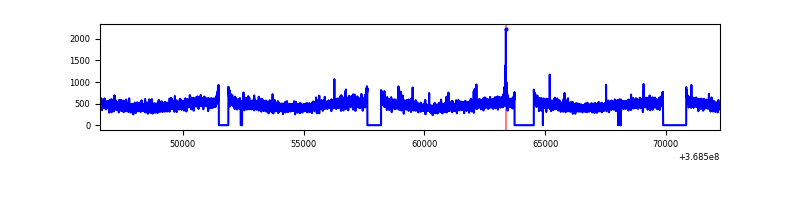 |
| B | 25673 | 22859 | 257 | 257 | 1.00% | 1.12% | 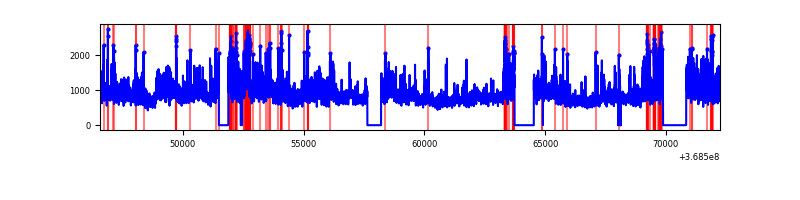 |
| C | 25673 | 22857 | 52 | 52 | 0.20% | 0.23% | 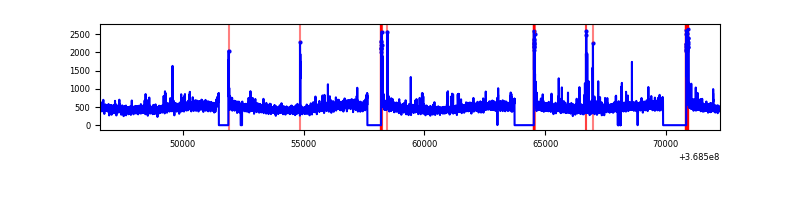 |
| D | 25672 | 22852 | 347 | 347 | 1.35% | 1.52% | 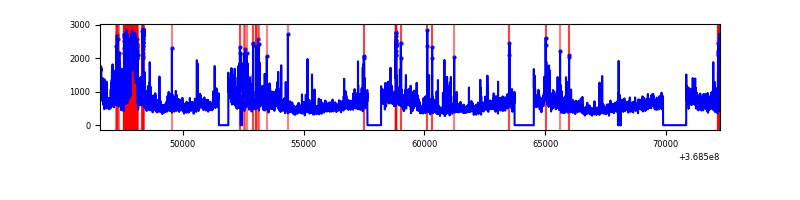 |
Top three noisy pixels from each quadrant. If the there are fewer than three noisy pixels in the level2.evt file, extra rows are filled as -1
| Pixel properties | Quadrant properties | ||||||
|---|---|---|---|---|---|---|---|
| Quadrant | DetID | PixID | Counts | Sigma | Mean | Median | Sigma |
| A | 13 | 254 | 45727 | 77.82 | 2764 | 2703 | 552.8 |
| A | 13 | 6 | 41665 | 70.48 | 2764 | 2703 | 552.8 |
| A | 3 | 137 | 27807 | 45.41 | 2764 | 2703 | 552.8 |
| B | 6 | 159 | 6558589 | 12847.8 | 2708 | 2638 | 510.3 |
| B | 10 | 245 | 2556757 | 5005.35 | 2708 | 2638 | 510.3 |
| B | 0 | 190 | 261437 | 507.17 | 2708 | 2638 | 510.3 |
| C | 14 | 238 | 457121 | 738.86 | 2630 | 2647 | 615.1 |
| C | 0 | 10 | 407777 | 658.64 | 2630 | 2647 | 615.1 |
| C | 14 | 254 | 56927 | 88.25 | 2630 | 2647 | 615.1 |
| D | 8 | 195 | 4075444 | 6483.56 | 2641 | 2573 | 628.2 |
| D | 7 | 38 | 546034 | 865.13 | 2641 | 2573 | 628.2 |
| D | 12 | 233 | 311035 | 491.04 | 2641 | 2573 | 628.2 |
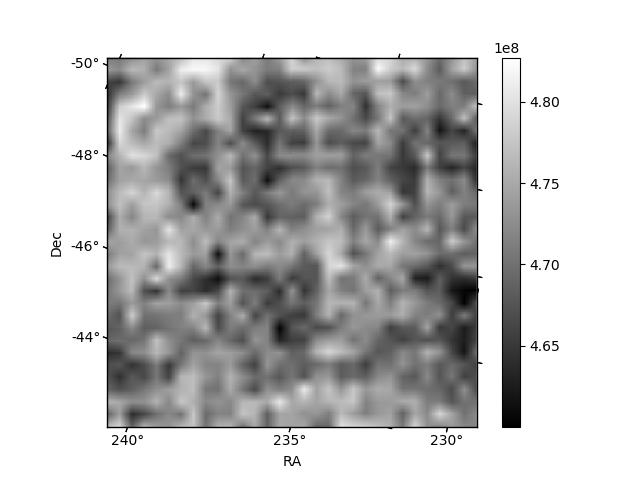
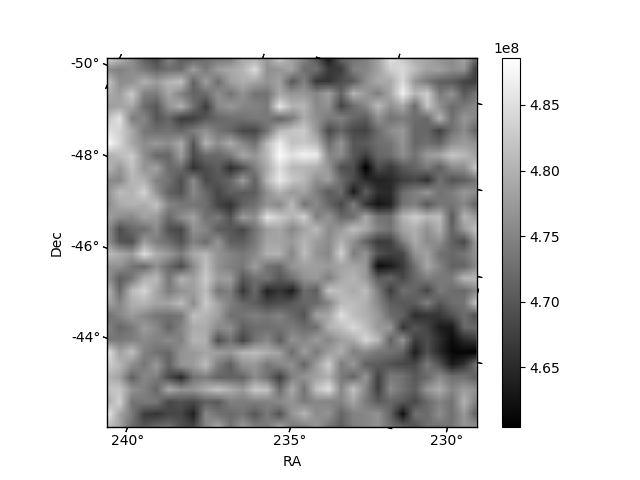
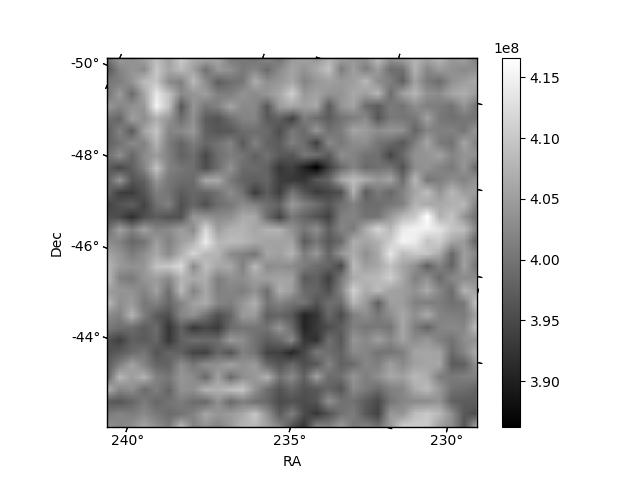
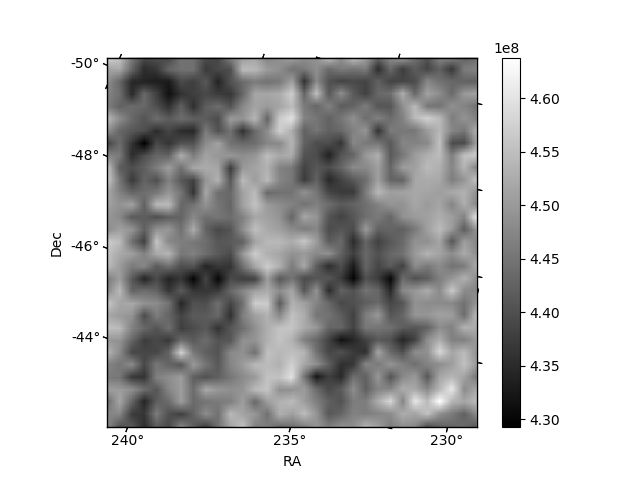
Histogram calculated using DETX and DETY for each event in the final _common_clean file
| Quadrant A | 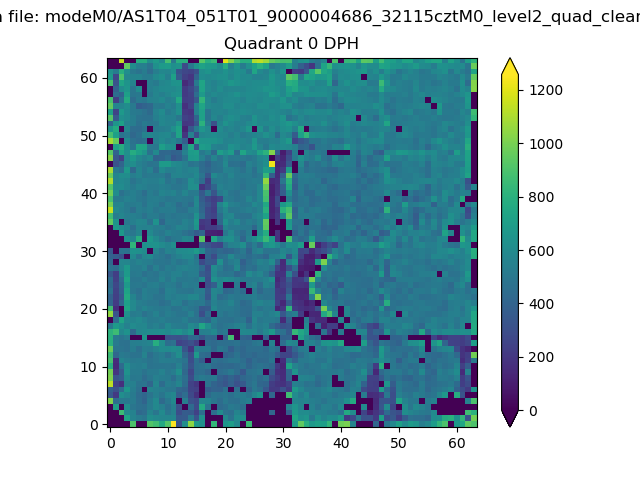 |
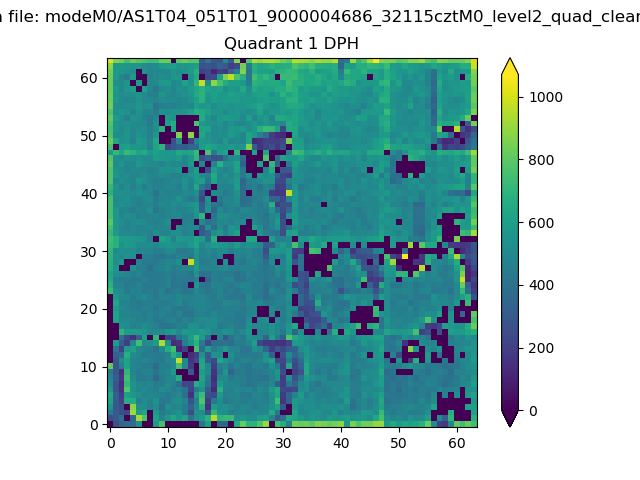 |
Quadrant B |
|---|---|---|---|
| Quadrant D | 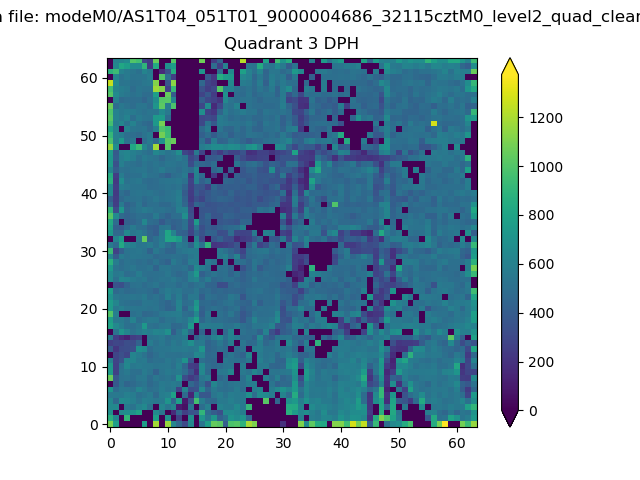 |
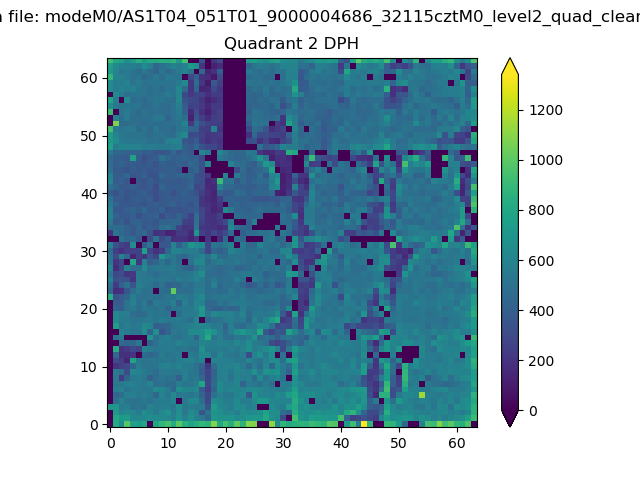 |
Quadrant C |
| Plot type | Count rate plots | Images |
|---|---|---|
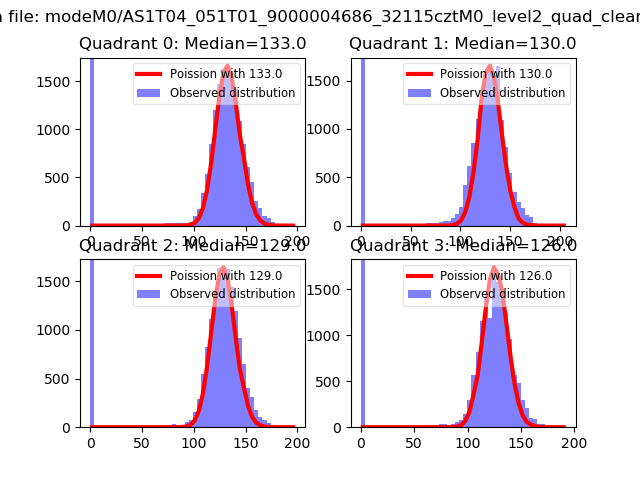
| Comparison with Poisson distribution Blue bars denote a histogram of data divided into 1 sec bins. Red curve is a Poisson curve with rate = median count rate of data. |
 |
 |
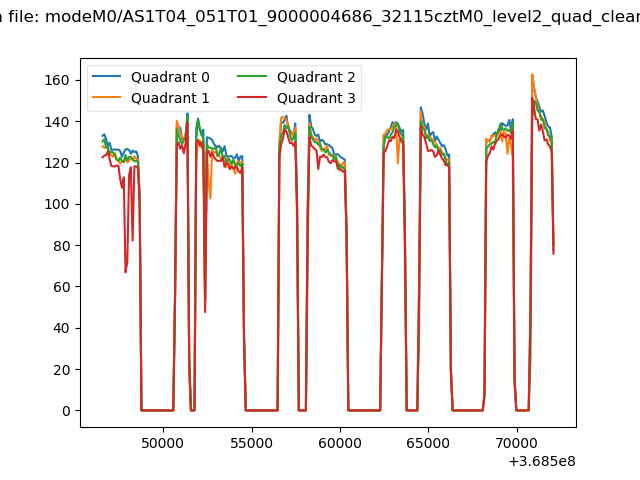
| Quadrant-wise count rates Data is divided into 100 sec bins |
 |
|
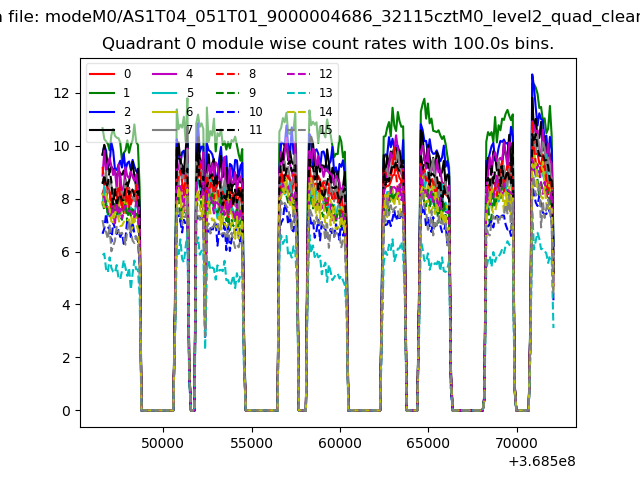
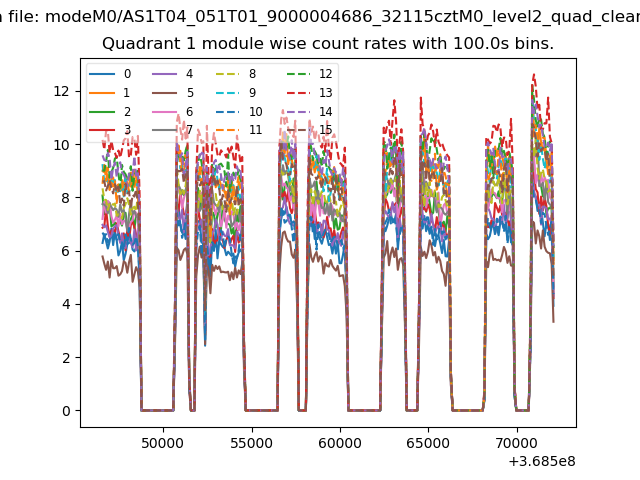
| Module-wise count rates for Quadrant A Data is divided into 100 sec bins |
 |
 |
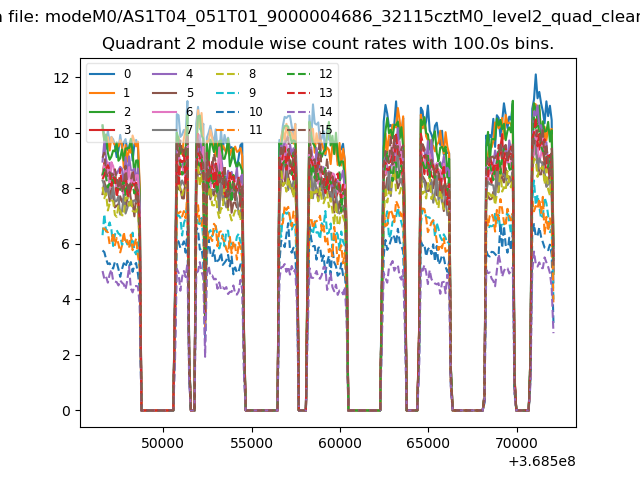
| Module-wise count rates for Quadrant B Data is divided into 100 sec bins |
 |
 |
| Module-wise count rates for Quadrant C Data is divided into 100 sec bins |
 |
 |
| Module-wise count rates for Quadrant D Data is divided into 100 sec bins |
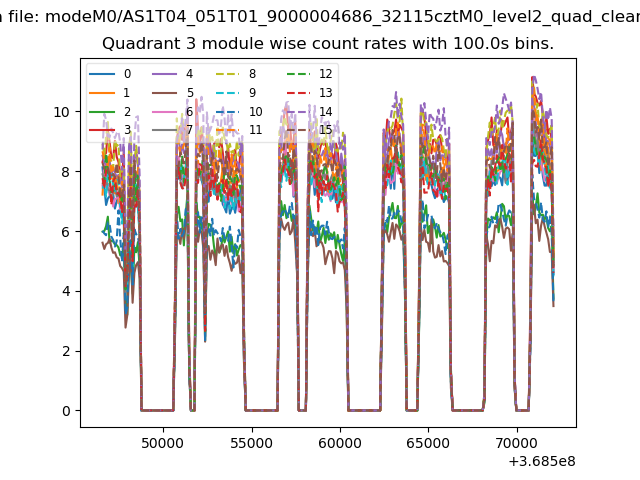 |
 |
| Parameter | Plot |
|---|---|
| CZT HV Monitor | 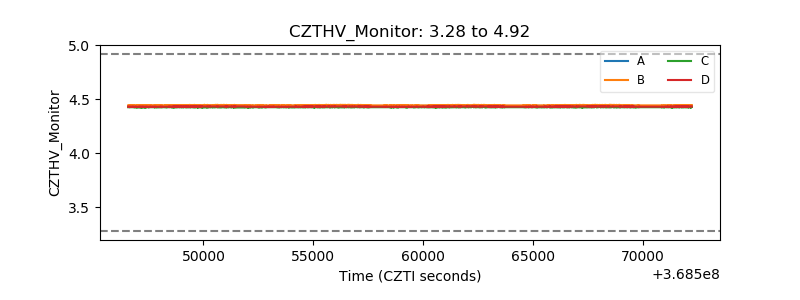 |
| D_VDD | 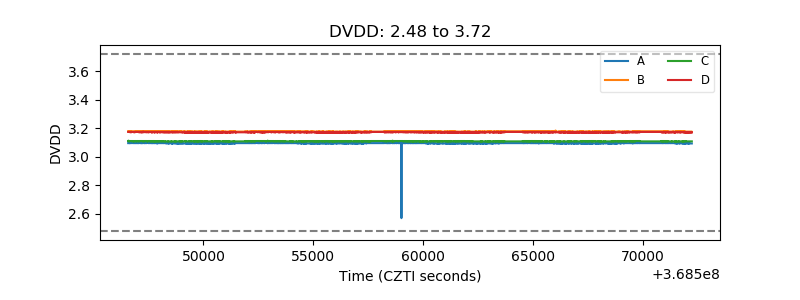 |
| Temperature 1 | 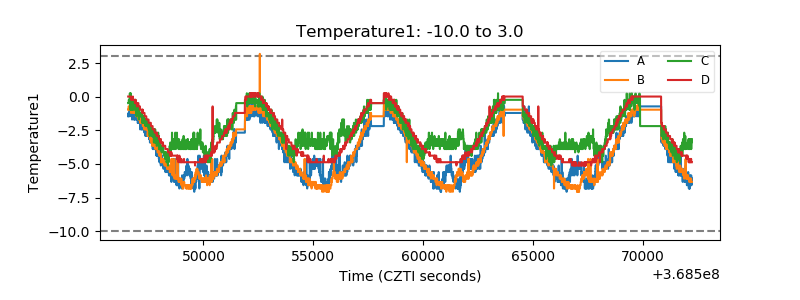 |
| Veto HV Monitor | 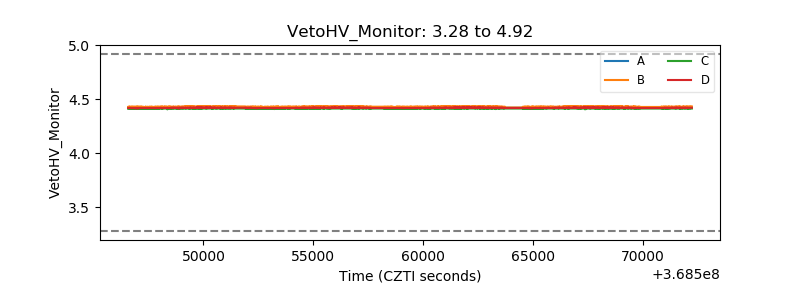 |
| Veto LLD | 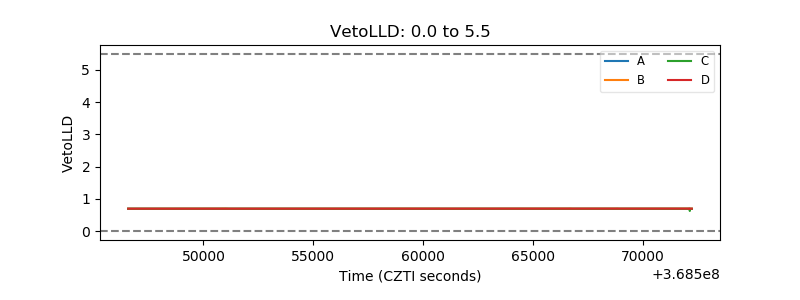 |
| Alpha Counter | 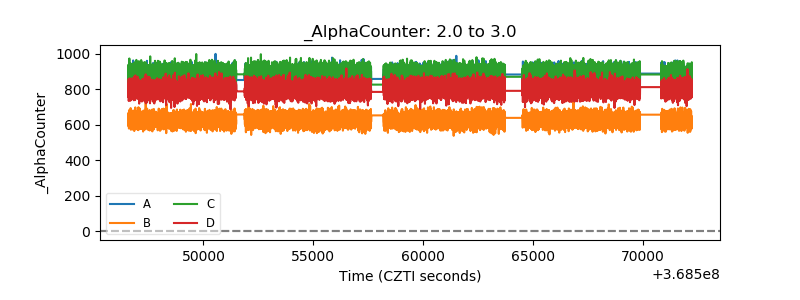 |
| _CPM_Rate | 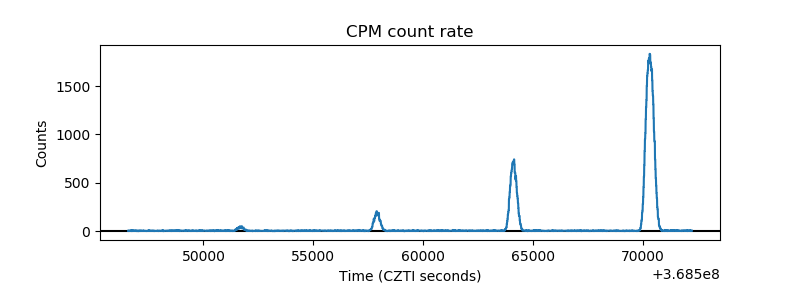 |
| CZT Counter | 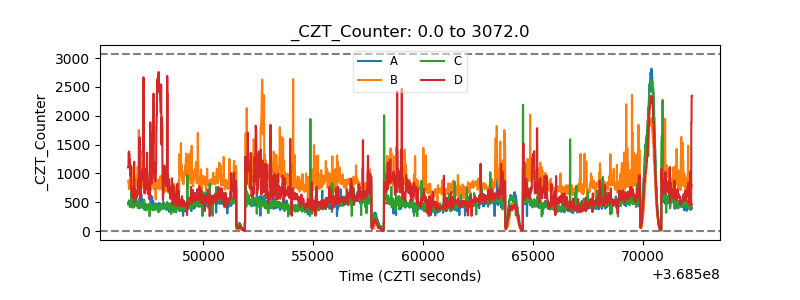 |
| +2.5 Volts monitor |  |
| +5 Volts monitor |  |
| _ROLL_ROT | 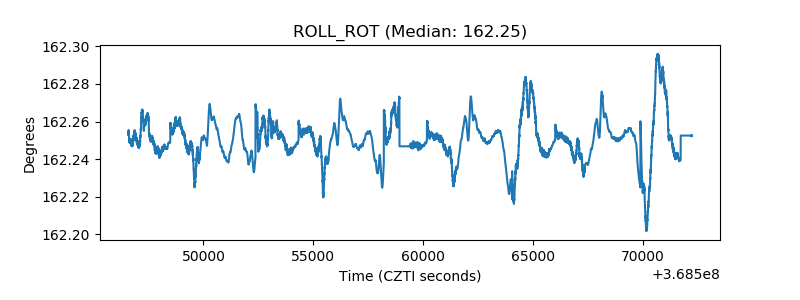 |
| _Roll_DEC | 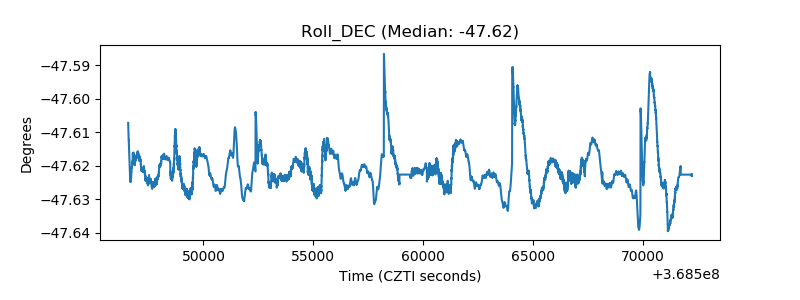 |
| _Roll_RA | 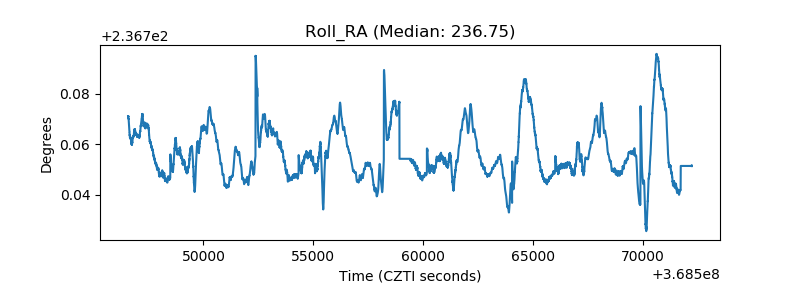 |
| Veto Counter | 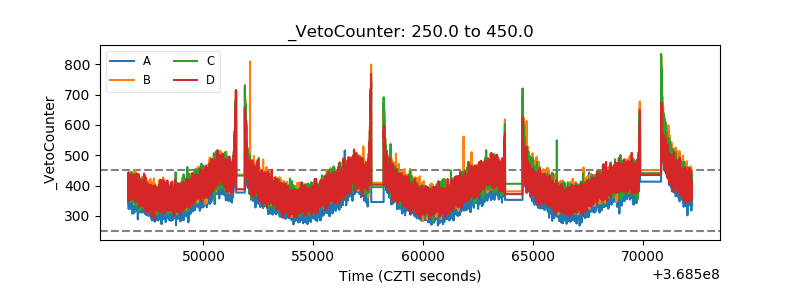 |