| Param | Original file | Final file |
|---|---|---|
| Filename | modeM0/AS1T04_051T01_9000004686_32117cztM0_level2.evt | modeM0/AS1T04_051T01_9000004686_32117cztM0_level2_quad_clean.evt |
| Size (bytes) | 645,687,360 | 88,007,040 |
| Size | 615.8 MB | 83.9 MB |
| Events in quadrant A | 3,099,739 | 588,312 |
| Events in quadrant B | 6,279,465 | 555,692 |
| Events in quadrant C | 3,403,595 | 565,382 |
| Events in quadrant D | 6,341,694 | 511,150 |
| Mode M9 | |||
|---|---|---|---|
| Quadrant | BADHDUFLAG | Total packets | Discarded packets |
| A | 0 | 13 | 0 |
| B | 0 | 14 | 0 |
| C | 0 | 14 | 0 |
| D | 0 | 14 | 0 |
| Mode M0 | |||
|---|---|---|---|
| Quadrant | BADHDUFLAG | Total packets | Discarded packets |
| A | 0 | 13130 | 2 |
| B | 0 | 22976 | 3 |
| C | 0 | 13943 | 2 |
| D | 0 | 23117 | 2 |
| Mode SS | |||
|---|---|---|---|
| Quadrant | BADHDUFLAG | Total packets | Discarded packets |
| A | 0 | 130 | 0 |
| B | 0 | 130 | 0 |
| C | 0 | 130 | 0 |
| D | 0 | 130 | 0 |
| Quadrant | Total seconds | Saturated seconds | Saturation percentage |
|---|---|---|---|
| A | 6360 | 17 | 0.267296% |
| B | 6359 | 443 | 6.966504% |
| C | 6359 | 178 | 2.799182% |
| D | 6359 | 1062 | 16.700739% |
Noise dominated data is calculated using 1-second bins in cleaned event files. If a bin has >2000 counts, and if more than 50% of those come from <1% of pixels, then it is considered to be noise-dominated and hence unusable.
| Quadrant | # 1 sec bins | Bins with >0 counts | Bins with >2000 counts | High rate bins dominated by noise | Noise dominated (total time) | Noise dominated (detector-on time) | Marked lightcurve |
|---|---|---|---|---|---|---|---|
| A | 7485 | 6361 | 0 | 0 | 0.00% | 0.00% | 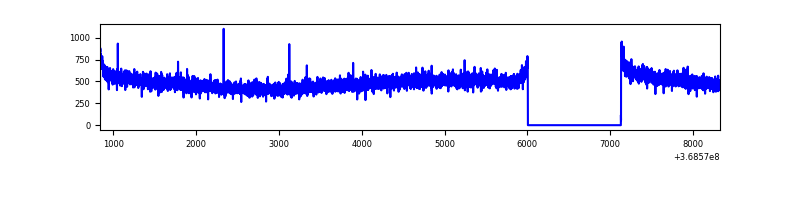 |
| B | 7484 | 6360 | 259 | 259 | 3.46% | 4.07% | 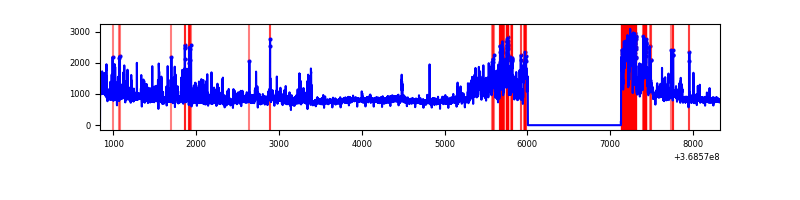 |
| C | 7484 | 6360 | 70 | 70 | 0.94% | 1.10% | 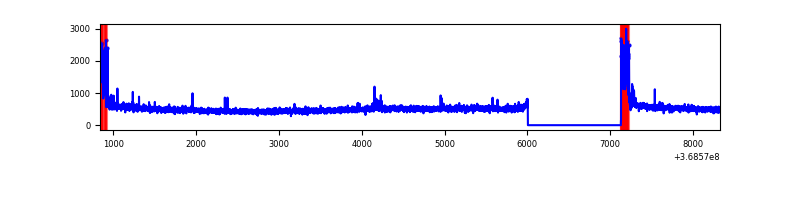 |
| D | 7484 | 6360 | 953 | 953 | 12.73% | 14.98% | 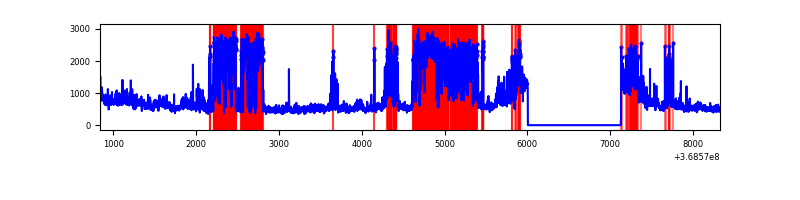 |
Top three noisy pixels from each quadrant. If the there are fewer than three noisy pixels in the level2.evt file, extra rows are filled as -1
| Pixel properties | Quadrant properties | ||||||
|---|---|---|---|---|---|---|---|
| Quadrant | DetID | PixID | Counts | Sigma | Mean | Median | Sigma |
| A | 13 | 6 | 15720 | 94.12 | 799 | 783 | 158.7 |
| A | 13 | 254 | 12727 | 75.26 | 799 | 783 | 158.7 |
| A | 3 | 137 | 7733 | 43.79 | 799 | 783 | 158.7 |
| B | 6 | 159 | 1760906 | 12101.37 | 769 | 753 | 145.5 |
| B | 10 | 245 | 1242360 | 8536.27 | 769 | 753 | 145.5 |
| B | 0 | 190 | 85812 | 584.8 | 769 | 753 | 145.5 |
| C | 0 | 10 | 281780 | 1587.92 | 757 | 763 | 177.0 |
| C | 14 | 238 | 126658 | 711.38 | 757 | 763 | 177.0 |
| C | 4 | 175 | 15728 | 84.56 | 757 | 763 | 177.0 |
| D | 2 | 250 | 2749815 | 16211.3 | 710 | 690 | 169.6 |
| D | 8 | 195 | 848023 | 4996.63 | 710 | 690 | 169.6 |
| D | 2 | 234 | 36084 | 208.71 | 710 | 690 | 169.6 |
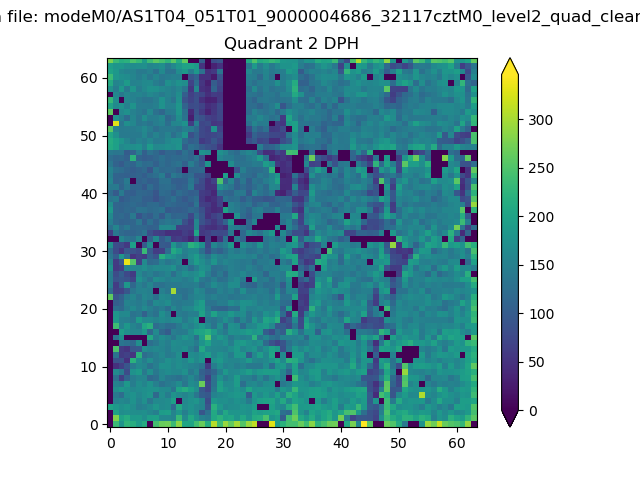
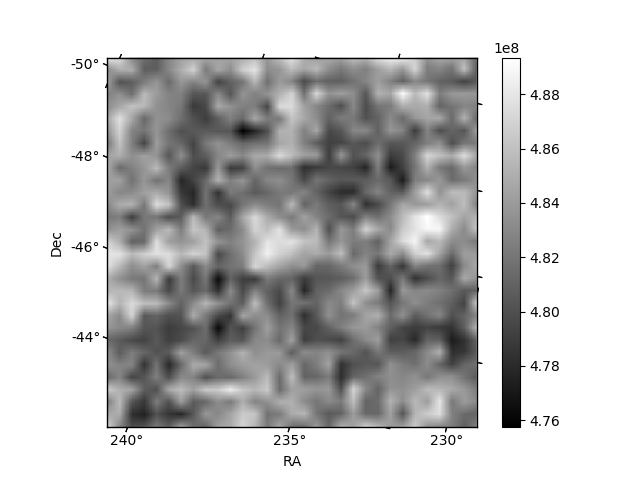
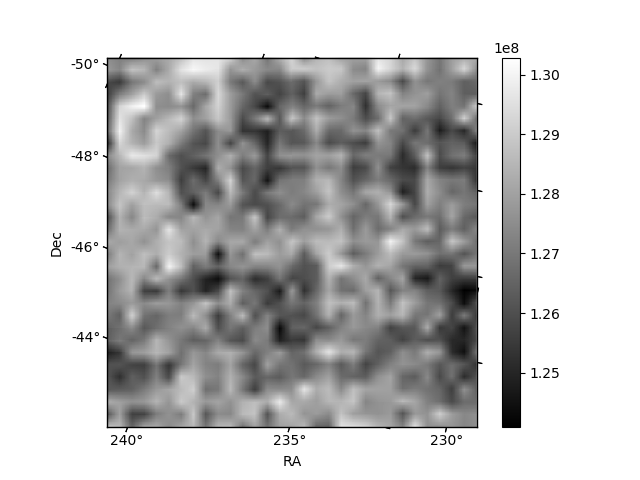
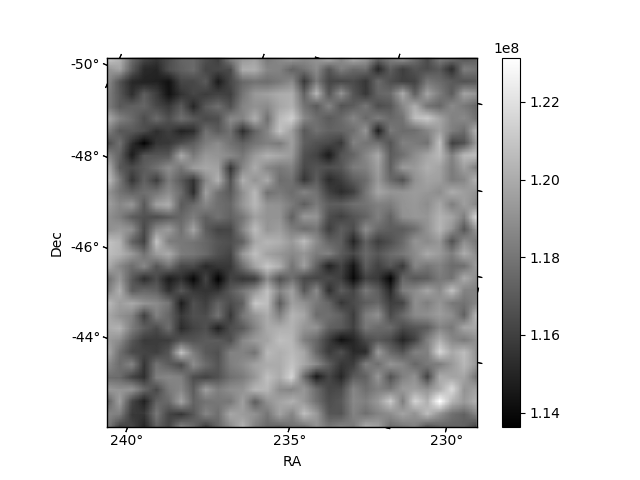
Histogram calculated using DETX and DETY for each event in the final _common_clean file
| Quadrant A | 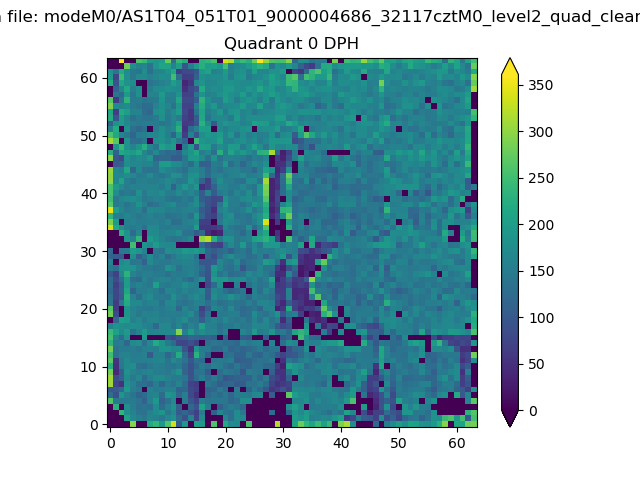 |
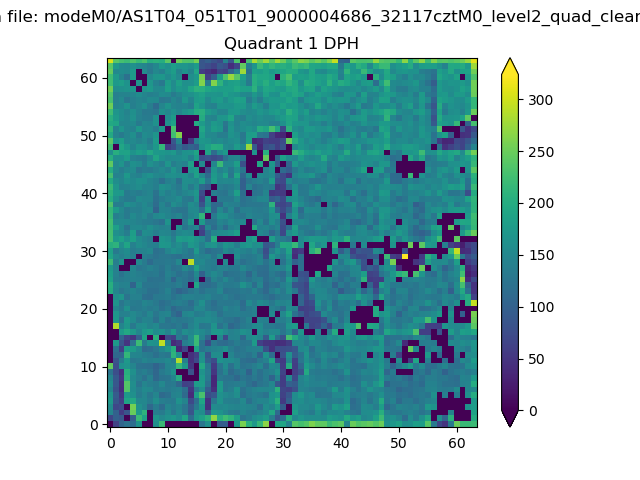 |
Quadrant B |
|---|---|---|---|
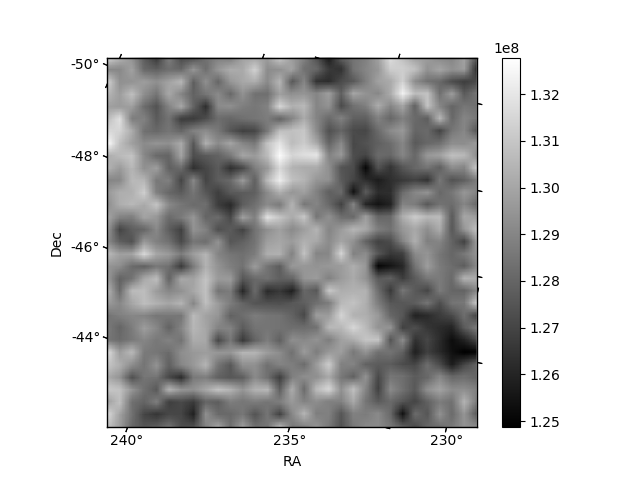
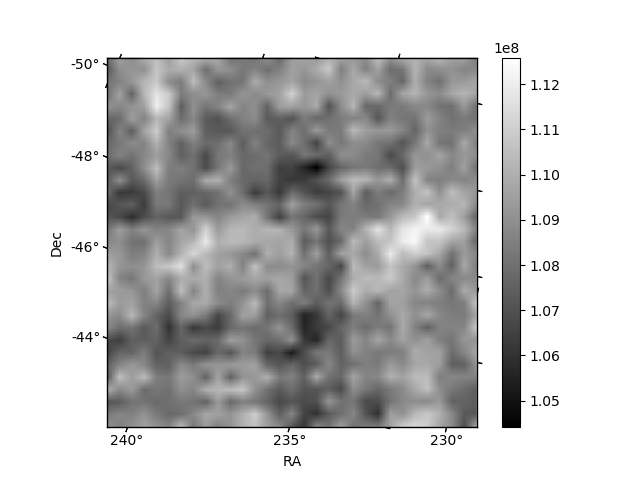
| Quadrant D | 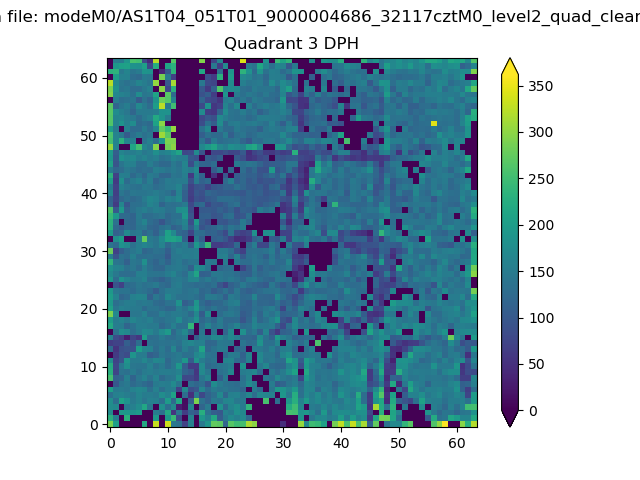 |
 |
Quadrant C |
| Plot type | Count rate plots | Images |
|---|---|---|
| Comparison with Poisson distribution Blue bars denote a histogram of data divided into 1 sec bins. Red curve is a Poisson curve with rate = median count rate of data. |
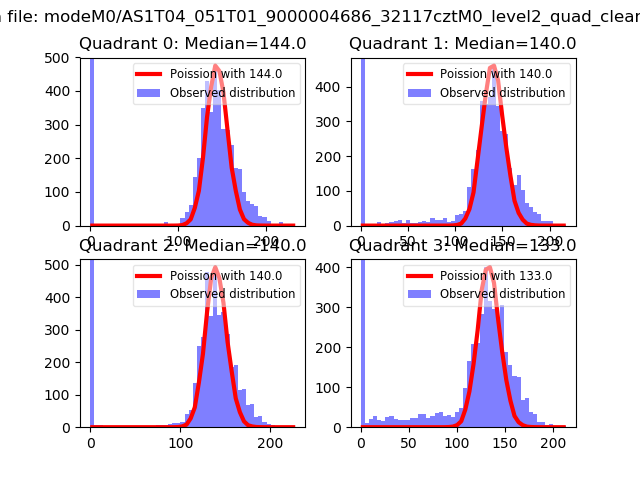 |
 |
| Quadrant-wise count rates Data is divided into 100 sec bins |
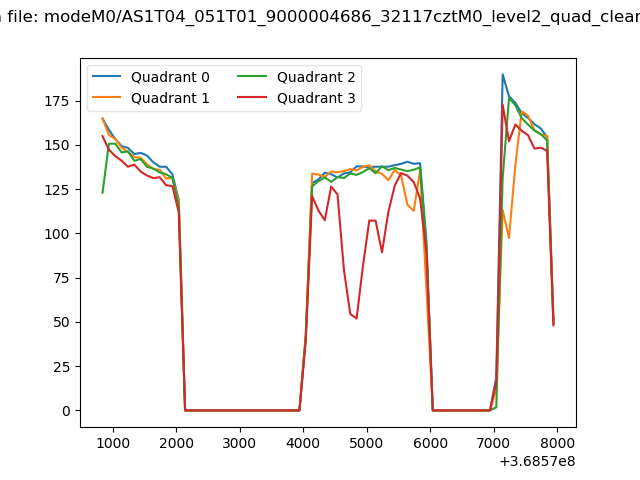 |
|
| Module-wise count rates for Quadrant A Data is divided into 100 sec bins |
 |
 |
| Module-wise count rates for Quadrant B Data is divided into 100 sec bins |
 |
 |
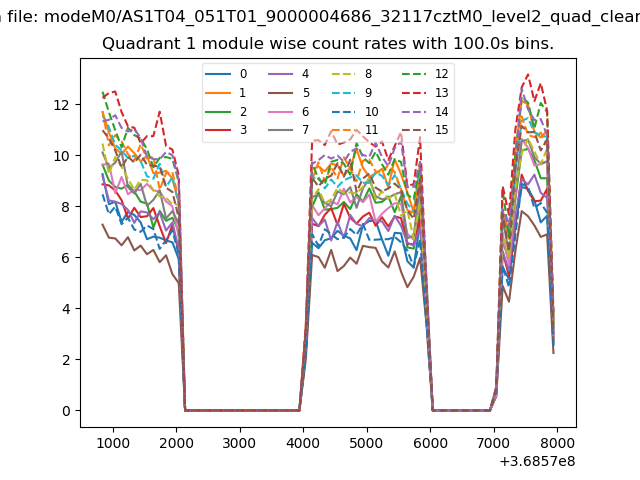
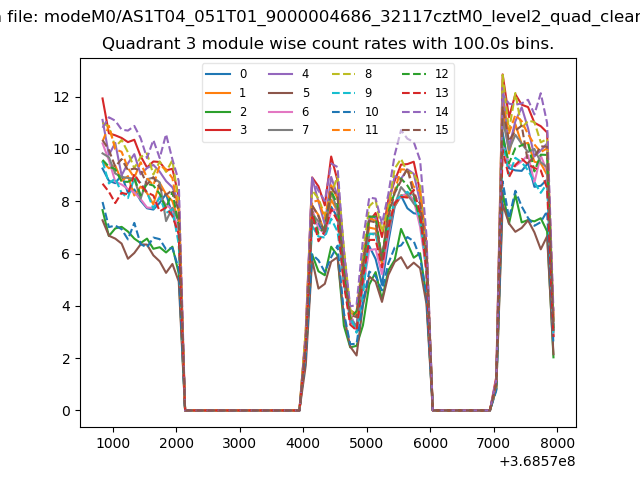
| Module-wise count rates for Quadrant C Data is divided into 100 sec bins |
 |
 |
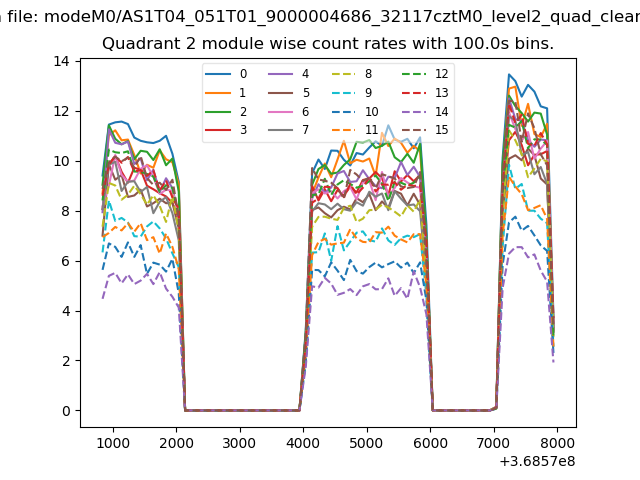
| Module-wise count rates for Quadrant D Data is divided into 100 sec bins |
 |
 |
| Parameter | Plot |
|---|---|
| CZT HV Monitor |  |
| D_VDD | 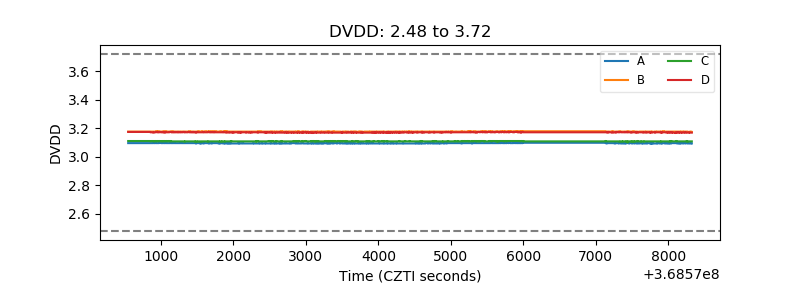 |
| Temperature 1 | 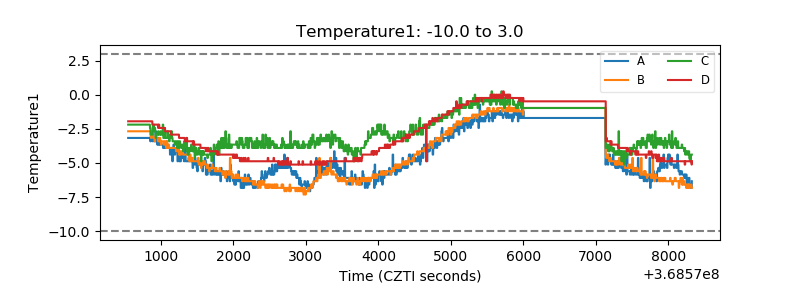 |
| Veto HV Monitor | 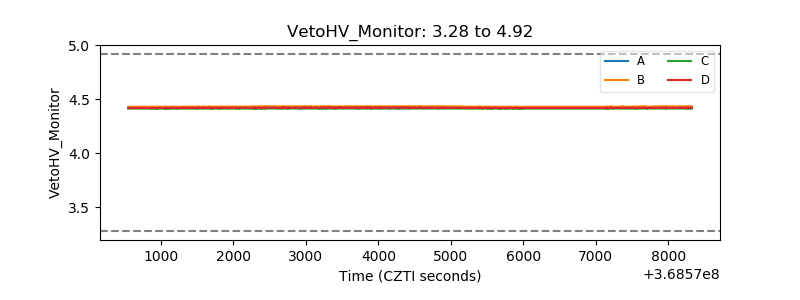 |
| Veto LLD | 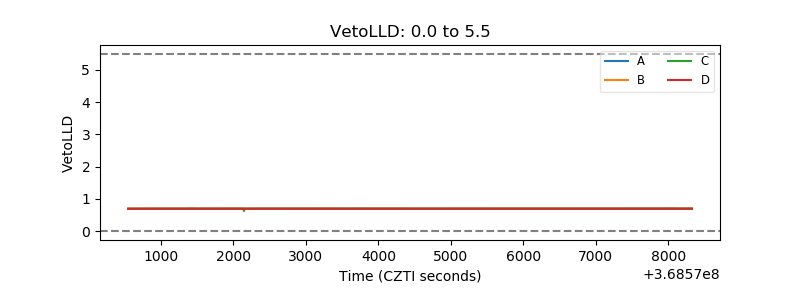 |
| Alpha Counter | 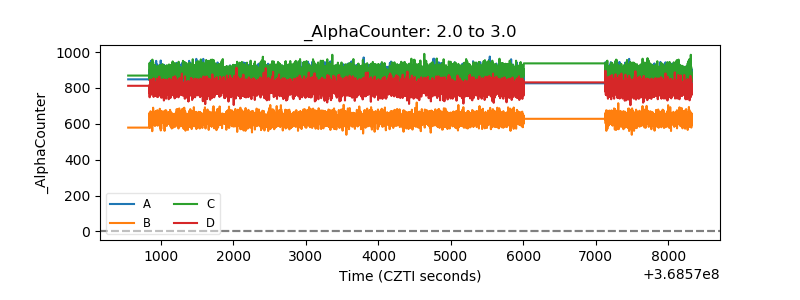 |
| _CPM_Rate | 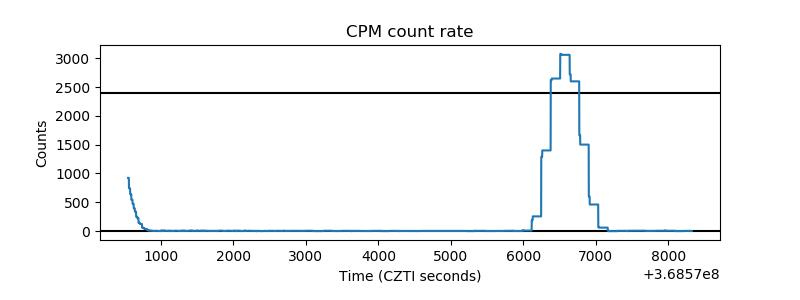 |
| CZT Counter | 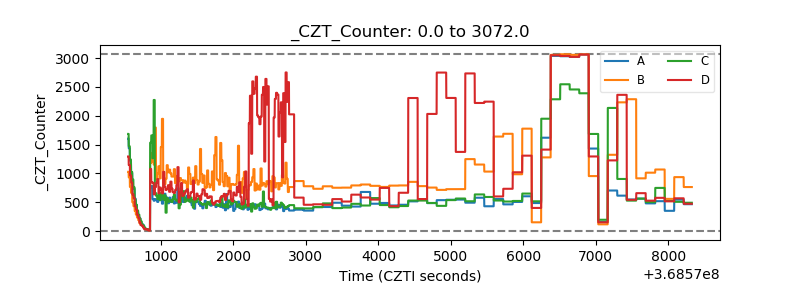 |
| +2.5 Volts monitor |  |
| +5 Volts monitor |  |
| _ROLL_ROT | 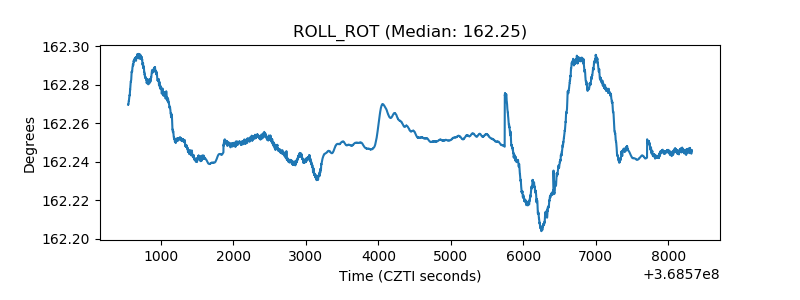 |
| _Roll_DEC |  |
| _Roll_RA | 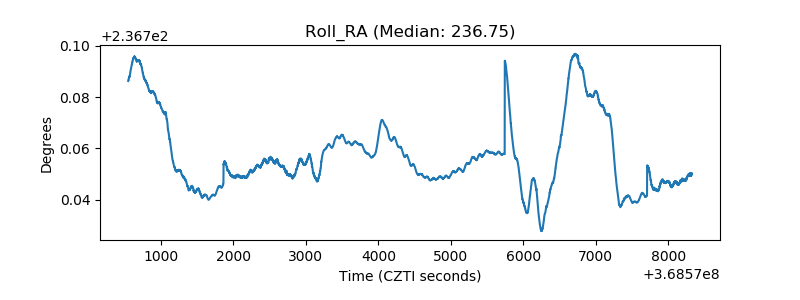 |
| Veto Counter |  |