| Param | Original file | Final file |
|---|---|---|
| Filename | modeM0/AS1T04_051T01_9000004686_32118cztM0_level2.evt | modeM0/AS1T04_051T01_9000004686_32118cztM0_level2_quad_clean.evt |
| Size (bytes) | 500,480,640 | 65,836,800 |
| Size | 477.3 MB | 62.8 MB |
| Events in quadrant A | 2,767,583 | 419,167 |
| Events in quadrant B | 5,250,605 | 401,810 |
| Events in quadrant C | 2,923,471 | 408,404 |
| Events in quadrant D | 3,846,728 | 382,970 |
| Mode M9 | |||
|---|---|---|---|
| Quadrant | BADHDUFLAG | Total packets | Discarded packets |
| A | 0 | 12 | 0 |
| B | 0 | 12 | 0 |
| C | 0 | 12 | 0 |
| D | 0 | 13 | 1 |
| Mode M0 | |||
|---|---|---|---|
| Quadrant | BADHDUFLAG | Total packets | Discarded packets |
| A | 0 | 12171 | 701 |
| B | 0 | 20864 | 1629 |
| C | 0 | 12613 | 706 |
| D | 0 | 16017 | 1136 |
| Mode SS | |||
|---|---|---|---|
| Quadrant | BADHDUFLAG | Total packets | Discarded packets |
| A | 0 | 119 | 5 |
| B | 0 | 118 | 8 |
| C | 0 | 118 | 6 |
| D | 0 | 119 | 7 |
| Quadrant | Total seconds | Saturated seconds | Saturation percentage |
|---|---|---|---|
| A | 5453 | 27 | 0.495140% |
| B | 5399 | 269 | 4.982404% |
| C | 5457 | 108 | 1.979109% |
| D | 5433 | 250 | 4.601509% |
Noise dominated data is calculated using 1-second bins in cleaned event files. If a bin has >2000 counts, and if more than 50% of those come from <1% of pixels, then it is considered to be noise-dominated and hence unusable.
| Quadrant | # 1 sec bins | Bins with >0 counts | Bins with >2000 counts | High rate bins dominated by noise | Noise dominated (total time) | Noise dominated (detector-on time) | Marked lightcurve |
|---|---|---|---|---|---|---|---|
| A | 7166 | 5517 | 0 | 0 | 0.00% | 0.00% | 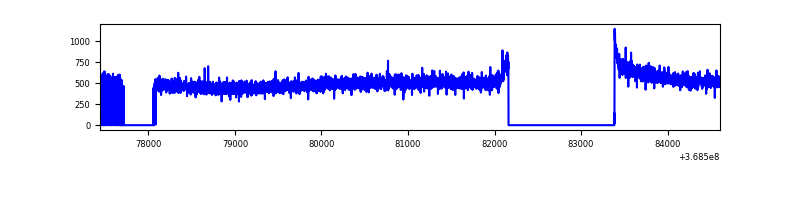 |
| B | 7161 | 5455 | 106 | 106 | 1.48% | 1.94% | 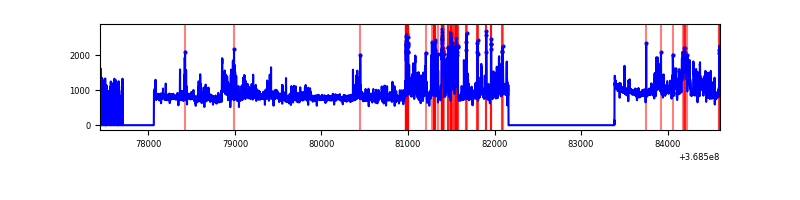 |
| C | 7165 | 5523 | 29 | 29 | 0.40% | 0.53% | 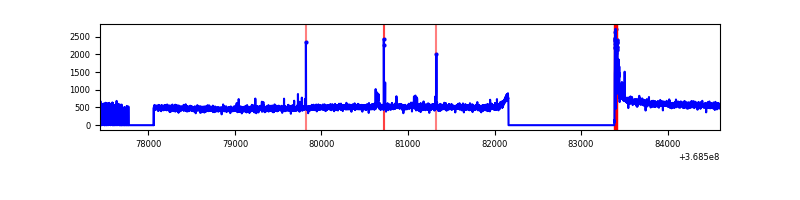 |
| D | 7163 | 5489 | 196 | 196 | 2.74% | 3.57% | 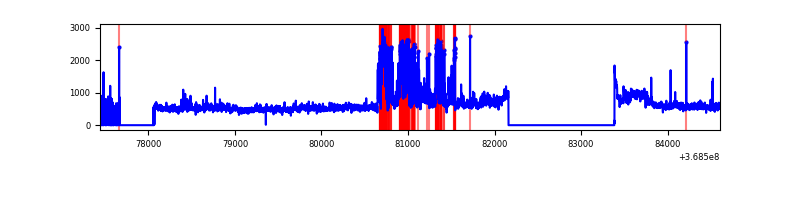 |
Top three noisy pixels from each quadrant. If the there are fewer than three noisy pixels in the level2.evt file, extra rows are filled as -1
| Pixel properties | Quadrant properties | ||||||
|---|---|---|---|---|---|---|---|
| Quadrant | DetID | PixID | Counts | Sigma | Mean | Median | Sigma |
| A | 13 | 6 | 17003 | 116.11 | 712 | 701 | 140.4 |
| A | 13 | 254 | 10482 | 69.67 | 712 | 701 | 140.4 |
| A | 3 | 137 | 6741 | 43.02 | 712 | 701 | 140.4 |
| B | 6 | 159 | 1485789 | 11449.11 | 691 | 676 | 129.7 |
| B | 10 | 245 | 889005 | 6848.35 | 691 | 676 | 129.7 |
| B | 0 | 190 | 64501 | 492.04 | 691 | 676 | 129.7 |
| C | 14 | 238 | 119809 | 757.34 | 684 | 689 | 157.3 |
| C | 0 | 10 | 92120 | 581.3 | 684 | 689 | 157.3 |
| C | 2 | 114 | 12489 | 75.02 | 684 | 689 | 157.3 |
| D | 2 | 250 | 676093 | 4228.41 | 675 | 658 | 159.7 |
| D | 8 | 195 | 590384 | 3691.85 | 675 | 658 | 159.7 |
| D | 2 | 234 | 30036 | 183.91 | 675 | 658 | 159.7 |
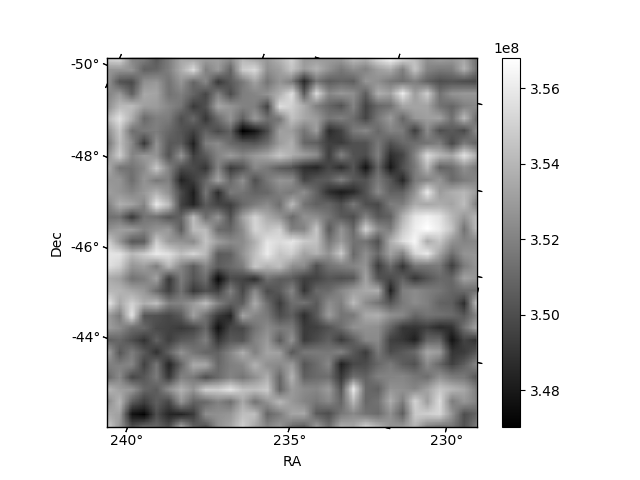
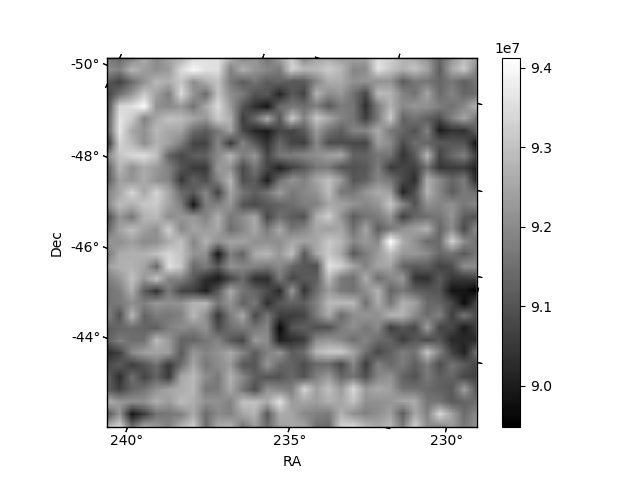
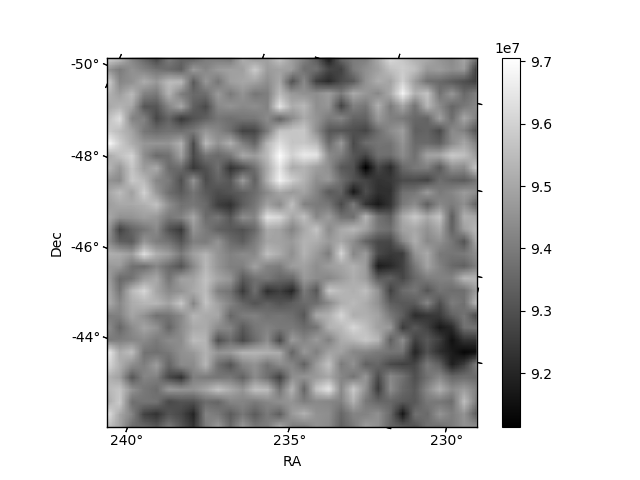
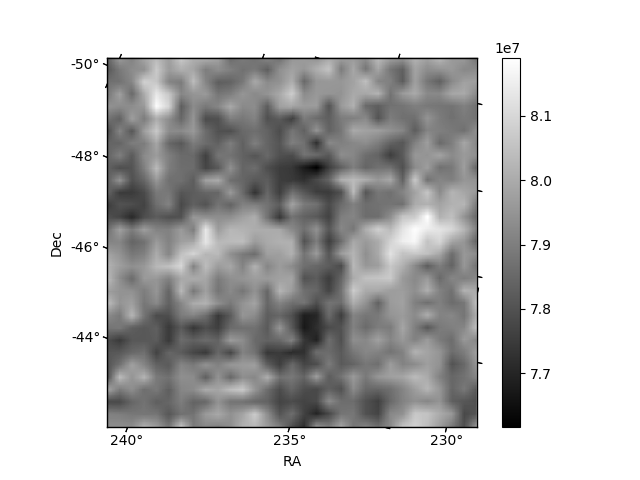
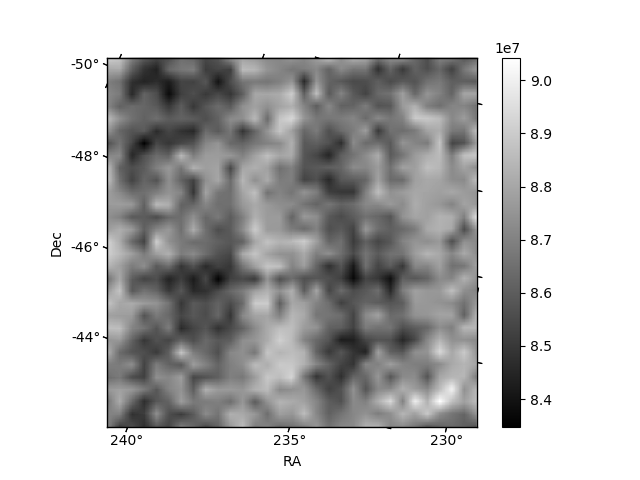
Histogram calculated using DETX and DETY for each event in the final _common_clean file
| Quadrant A | 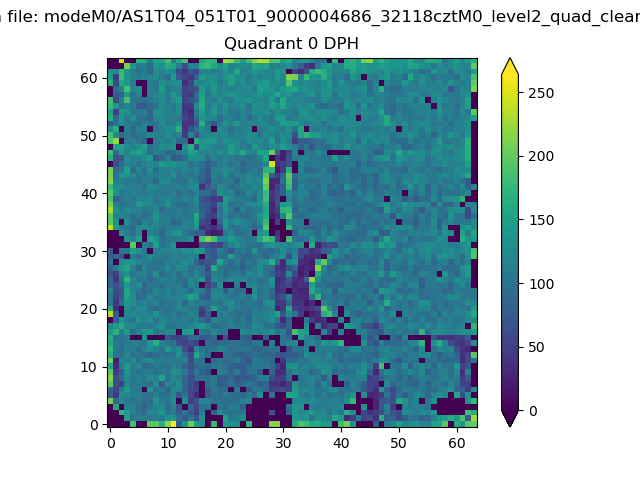 |
 |
Quadrant B |
|---|---|---|---|
| Quadrant D | 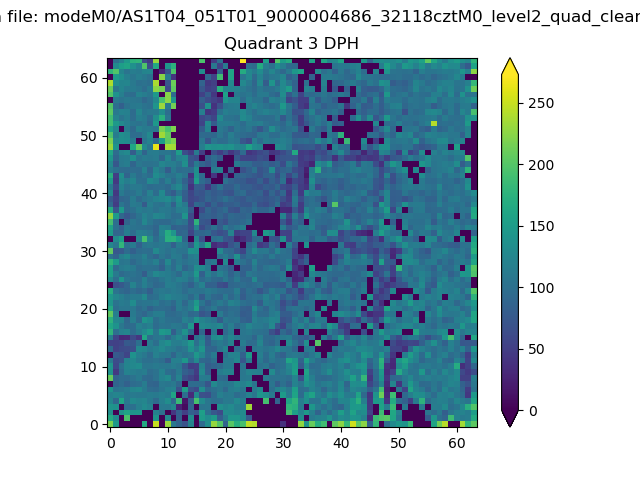 |
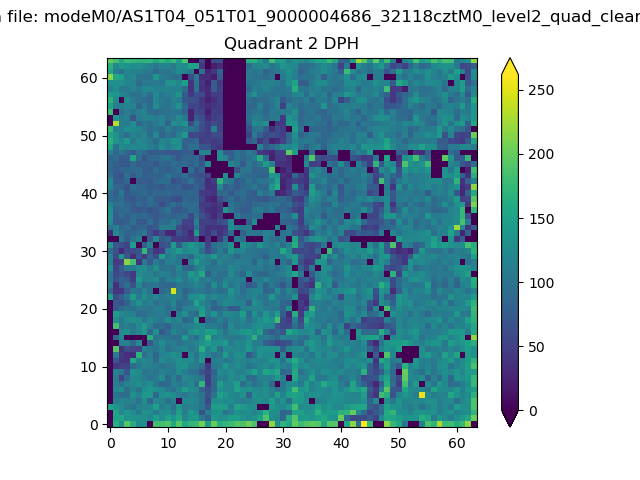 |
Quadrant C |
| Plot type | Count rate plots | Images |
|---|---|---|
| Comparison with Poisson distribution Blue bars denote a histogram of data divided into 1 sec bins. Red curve is a Poisson curve with rate = median count rate of data. |
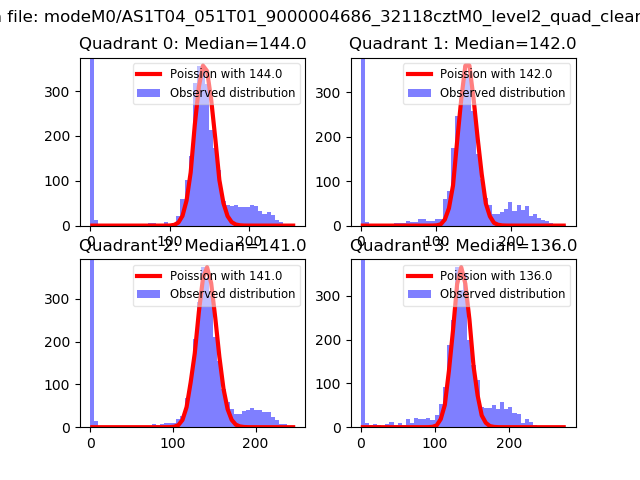 |
 |
| Quadrant-wise count rates Data is divided into 100 sec bins |
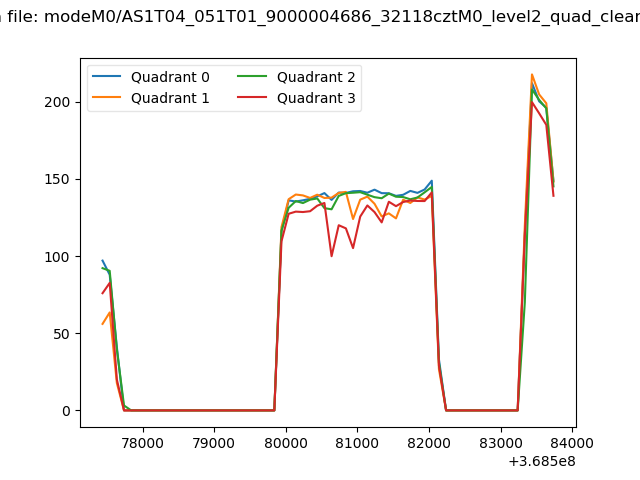 |
|
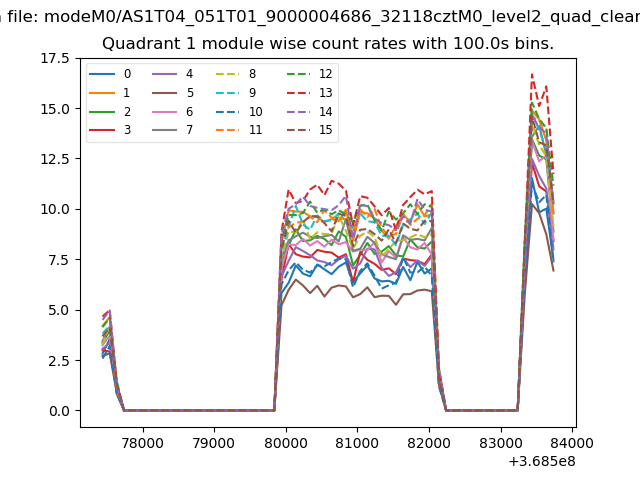
| Module-wise count rates for Quadrant A Data is divided into 100 sec bins |
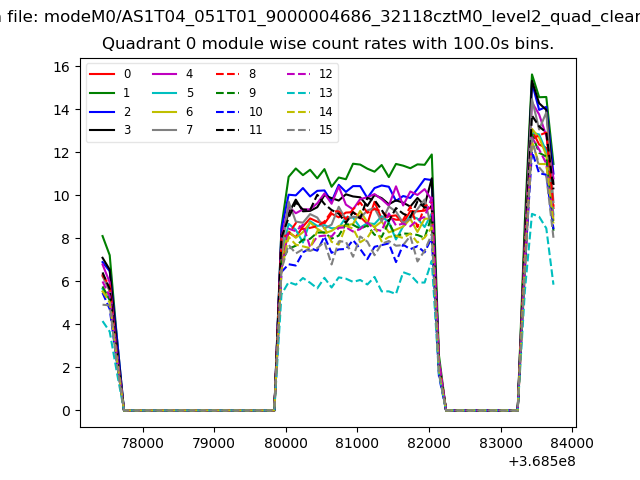 |
 |
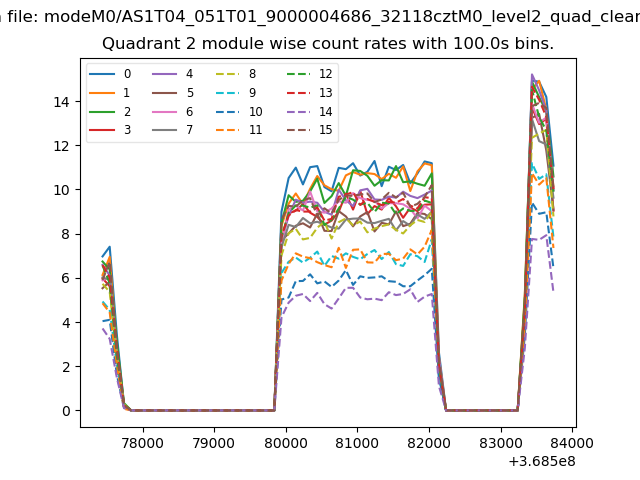
| Module-wise count rates for Quadrant B Data is divided into 100 sec bins |
 |
 |
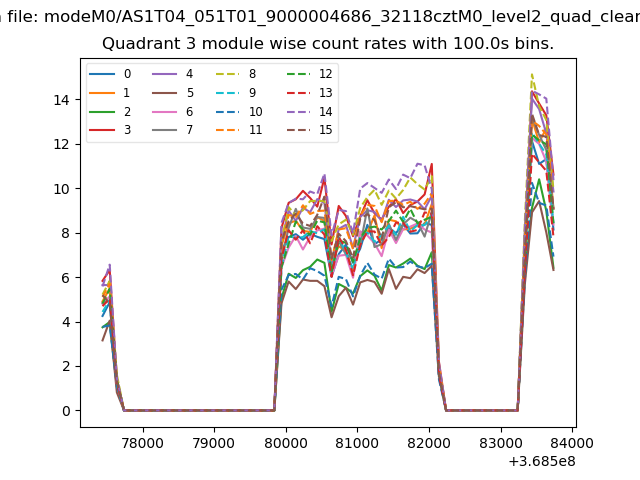
| Module-wise count rates for Quadrant C Data is divided into 100 sec bins |
 |
 |
| Module-wise count rates for Quadrant D Data is divided into 100 sec bins |
 |
 |
| Parameter | Plot |
|---|---|
| CZT HV Monitor | 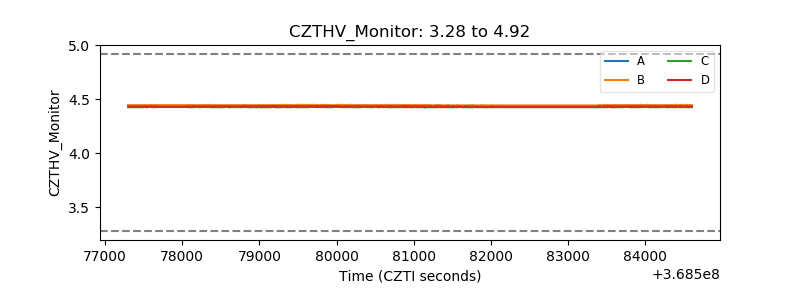 |
| D_VDD | 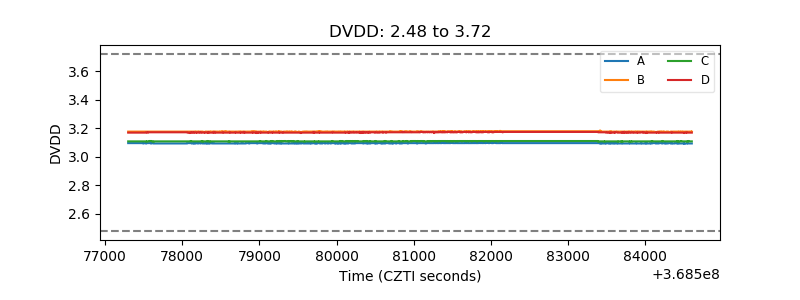 |
| Temperature 1 | 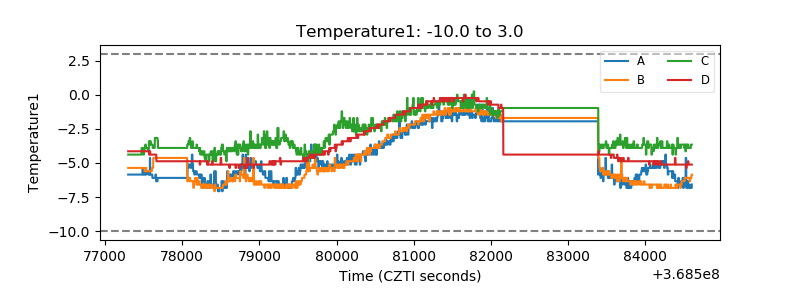 |
| Veto HV Monitor | 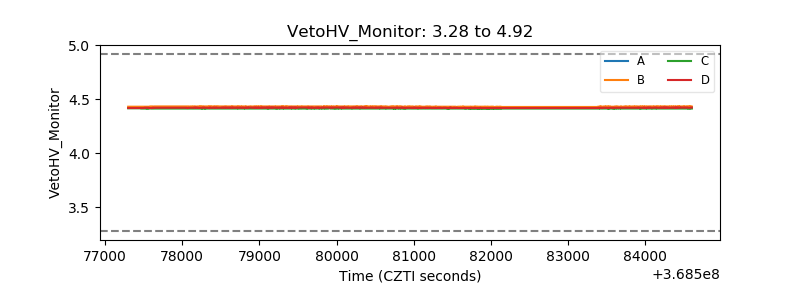 |
| Veto LLD | 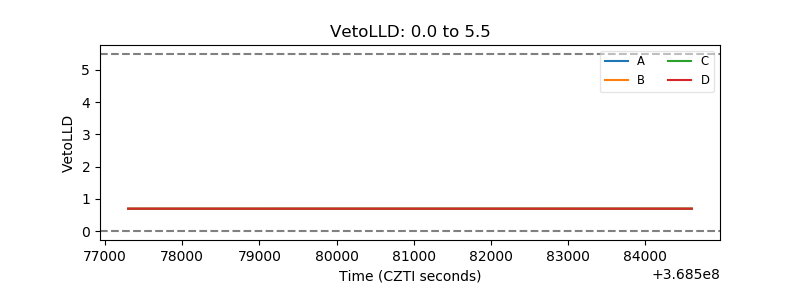 |
| Alpha Counter | 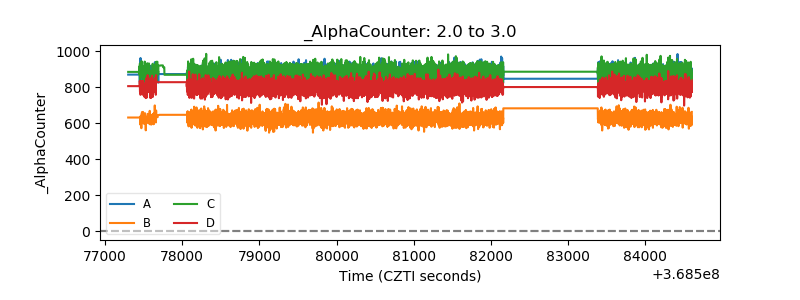 |
| _CPM_Rate | 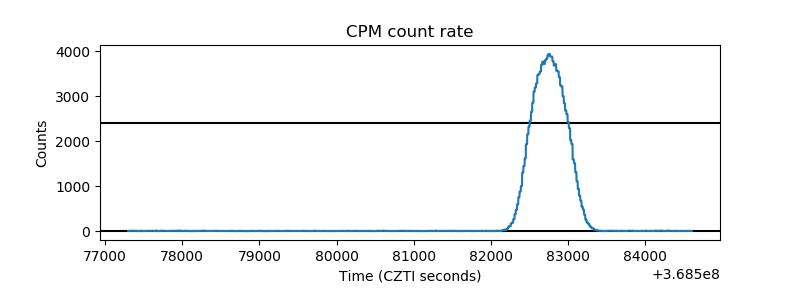 |
| CZT Counter | 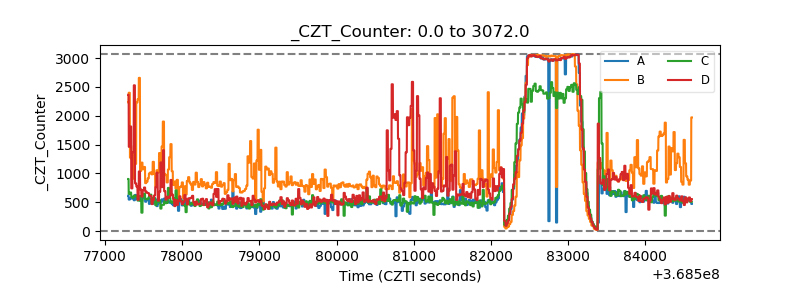 |
| +2.5 Volts monitor |  |
| +5 Volts monitor | 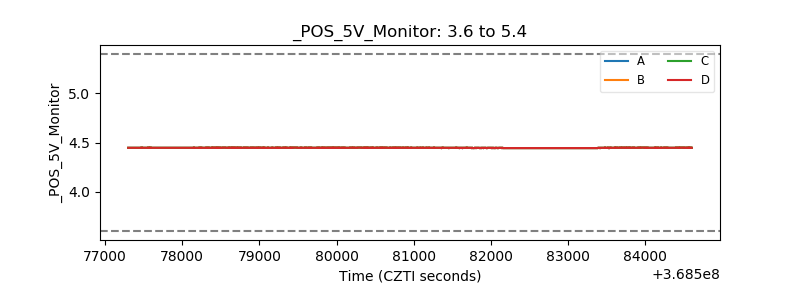 |
| _ROLL_ROT | 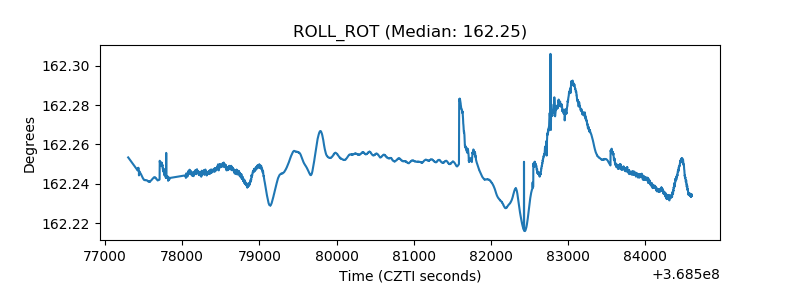 |
| _Roll_DEC | 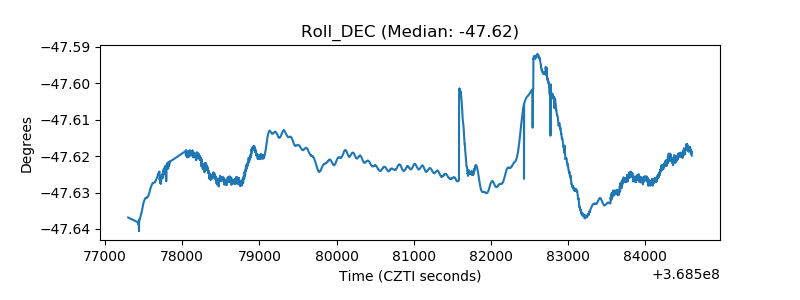 |
| _Roll_RA |  |
| Veto Counter | 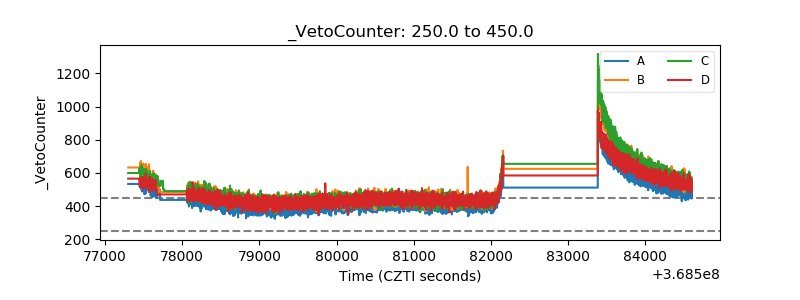 |