| Param | Original file | Final file |
|---|---|---|
| Filename | modeM0/AS1T04_051T01_9000004686_32119cztM0_level2.evt | modeM0/AS1T04_051T01_9000004686_32119cztM0_level2_quad_clean.evt |
| Size (bytes) | 644,353,920 | 73,310,400 |
| Size | 614.5 MB | 69.9 MB |
| Events in quadrant A | 3,454,174 | 465,397 |
| Events in quadrant B | 7,011,231 | 440,796 |
| Events in quadrant C | 3,938,395 | 448,956 |
| Events in quadrant D | 4,681,982 | 421,456 |
| Mode M9 | |||
|---|---|---|---|
| Quadrant | BADHDUFLAG | Total packets | Discarded packets |
| A | 0 | 23 | 0 |
| B | 0 | 24 | 0 |
| C | 0 | 24 | 0 |
| D | 0 | 24 | 0 |
| Mode M0 | |||
|---|---|---|---|
| Quadrant | BADHDUFLAG | Total packets | Discarded packets |
| A | 0 | 13950 | 2 |
| B | 0 | 25041 | 2 |
| C | 0 | 15615 | 2 |
| D | 0 | 18099 | 2 |
| Mode SS | |||
|---|---|---|---|
| Quadrant | BADHDUFLAG | Total packets | Discarded packets |
| A | 0 | 128 | 0 |
| B | 0 | 128 | 0 |
| C | 0 | 128 | 0 |
| D | 0 | 128 | 0 |
| Quadrant | Total seconds | Saturated seconds | Saturation percentage |
|---|---|---|---|
| A | 6347 | 45 | 0.708996% |
| B | 6347 | 615 | 9.689617% |
| C | 6347 | 255 | 4.017646% |
| D | 6347 | 326 | 5.136285% |
Noise dominated data is calculated using 1-second bins in cleaned event files. If a bin has >2000 counts, and if more than 50% of those come from <1% of pixels, then it is considered to be noise-dominated and hence unusable.
| Quadrant | # 1 sec bins | Bins with >0 counts | Bins with >2000 counts | High rate bins dominated by noise | Noise dominated (total time) | Noise dominated (detector-on time) | Marked lightcurve |
|---|---|---|---|---|---|---|---|
| A | 7657 | 6348 | 0 | 0 | 0.00% | 0.00% | 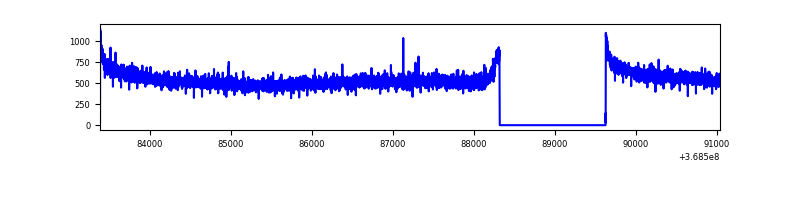 |
| B | 7657 | 6348 | 331 | 331 | 4.32% | 5.21% | 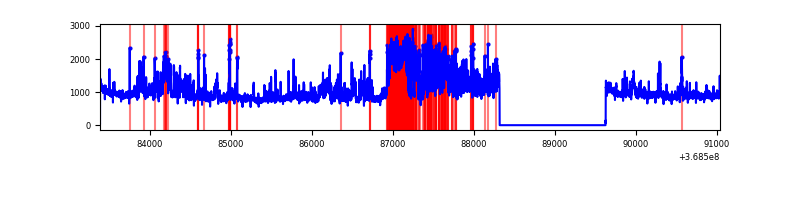 |
| C | 7657 | 6348 | 118 | 118 | 1.54% | 1.86% | 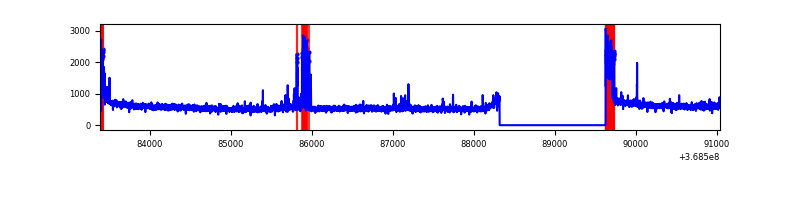 |
| D | 7657 | 6348 | 277 | 277 | 3.62% | 4.36% | 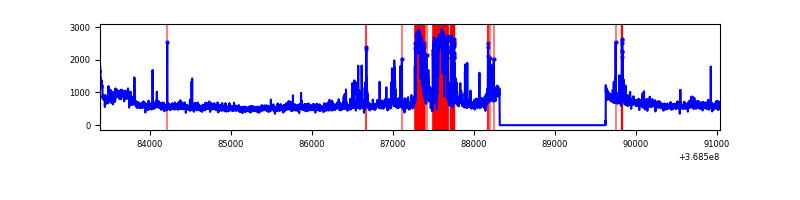 |
Top three noisy pixels from each quadrant. If the there are fewer than three noisy pixels in the level2.evt file, extra rows are filled as -1
| Pixel properties | Quadrant properties | ||||||
|---|---|---|---|---|---|---|---|
| Quadrant | DetID | PixID | Counts | Sigma | Mean | Median | Sigma |
| A | 13 | 6 | 16231 | 88.43 | 890 | 875 | 173.6 |
| A | 13 | 254 | 12280 | 65.68 | 890 | 875 | 173.6 |
| A | 3 | 137 | 7999 | 41.03 | 890 | 875 | 173.6 |
| B | 6 | 159 | 1722525 | 10877.03 | 864 | 847 | 158.3 |
| B | 10 | 245 | 1671173 | 10552.6 | 864 | 847 | 158.3 |
| B | 5 | 172 | 79924 | 499.58 | 864 | 847 | 158.3 |
| C | 0 | 10 | 295503 | 1521.73 | 851 | 859 | 193.6 |
| C | 14 | 238 | 143938 | 738.95 | 851 | 859 | 193.6 |
| C | 15 | 208 | 116698 | 598.27 | 851 | 859 | 193.6 |
| D | 12 | 233 | 736529 | 3733.87 | 845 | 825 | 197.0 |
| D | 8 | 195 | 625454 | 3170.13 | 845 | 825 | 197.0 |
| D | 2 | 250 | 85896 | 431.75 | 845 | 825 | 197.0 |
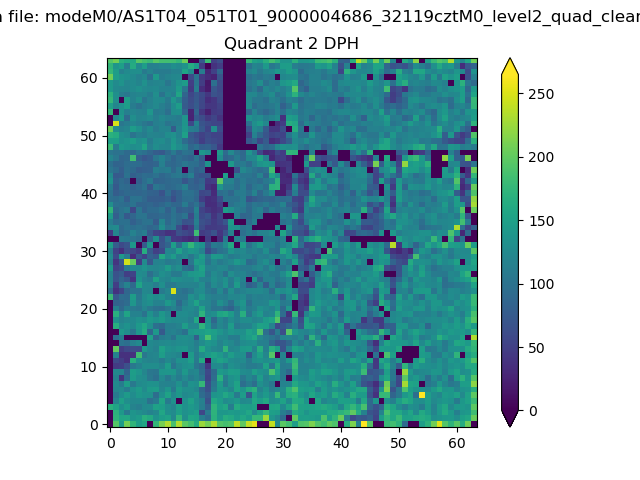
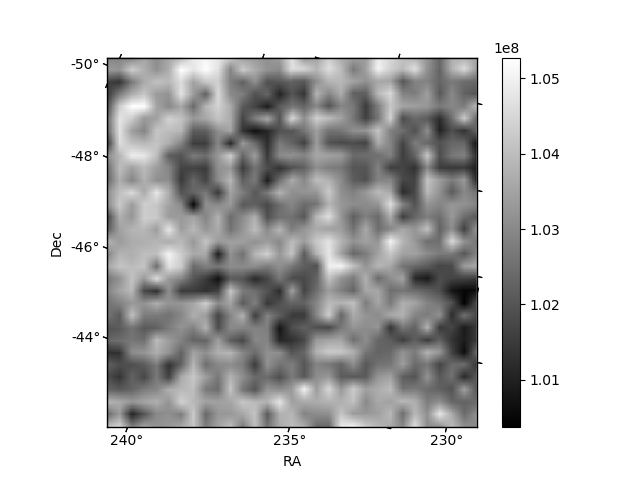
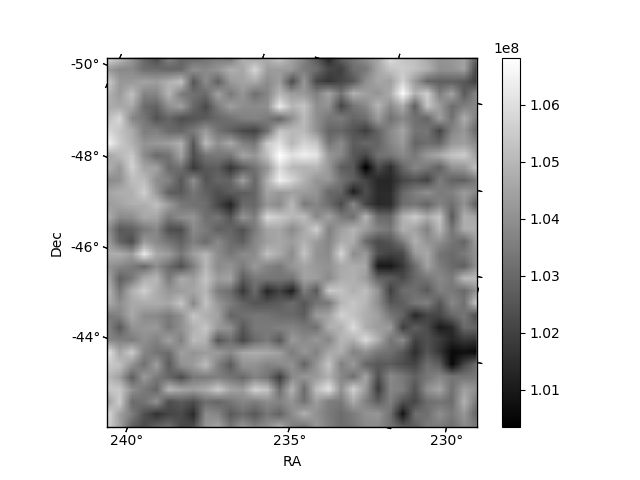
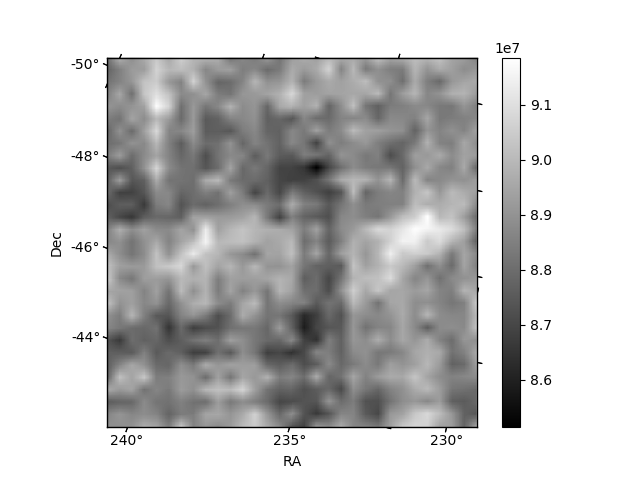
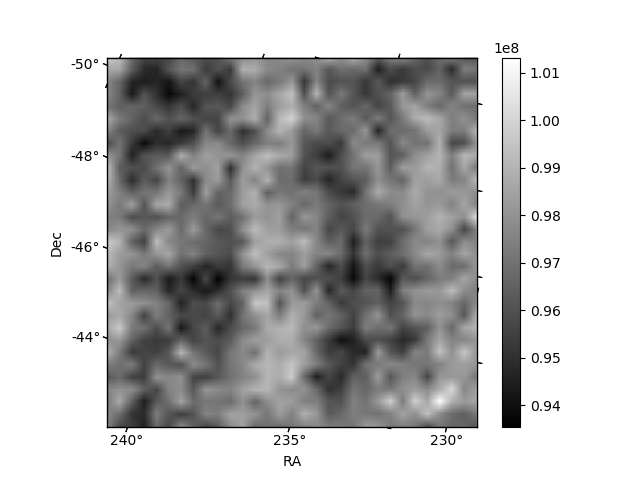
Histogram calculated using DETX and DETY for each event in the final _common_clean file
| Quadrant A | 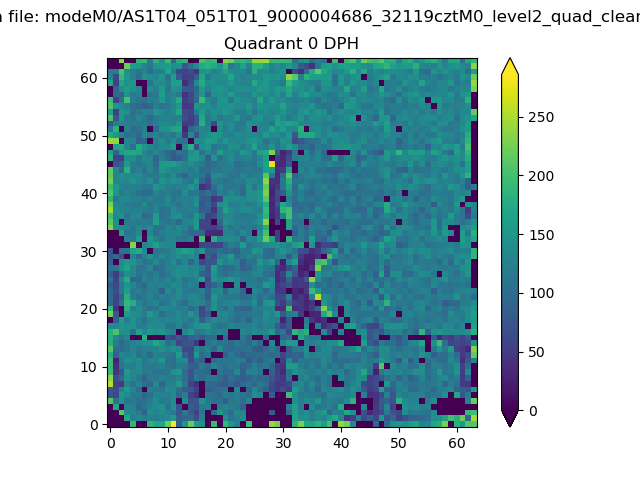 |
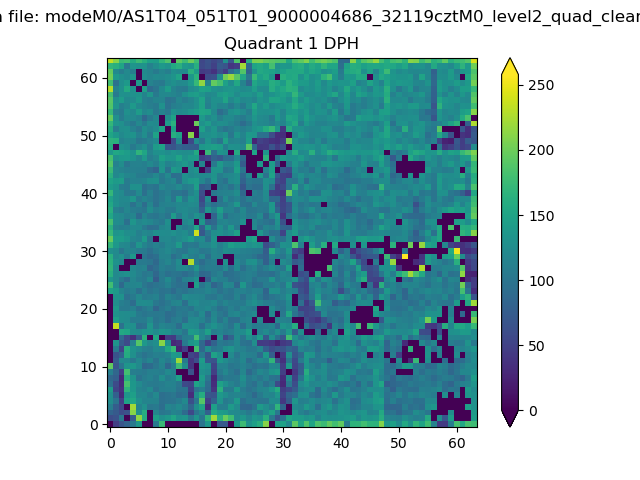 |
Quadrant B |
|---|---|---|---|
| Quadrant D | 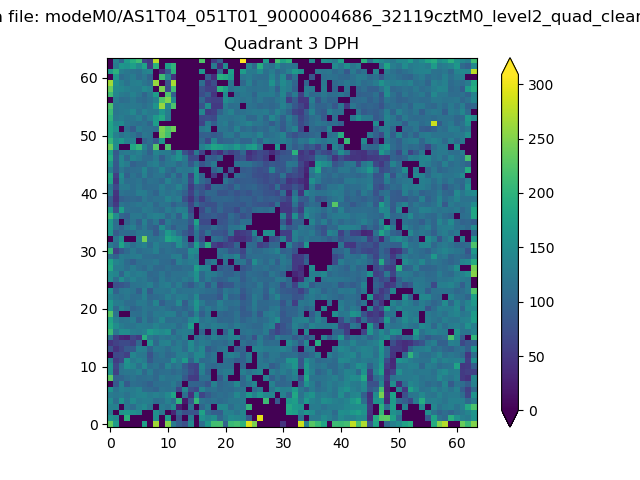 |
 |
Quadrant C |
| Plot type | Count rate plots | Images |
|---|---|---|
| Comparison with Poisson distribution Blue bars denote a histogram of data divided into 1 sec bins. Red curve is a Poisson curve with rate = median count rate of data. |
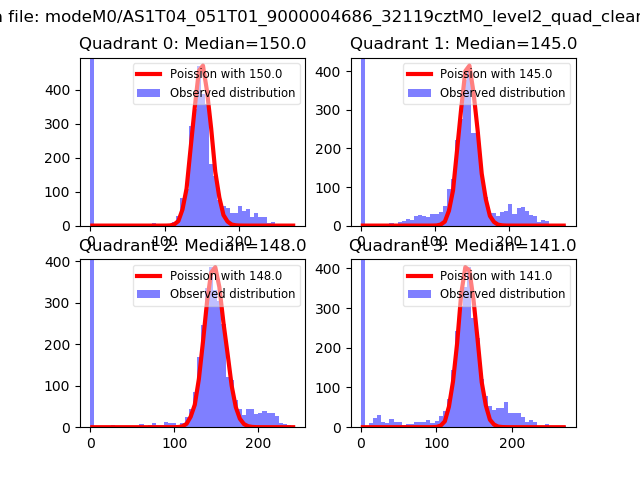 |
 |
| Quadrant-wise count rates Data is divided into 100 sec bins |
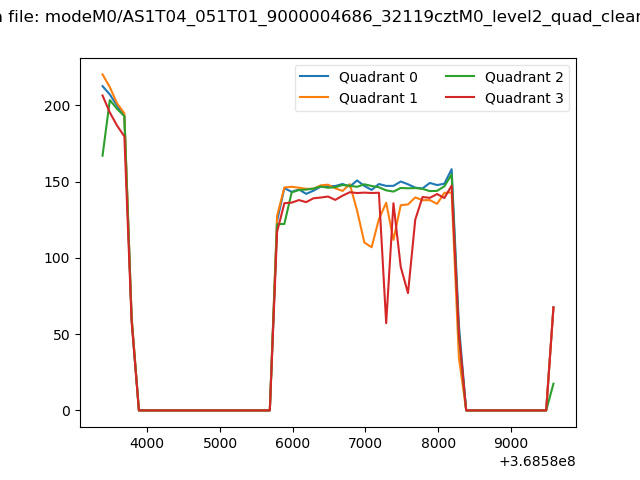 |
|
| Module-wise count rates for Quadrant A Data is divided into 100 sec bins |
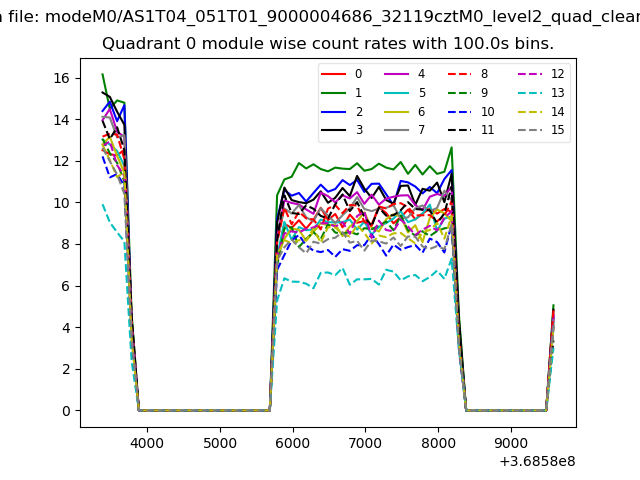 |
 |
| Module-wise count rates for Quadrant B Data is divided into 100 sec bins |
 |
 |
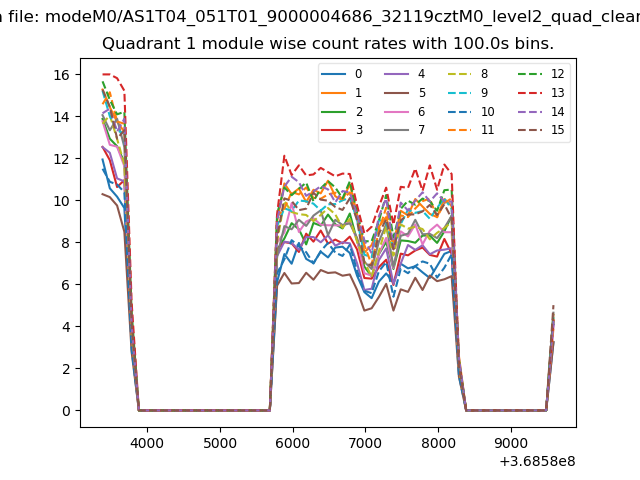
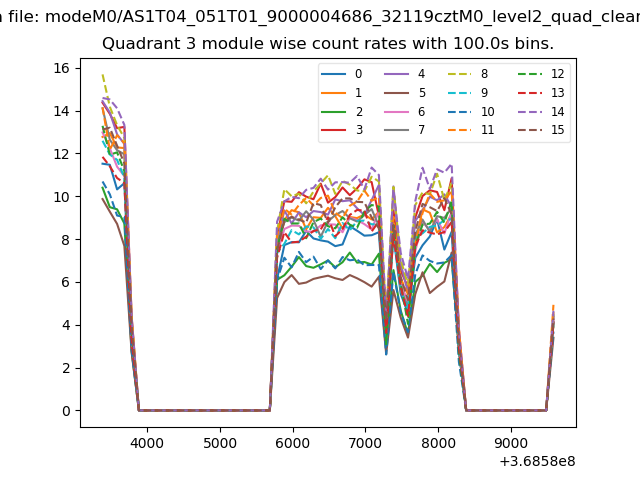
| Module-wise count rates for Quadrant C Data is divided into 100 sec bins |
 |
 |
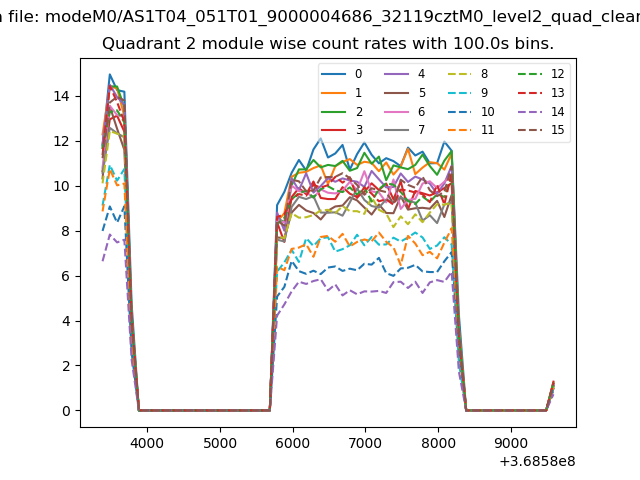
| Module-wise count rates for Quadrant D Data is divided into 100 sec bins |
 |
 |
| Parameter | Plot |
|---|---|
| CZT HV Monitor |  |
| D_VDD | 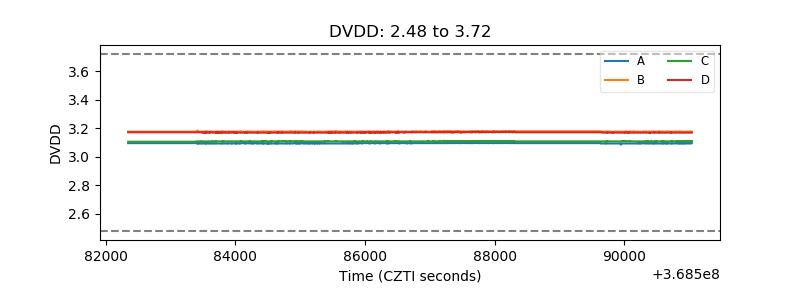 |
| Temperature 1 | 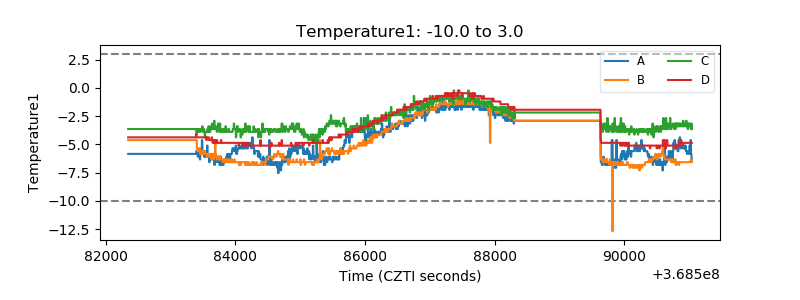 |
| Veto HV Monitor | 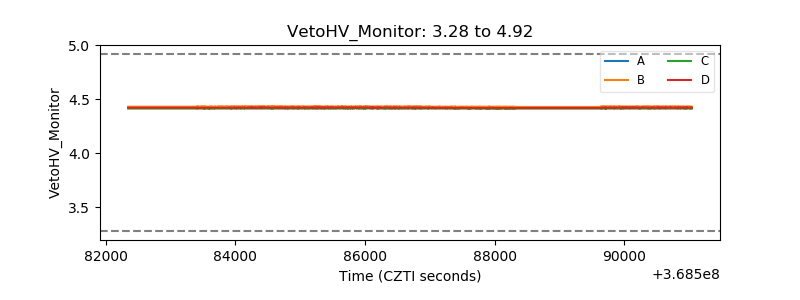 |
| Veto LLD | 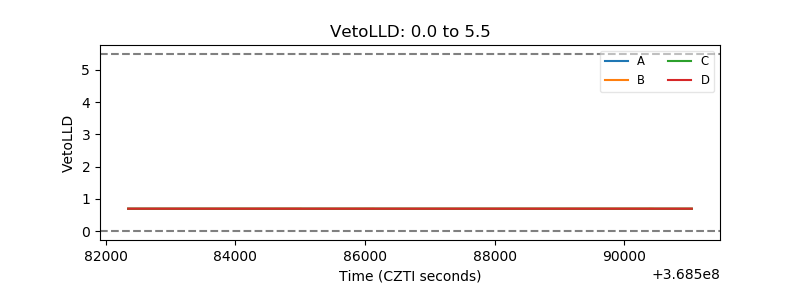 |
| Alpha Counter | 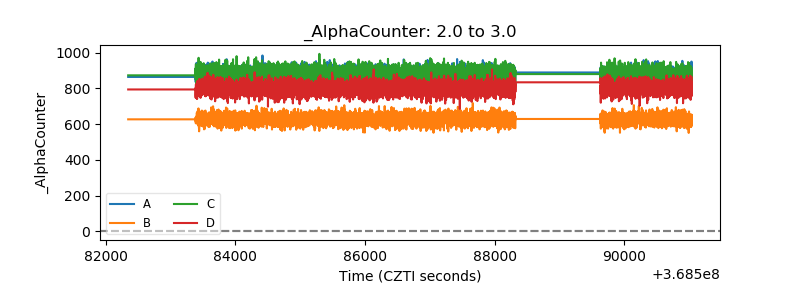 |
| _CPM_Rate | 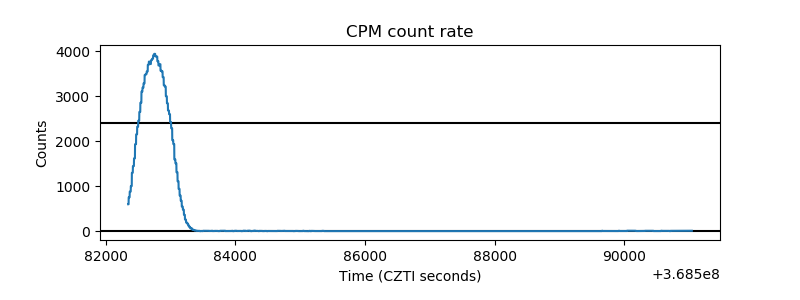 |
| CZT Counter | 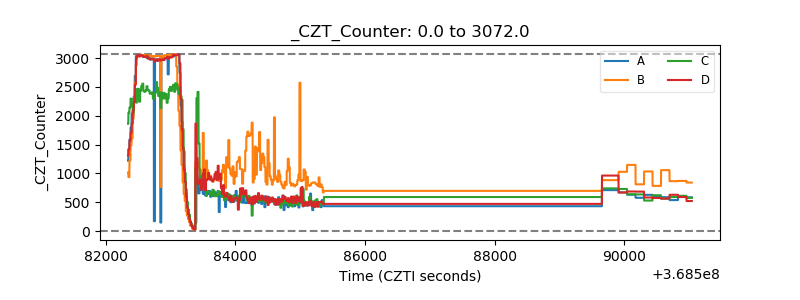 |
| +2.5 Volts monitor |  |
| +5 Volts monitor |  |
| _ROLL_ROT | 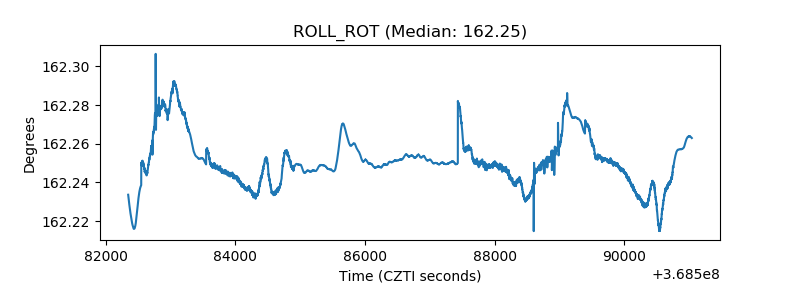 |
| _Roll_DEC | 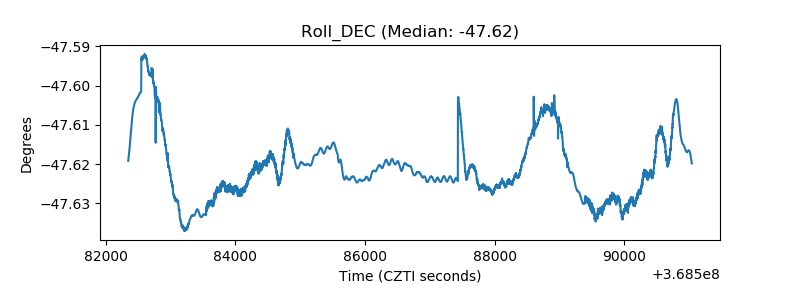 |
| _Roll_RA | 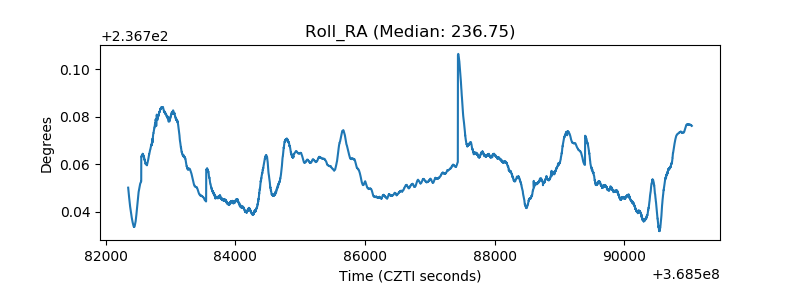 |
| Veto Counter |  |