| Param | Original file | Final file |
|---|---|---|
| Filename | modeM0/AS1T04_051T01_9000004686_32120cztM0_level2.evt | modeM0/AS1T04_051T01_9000004686_32120cztM0_level2_quad_clean.evt |
| Size (bytes) | 607,438,080 | 70,067,520 |
| Size | 579.3 MB | 66.8 MB |
| Events in quadrant A | 3,386,312 | 439,086 |
| Events in quadrant B | 6,693,912 | 397,095 |
| Events in quadrant C | 3,774,505 | 437,146 |
| Events in quadrant D | 4,129,454 | 422,109 |
| Mode M9 | |||
|---|---|---|---|
| Quadrant | BADHDUFLAG | Total packets | Discarded packets |
| A | 0 | 14 | 0 |
| B | 0 | 14 | 0 |
| C | 0 | 14 | 0 |
| D | 0 | 14 | 0 |
| Mode M0 | |||
|---|---|---|---|
| Quadrant | BADHDUFLAG | Total packets | Discarded packets |
| A | 0 | 13603 | 1 |
| B | 0 | 23875 | 1 |
| C | 0 | 15147 | 1 |
| D | 0 | 16660 | 1 |
| Mode SS | |||
|---|---|---|---|
| Quadrant | BADHDUFLAG | Total packets | Discarded packets |
| A | 0 | 124 | 0 |
| B | 0 | 124 | 0 |
| C | 0 | 124 | 0 |
| D | 0 | 124 | 0 |
| Quadrant | Total seconds | Saturated seconds | Saturation percentage |
|---|---|---|---|
| A | 6097 | 51 | 0.836477% |
| B | 6098 | 749 | 12.282716% |
| C | 6098 | 212 | 3.476550% |
| D | 6098 | 63 | 1.033126% |
Noise dominated data is calculated using 1-second bins in cleaned event files. If a bin has >2000 counts, and if more than 50% of those come from <1% of pixels, then it is considered to be noise-dominated and hence unusable.
| Quadrant | # 1 sec bins | Bins with >0 counts | Bins with >2000 counts | High rate bins dominated by noise | Noise dominated (total time) | Noise dominated (detector-on time) | Marked lightcurve |
|---|---|---|---|---|---|---|---|
| A | 7462 | 6098 | 0 | 0 | 0.00% | 0.00% | 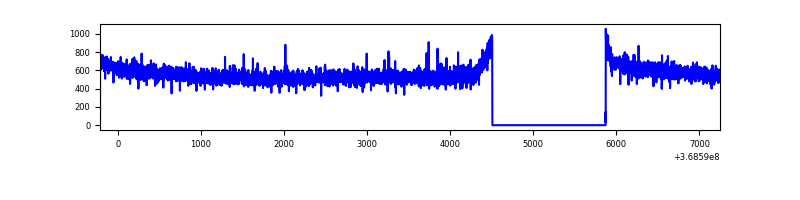 |
| B | 7463 | 6099 | 374 | 374 | 5.01% | 6.13% | 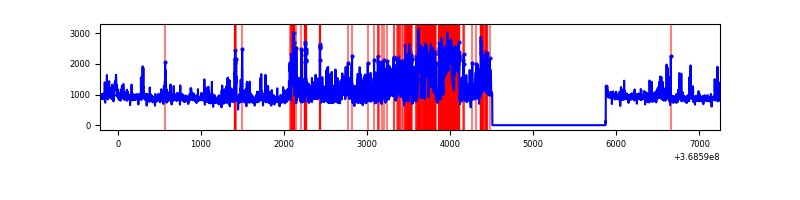 |
| C | 7463 | 6099 | 58 | 58 | 0.78% | 0.95% | 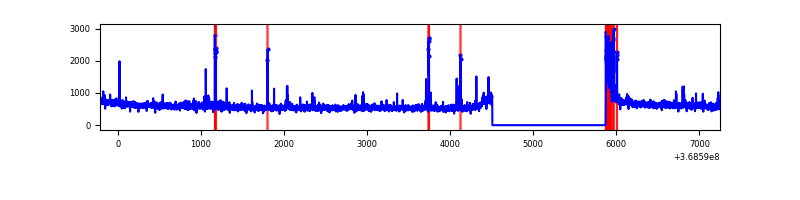 |
| D | 7463 | 6099 | 6 | 6 | 0.08% | 0.10% | 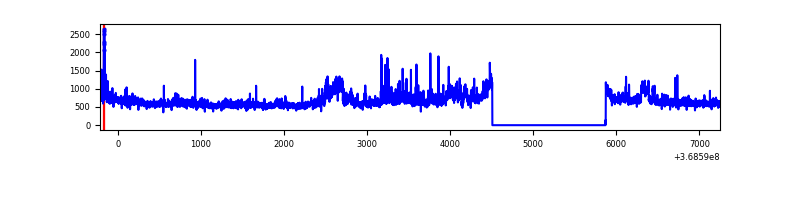 |
Top three noisy pixels from each quadrant. If the there are fewer than three noisy pixels in the level2.evt file, extra rows are filled as -1
| Pixel properties | Quadrant properties | ||||||
|---|---|---|---|---|---|---|---|
| Quadrant | DetID | PixID | Counts | Sigma | Mean | Median | Sigma |
| A | 13 | 6 | 14590 | 80.37 | 874 | 861 | 170.8 |
| A | 13 | 254 | 10866 | 58.57 | 874 | 861 | 170.8 |
| A | 3 | 137 | 7658 | 39.79 | 874 | 861 | 170.8 |
| B | 6 | 159 | 1596191 | 10360.9 | 836 | 820 | 154.0 |
| B | 10 | 245 | 985918 | 6397.57 | 836 | 820 | 154.0 |
| B | 12 | 18 | 526865 | 3416.32 | 836 | 820 | 154.0 |
| C | 0 | 10 | 243171 | 1260.39 | 846 | 853 | 192.3 |
| C | 14 | 238 | 146451 | 757.31 | 846 | 853 | 192.3 |
| C | 2 | 16 | 26906 | 135.51 | 846 | 853 | 192.3 |
| D | 8 | 195 | 808886 | 4099.3 | 853 | 832 | 197.1 |
| D | 2 | 250 | 39925 | 198.32 | 853 | 832 | 197.1 |
| D | 12 | 233 | 39274 | 195.02 | 853 | 832 | 197.1 |
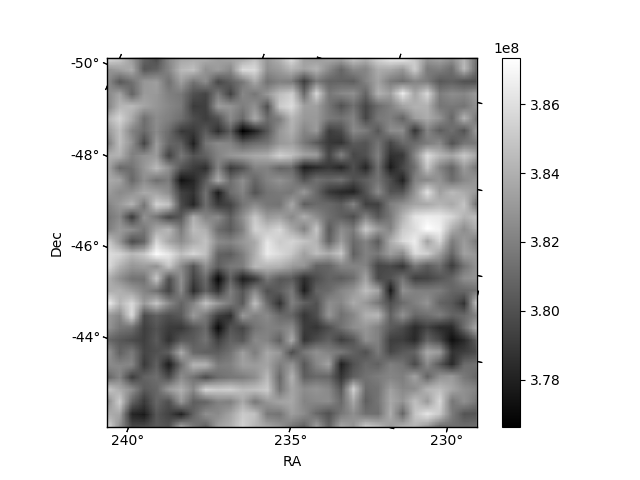
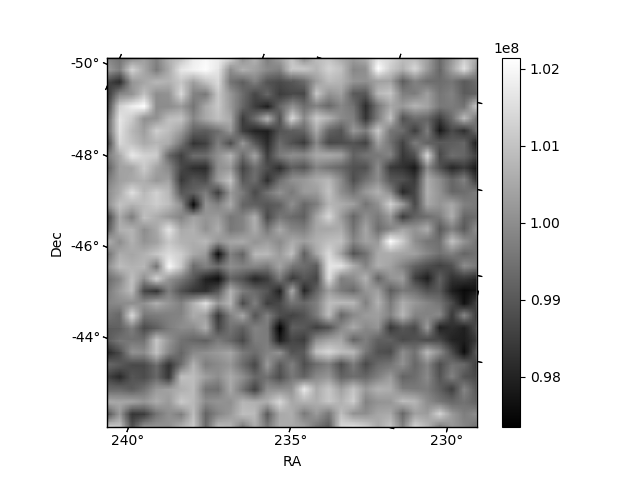
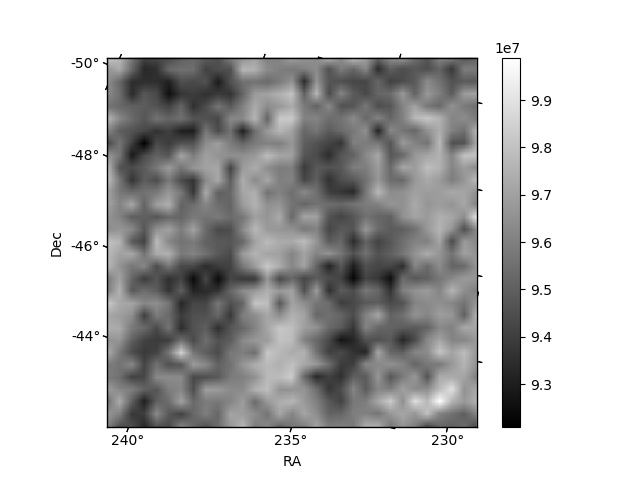
Histogram calculated using DETX and DETY for each event in the final _common_clean file
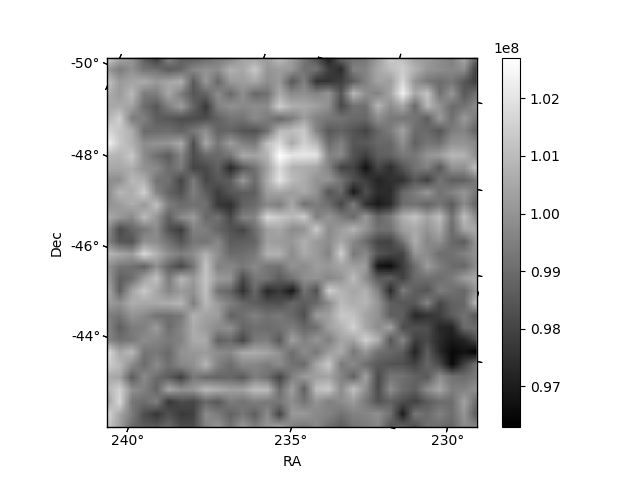
| Quadrant A | 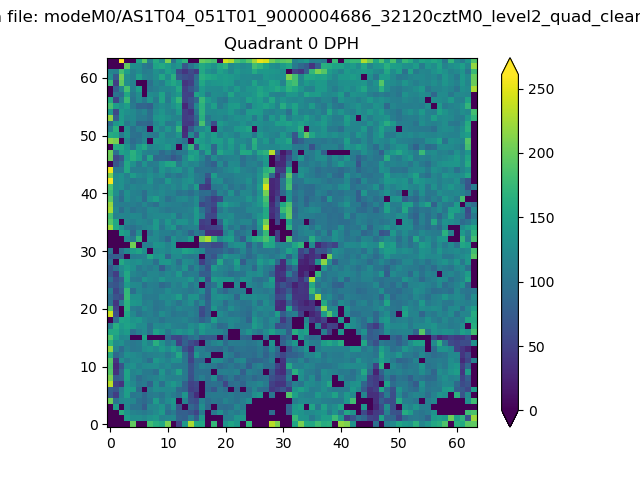 |
 |
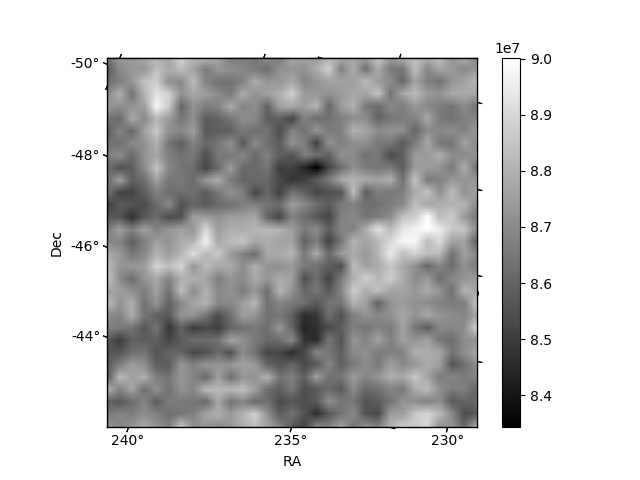
Quadrant B |
|---|---|---|---|
| Quadrant D | 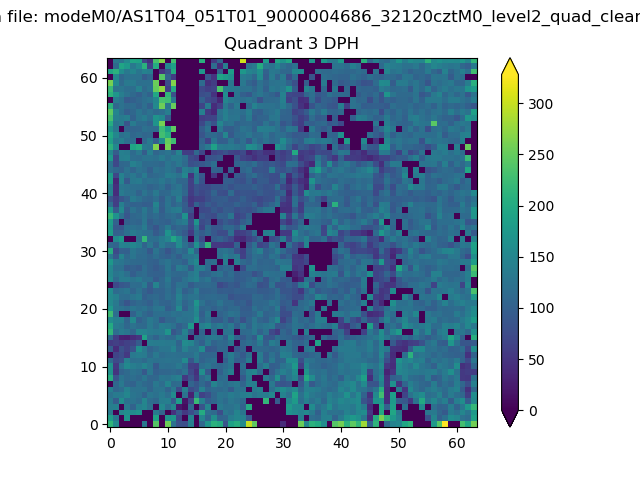 |
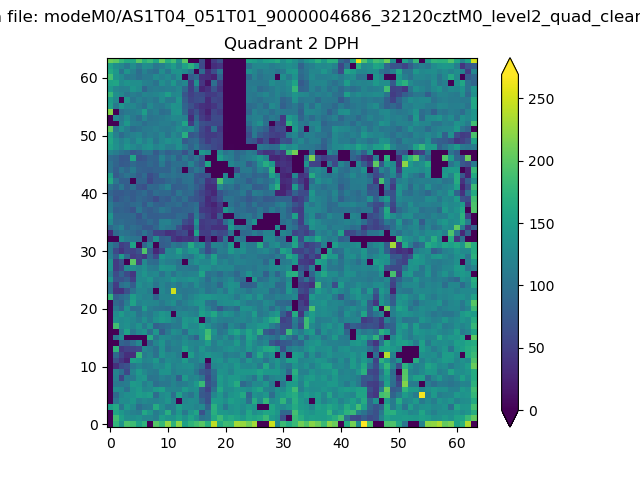 |
Quadrant C |
| Plot type | Count rate plots | Images |
|---|---|---|
| Comparison with Poisson distribution Blue bars denote a histogram of data divided into 1 sec bins. Red curve is a Poisson curve with rate = median count rate of data. |
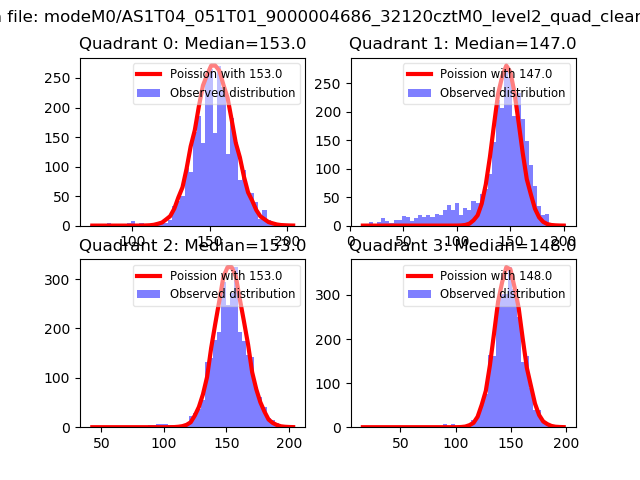 |
 |
| Quadrant-wise count rates Data is divided into 100 sec bins |
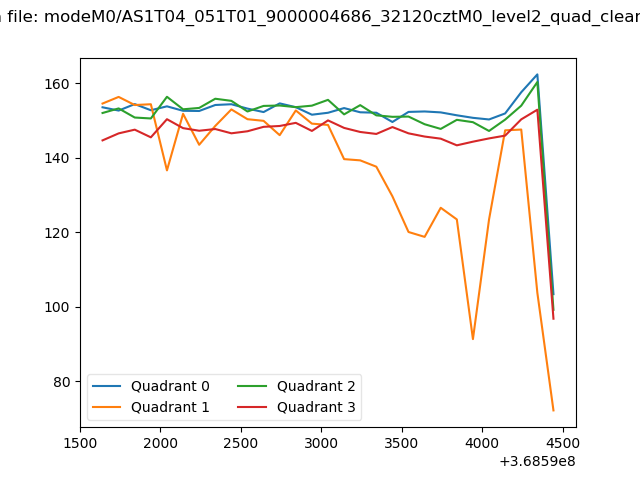 |
|
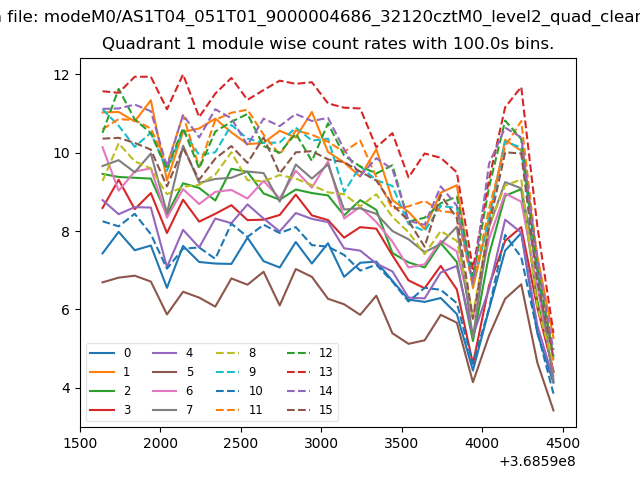
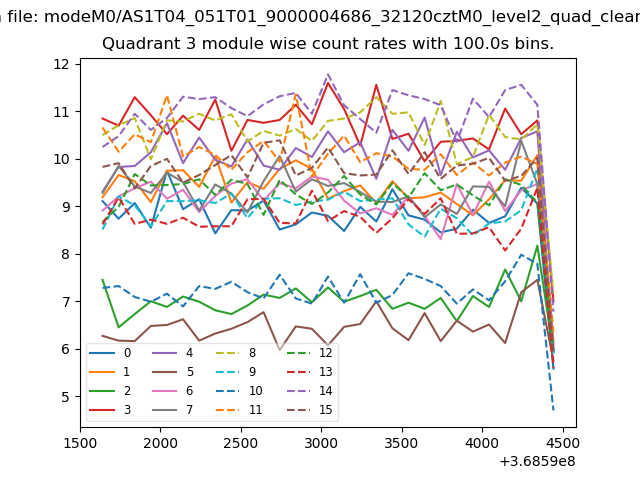
| Module-wise count rates for Quadrant A Data is divided into 100 sec bins |
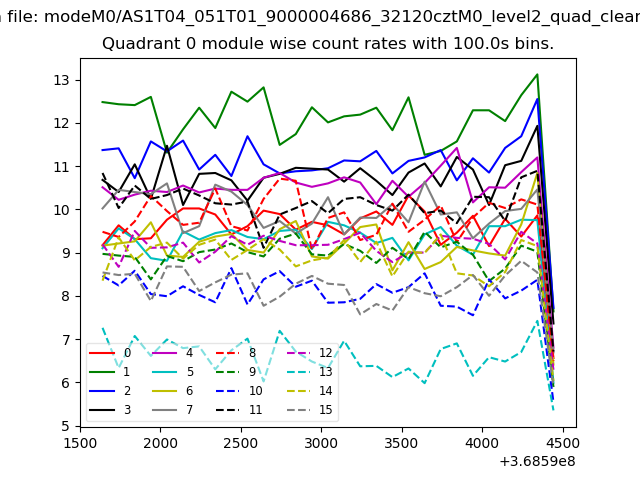 |
 |
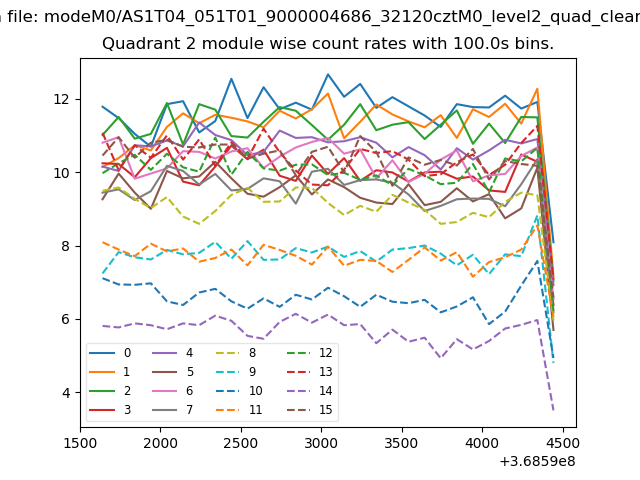
| Module-wise count rates for Quadrant B Data is divided into 100 sec bins |
 |
 |
| Module-wise count rates for Quadrant C Data is divided into 100 sec bins |
 |
 |
| Module-wise count rates for Quadrant D Data is divided into 100 sec bins |
 |
 |
| Parameter | Plot |
|---|---|
| CZT HV Monitor | 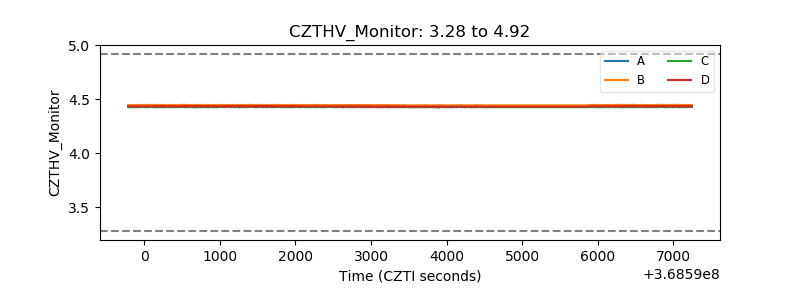 |
| D_VDD | 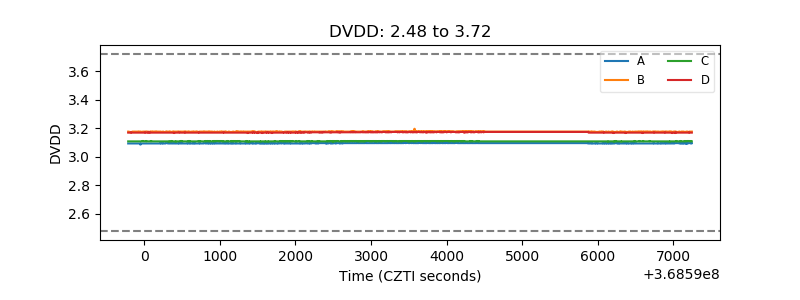 |
| Temperature 1 | 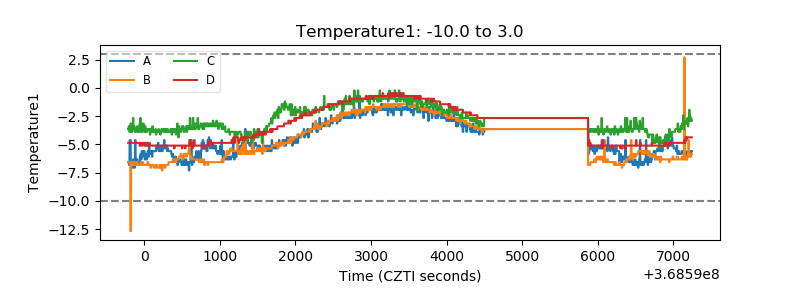 |
| Veto HV Monitor | 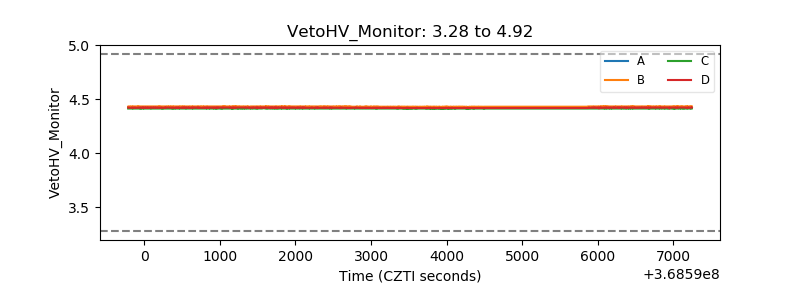 |
| Veto LLD | 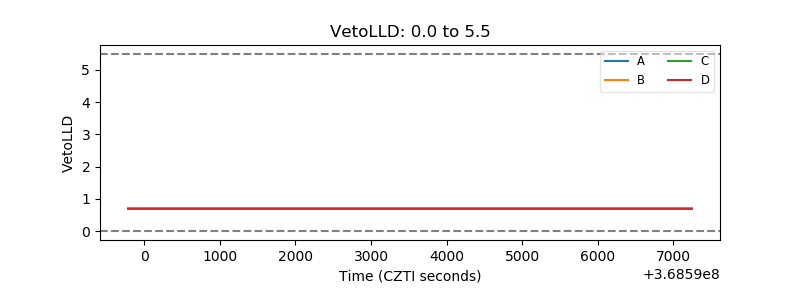 |
| Alpha Counter | 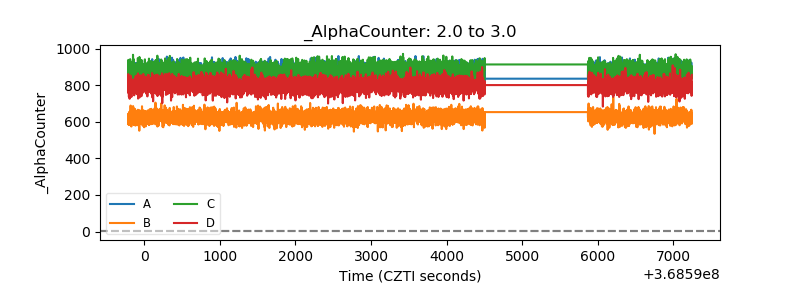 |
| _CPM_Rate | 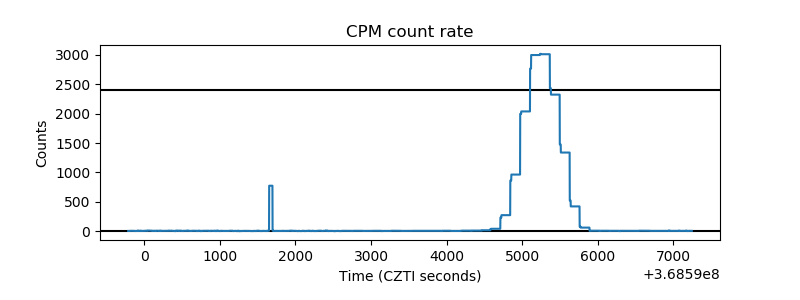 |
| CZT Counter | 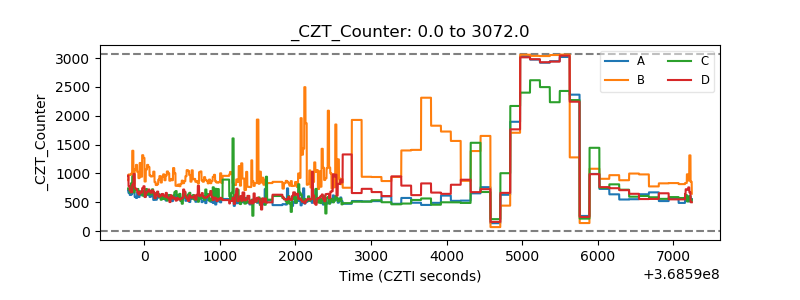 |
| +2.5 Volts monitor | 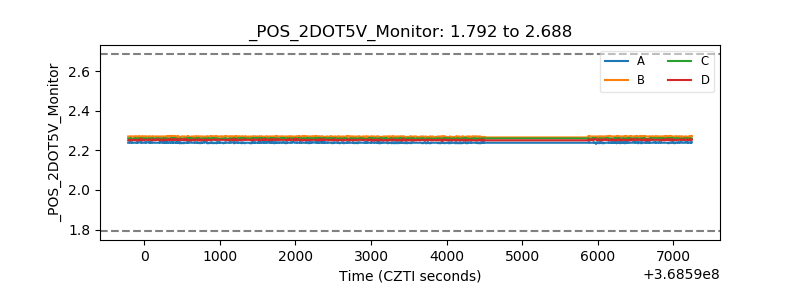 |
| +5 Volts monitor |  |
| _ROLL_ROT | 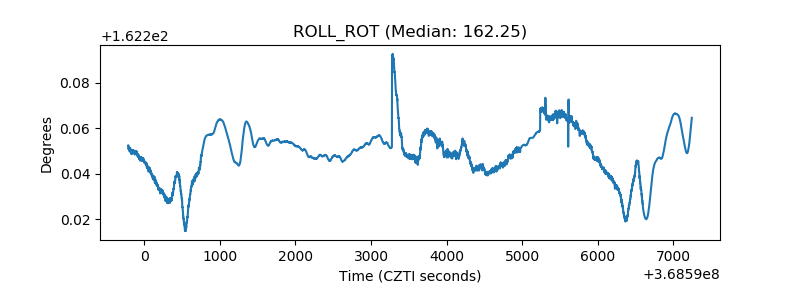 |
| _Roll_DEC | 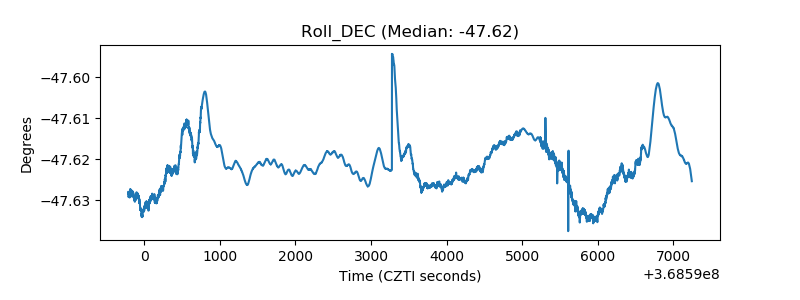 |
| _Roll_RA | 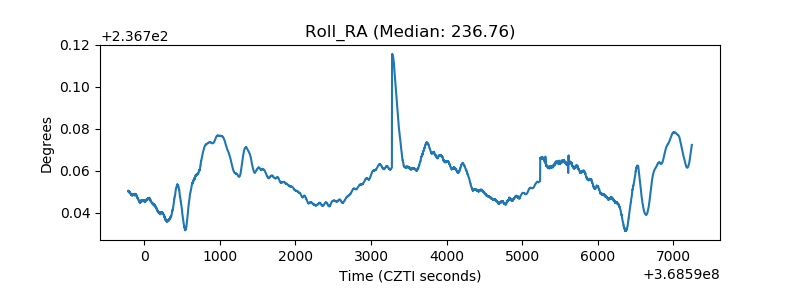 |
| Veto Counter | 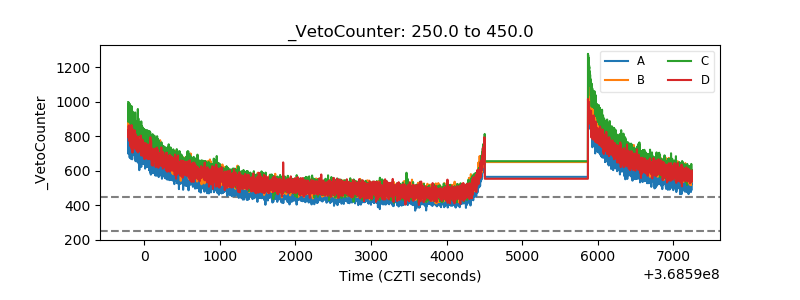 |