| Param | Original file | Final file |
|---|---|---|
| Filename | modeM0/AS1T04_051T01_9000004686_32123cztM0_level2.evt | modeM0/AS1T04_051T01_9000004686_32123cztM0_level2_quad_clean.evt |
| Size (bytes) | 307,033,920 | 58,518,720 |
| Size | 292.8 MB | 55.8 MB |
| Events in quadrant A | 1,721,473 | 390,272 |
| Events in quadrant B | 3,168,397 | 378,125 |
| Events in quadrant C | 1,861,427 | 387,415 |
| Events in quadrant D | 2,312,278 | 371,659 |
| Mode M0 | |||
|---|---|---|---|
| Quadrant | BADHDUFLAG | Total packets | Discarded packets |
| A | 0 | 7572 | 561 |
| B | 0 | 12975 | 1213 |
| C | 0 | 8086 | 607 |
| D | 0 | 10029 | 918 |
| Mode SS | |||
|---|---|---|---|
| Quadrant | BADHDUFLAG | Total packets | Discarded packets |
| A | 0 | 76 | 10 |
| B | 0 | 76 | 8 |
| C | 0 | 76 | 10 |
| D | 0 | 78 | 12 |
| Quadrant | Total seconds | Saturated seconds | Saturation percentage |
|---|---|---|---|
| A | 3460 | 5 | 0.144509% |
| B | 3448 | 177 | 5.133411% |
| C | 3469 | 33 | 0.951283% |
| D | 3450 | 17 | 0.492754% |
Noise dominated data is calculated using 1-second bins in cleaned event files. If a bin has >2000 counts, and if more than 50% of those come from <1% of pixels, then it is considered to be noise-dominated and hence unusable.
| Quadrant | # 1 sec bins | Bins with >0 counts | Bins with >2000 counts | High rate bins dominated by noise | Noise dominated (total time) | Noise dominated (detector-on time) | Marked lightcurve |
|---|---|---|---|---|---|---|---|
| A | 7498 | 3517 | 0 | 0 | 0.00% | 0.00% | 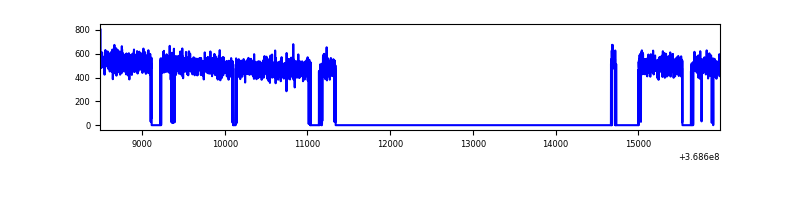 |
| B | 7498 | 3498 | 144 | 144 | 1.92% | 4.12% | 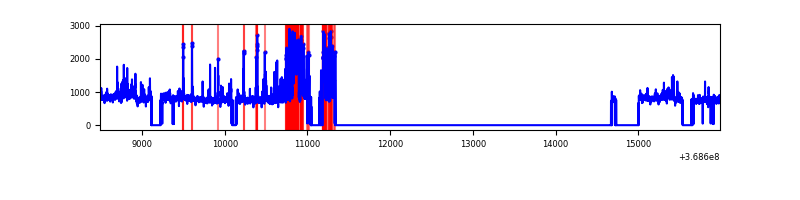 |
| C | 7498 | 3524 | 7 | 7 | 0.09% | 0.20% | 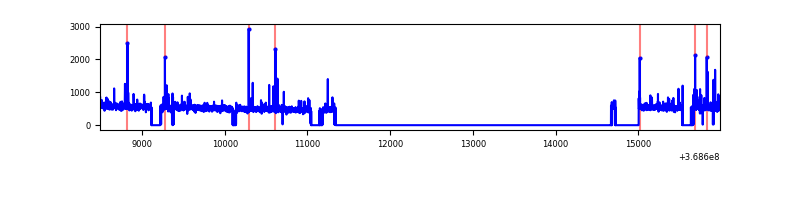 |
| D | 7497 | 3509 | 11 | 11 | 0.15% | 0.31% | 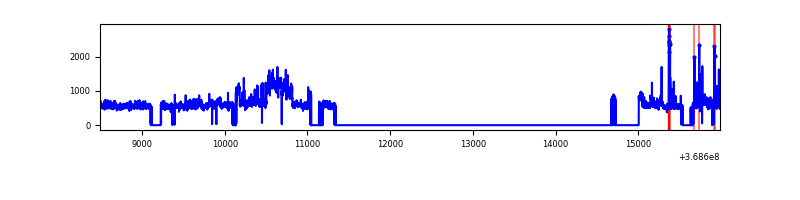 |
Top three noisy pixels from each quadrant. If the there are fewer than three noisy pixels in the level2.evt file, extra rows are filled as -1
| Pixel properties | Quadrant properties | ||||||
|---|---|---|---|---|---|---|---|
| Quadrant | DetID | PixID | Counts | Sigma | Mean | Median | Sigma |
| A | 13 | 6 | 7078 | 75.02 | 443 | 435 | 88.6 |
| A | 13 | 254 | 6748 | 71.29 | 443 | 435 | 88.6 |
| A | 3 | 137 | 4213 | 42.66 | 443 | 435 | 88.6 |
| B | 6 | 159 | 887164 | 10776.08 | 426 | 415 | 82.3 |
| B | 10 | 245 | 238685 | 2895.54 | 426 | 415 | 82.3 |
| B | 5 | 172 | 190041 | 2304.4 | 426 | 415 | 82.3 |
| C | 0 | 10 | 83467 | 822.84 | 431 | 433 | 100.9 |
| C | 14 | 238 | 73619 | 725.25 | 431 | 433 | 100.9 |
| C | 2 | 114 | 7867 | 73.67 | 431 | 433 | 100.9 |
| D | 8 | 195 | 589788 | 5730.9 | 433 | 422 | 102.8 |
| D | 12 | 233 | 48575 | 468.23 | 433 | 422 | 102.8 |
| D | 2 | 234 | 17661 | 167.63 | 433 | 422 | 102.8 |
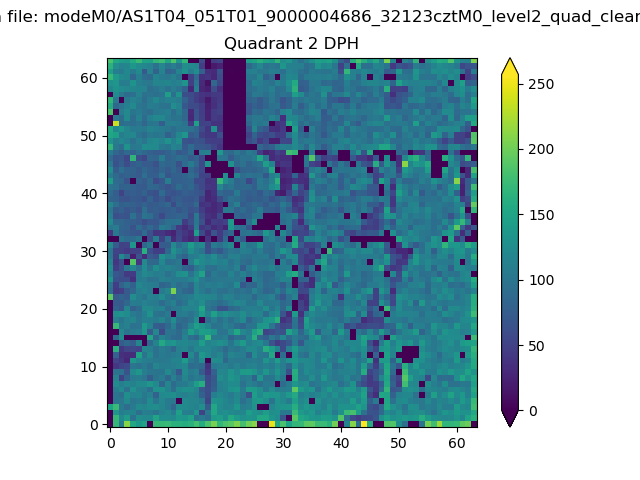
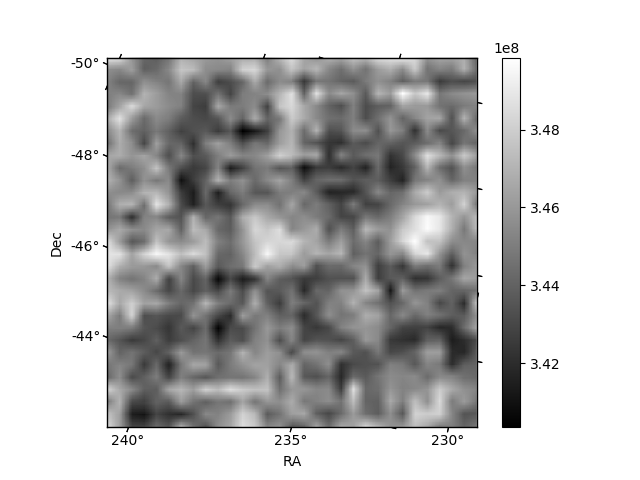
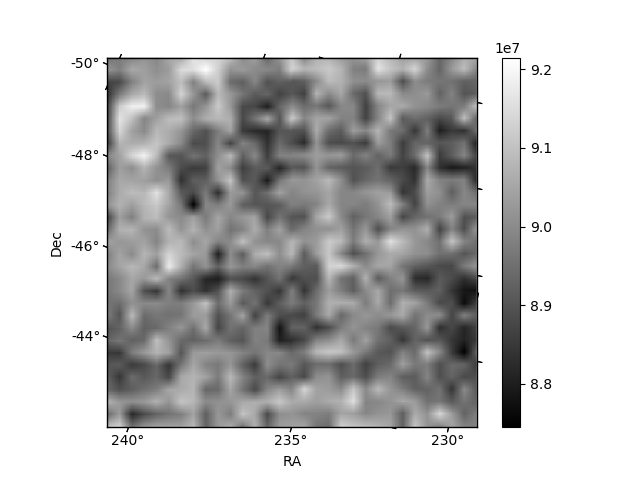
Histogram calculated using DETX and DETY for each event in the final _common_clean file
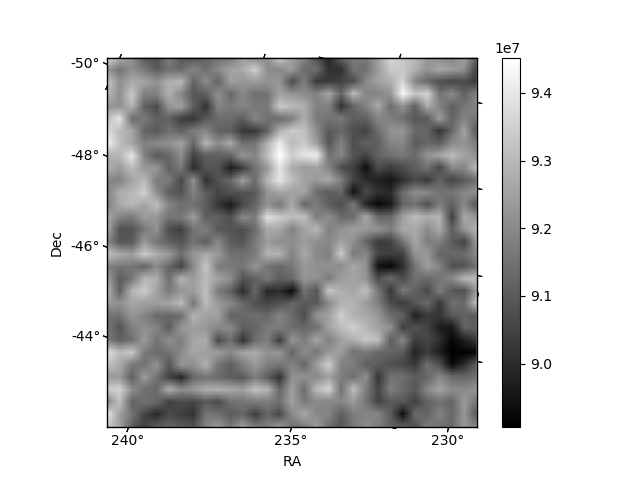
| Quadrant A | 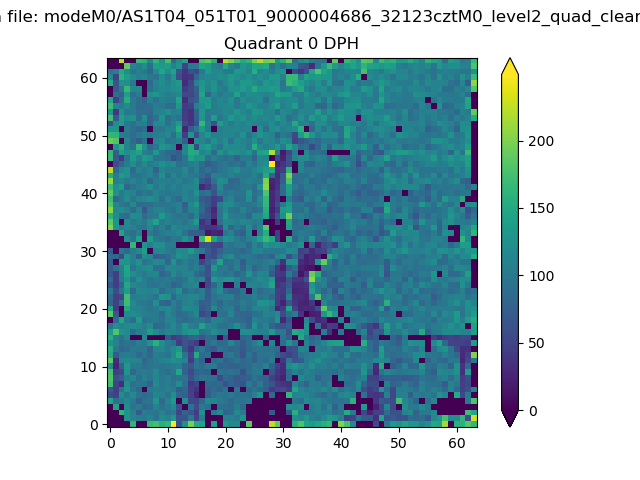 |
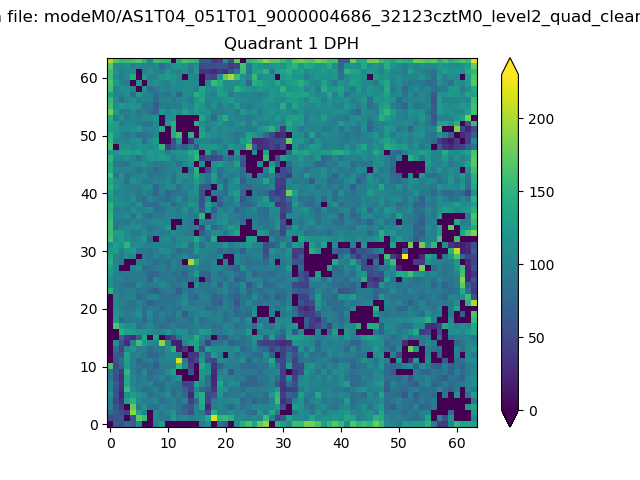 |
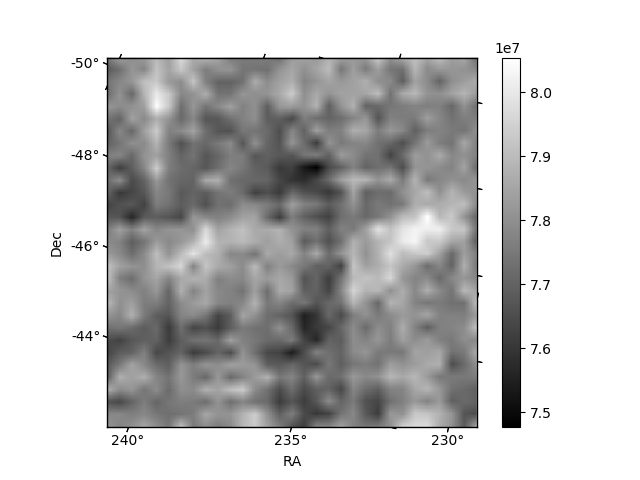
Quadrant B |
|---|---|---|---|
| Quadrant D | 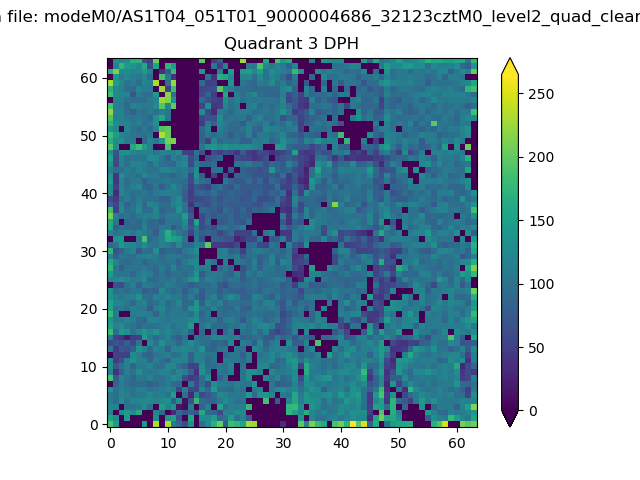 |
 |
Quadrant C |
| Plot type | Count rate plots | Images |
|---|---|---|
| Comparison with Poisson distribution Blue bars denote a histogram of data divided into 1 sec bins. Red curve is a Poisson curve with rate = median count rate of data. |
 |
 |
| Quadrant-wise count rates Data is divided into 100 sec bins |
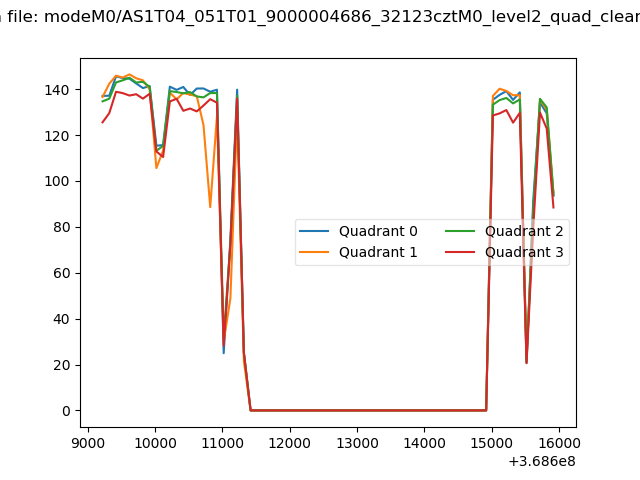 |
|
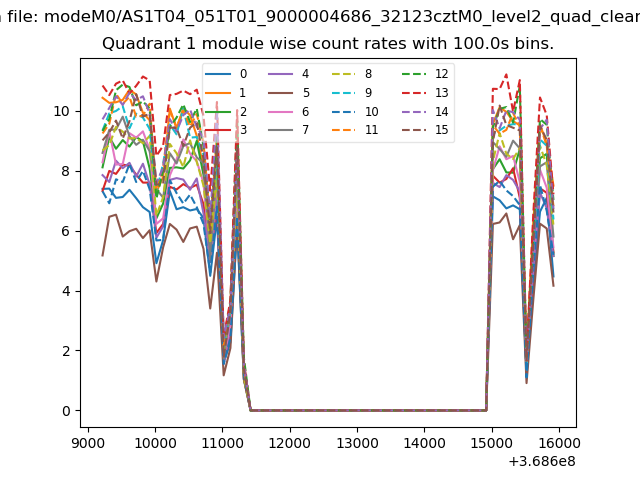
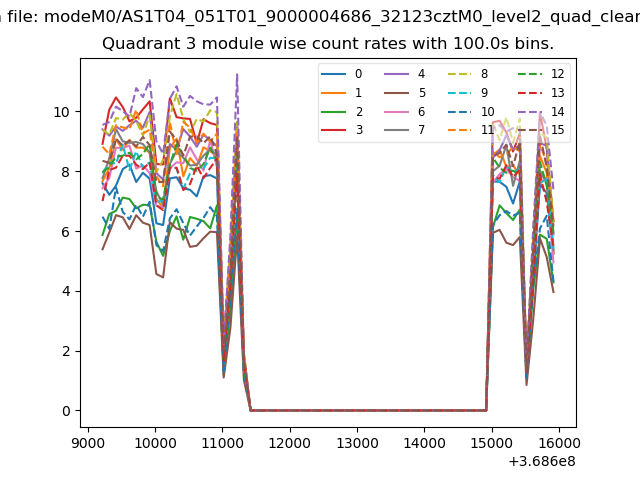
| Module-wise count rates for Quadrant A Data is divided into 100 sec bins |
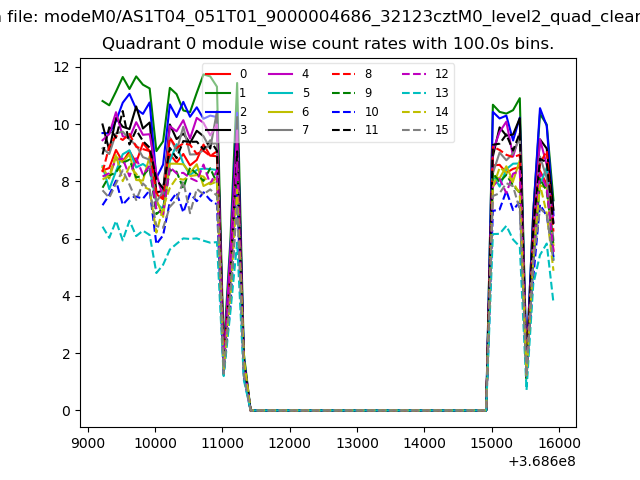 |
 |
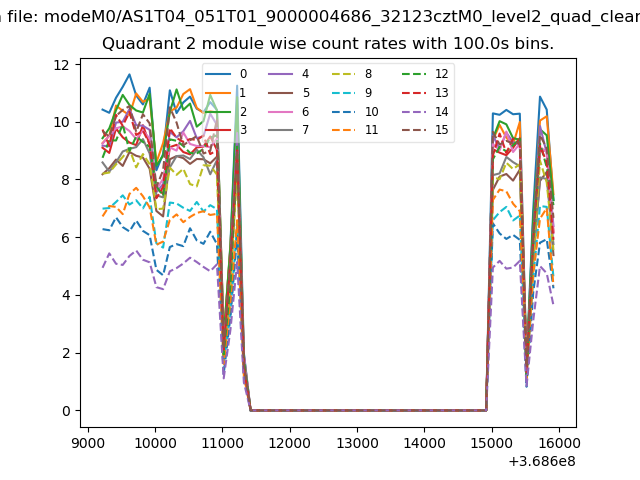
| Module-wise count rates for Quadrant B Data is divided into 100 sec bins |
 |
 |
| Module-wise count rates for Quadrant C Data is divided into 100 sec bins |
 |
 |
| Module-wise count rates for Quadrant D Data is divided into 100 sec bins |
 |
 |
| Parameter | Plot |
|---|---|
| CZT HV Monitor | 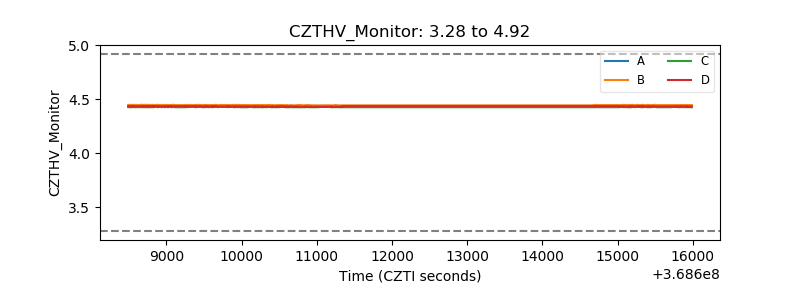 |
| D_VDD | 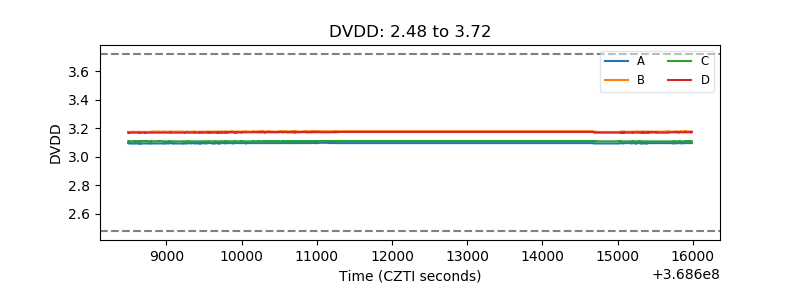 |
| Temperature 1 | 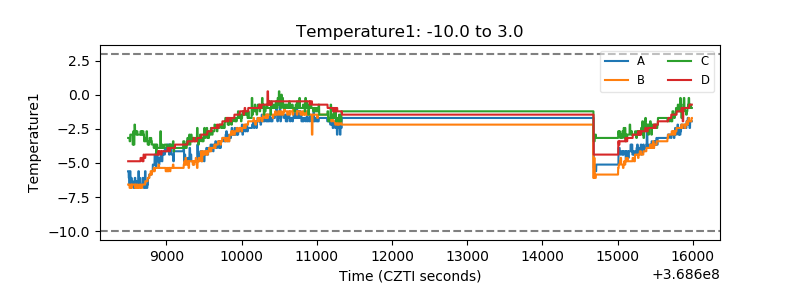 |
| Veto HV Monitor | 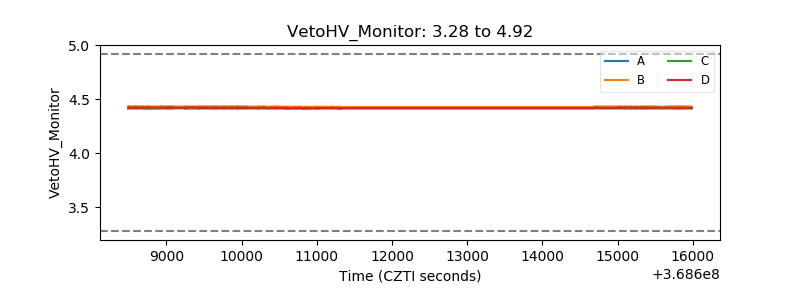 |
| Veto LLD | 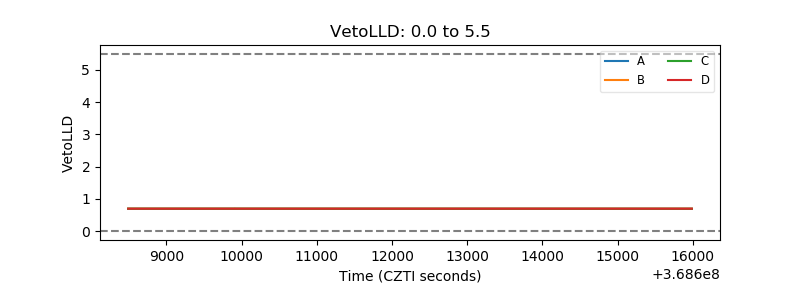 |
| Alpha Counter | 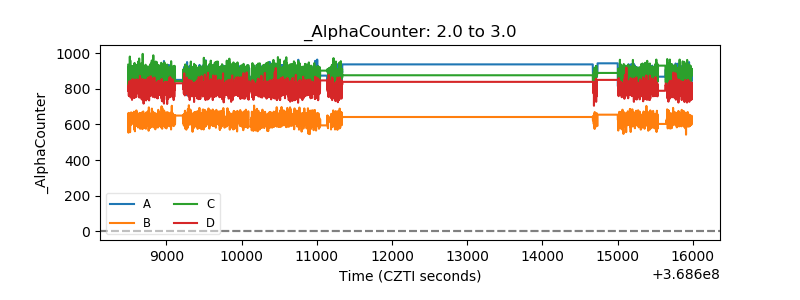 |
| _CPM_Rate | 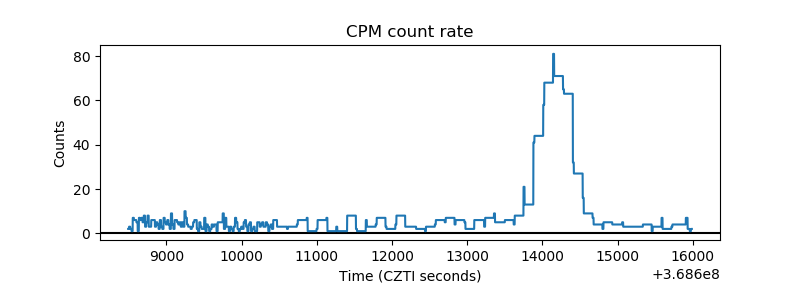 |
| CZT Counter | 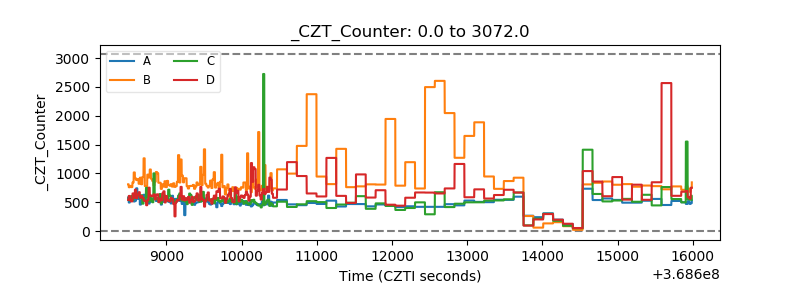 |
| +2.5 Volts monitor |  |
| +5 Volts monitor |  |
| _ROLL_ROT | 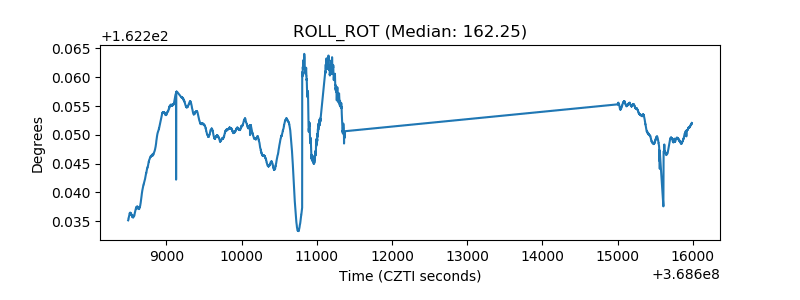 |
| _Roll_DEC | 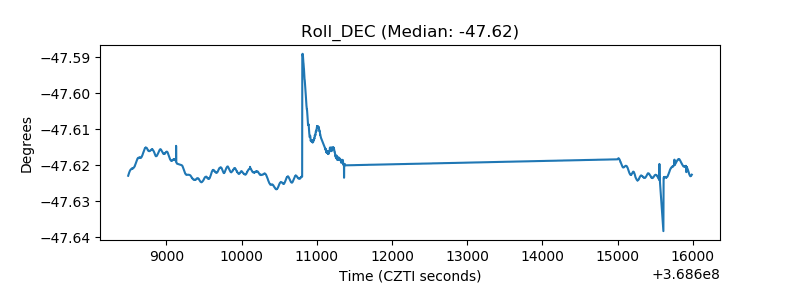 |
| _Roll_RA | 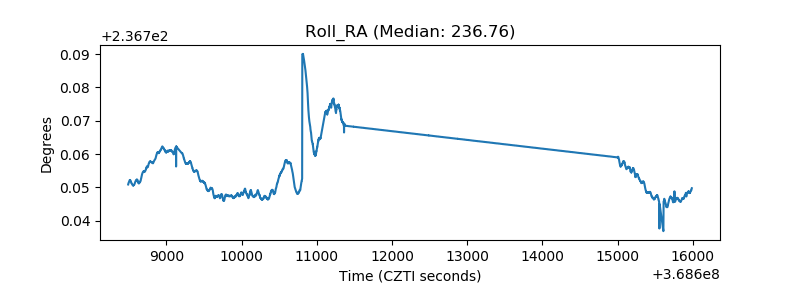 |
| Veto Counter | 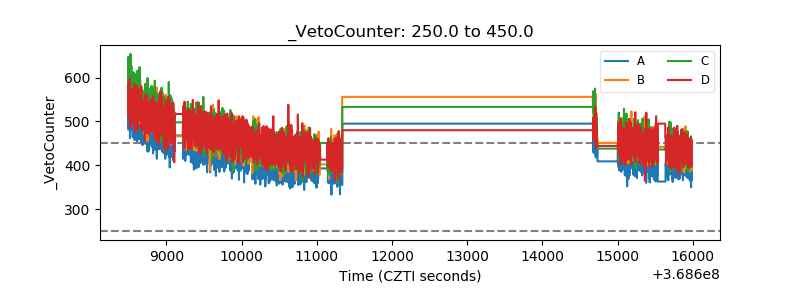 |