| Param | Original file | Final file |
|---|---|---|
| Filename | modeM0/AS1T04_051T01_9000004686_32124cztM0_level2.evt | modeM0/AS1T04_051T01_9000004686_32124cztM0_level2_quad_clean.evt |
| Size (bytes) | 469,105,920 | 70,479,360 |
| Size | 447.4 MB | 67.2 MB |
| Events in quadrant A | 2,564,944 | 460,655 |
| Events in quadrant B | 4,587,862 | 435,610 |
| Events in quadrant C | 2,705,238 | 451,886 |
| Events in quadrant D | 3,999,814 | 425,470 |
| Mode M9 | |||
|---|---|---|---|
| Quadrant | BADHDUFLAG | Total packets | Discarded packets |
| A | 0 | 2 | 0 |
| B | 0 | 2 | 0 |
| C | 0 | 2 | 0 |
| D | 0 | 2 | 0 |
| Mode M0 | |||
|---|---|---|---|
| Quadrant | BADHDUFLAG | Total packets | Discarded packets |
| A | 0 | 11639 | 794 |
| B | 0 | 18948 | 1727 |
| C | 0 | 12096 | 891 |
| D | 0 | 16889 | 1310 |
| Mode SS | |||
|---|---|---|---|
| Quadrant | BADHDUFLAG | Total packets | Discarded packets |
| A | 0 | 116 | 12 |
| B | 0 | 116 | 12 |
| C | 0 | 117 | 15 |
| D | 0 | 116 | 16 |
| Quadrant | Total seconds | Saturated seconds | Saturation percentage |
|---|---|---|---|
| A | 5187 | 168 | 3.238866% |
| B | 5101 | 438 | 8.586552% |
| C | 5179 | 224 | 4.325159% |
| D | 5132 | 223 | 4.345284% |
Noise dominated data is calculated using 1-second bins in cleaned event files. If a bin has >2000 counts, and if more than 50% of those come from <1% of pixels, then it is considered to be noise-dominated and hence unusable.
| Quadrant | # 1 sec bins | Bins with >0 counts | Bins with >2000 counts | High rate bins dominated by noise | Noise dominated (total time) | Noise dominated (detector-on time) | Marked lightcurve |
|---|---|---|---|---|---|---|---|
| A | 5859 | 5287 | 0 | 0 | 0.00% | 0.00% | 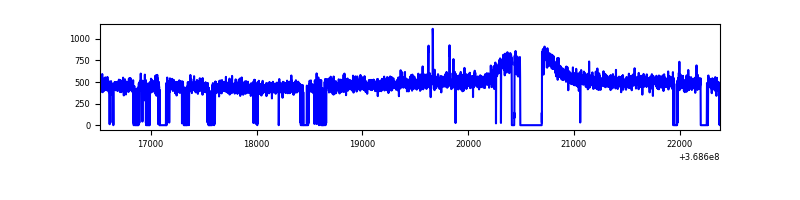 |
| B | 5856 | 5204 | 132 | 132 | 2.25% | 2.54% | 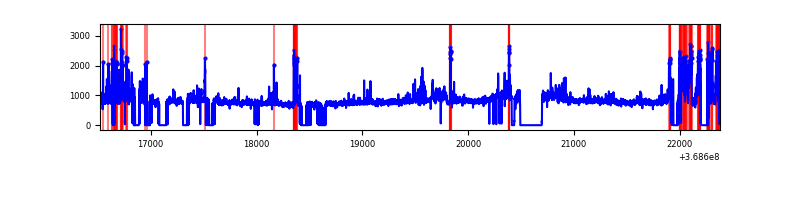 |
| C | 5857 | 5263 | 9 | 9 | 0.15% | 0.17% | 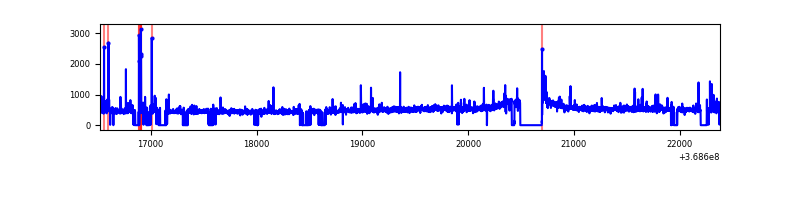 |
| D | 5855 | 5233 | 66 | 66 | 1.13% | 1.26% | 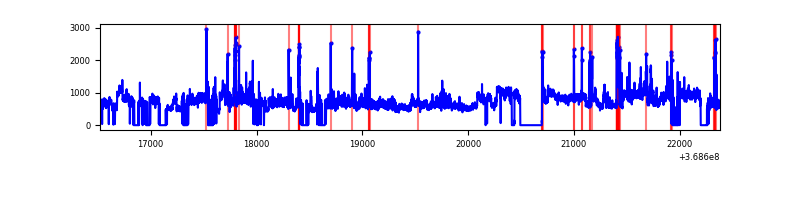 |
Top three noisy pixels from each quadrant. If the there are fewer than three noisy pixels in the level2.evt file, extra rows are filled as -1
| Pixel properties | Quadrant properties | ||||||
|---|---|---|---|---|---|---|---|
| Quadrant | DetID | PixID | Counts | Sigma | Mean | Median | Sigma |
| A | 13 | 6 | 14098 | 100.7 | 659 | 644 | 133.6 |
| A | 13 | 254 | 10211 | 71.61 | 659 | 644 | 133.6 |
| A | 15 | 174 | 8430 | 58.28 | 659 | 644 | 133.6 |
| B | 6 | 159 | 1378449 | 11418.85 | 627 | 610 | 120.7 |
| B | 10 | 245 | 443557 | 3670.93 | 627 | 610 | 120.7 |
| B | 5 | 172 | 133173 | 1098.62 | 627 | 610 | 120.7 |
| C | 14 | 238 | 107972 | 736.69 | 627 | 632 | 145.7 |
| C | 0 | 10 | 104162 | 710.54 | 627 | 632 | 145.7 |
| C | 2 | 114 | 12150 | 79.05 | 627 | 632 | 145.7 |
| D | 8 | 195 | 1273481 | 8554.16 | 627 | 609 | 148.8 |
| D | 12 | 233 | 247653 | 1660.22 | 627 | 609 | 148.8 |
| D | 10 | 199 | 35126 | 231.97 | 627 | 609 | 148.8 |
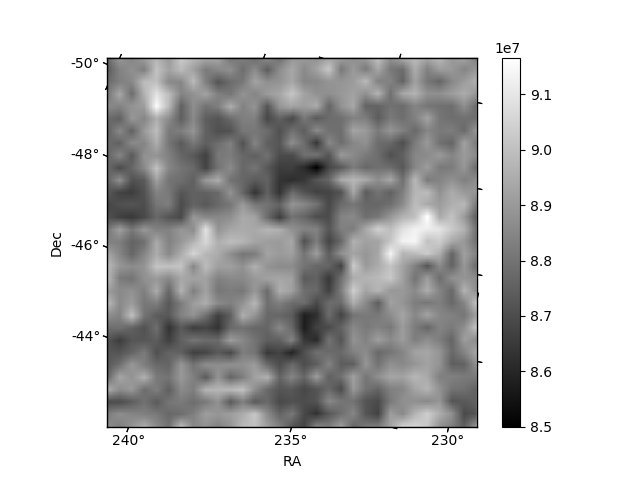
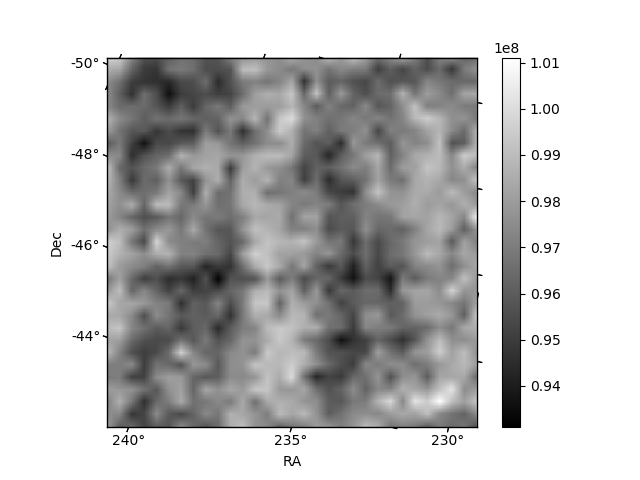
Histogram calculated using DETX and DETY for each event in the final _common_clean file
| Quadrant A |  |
 |
Quadrant B |
|---|---|---|---|
| Quadrant D |  |
 |
Quadrant C |
| Plot type | Count rate plots | Images |
|---|---|---|
| Comparison with Poisson distribution Blue bars denote a histogram of data divided into 1 sec bins. Red curve is a Poisson curve with rate = median count rate of data. |
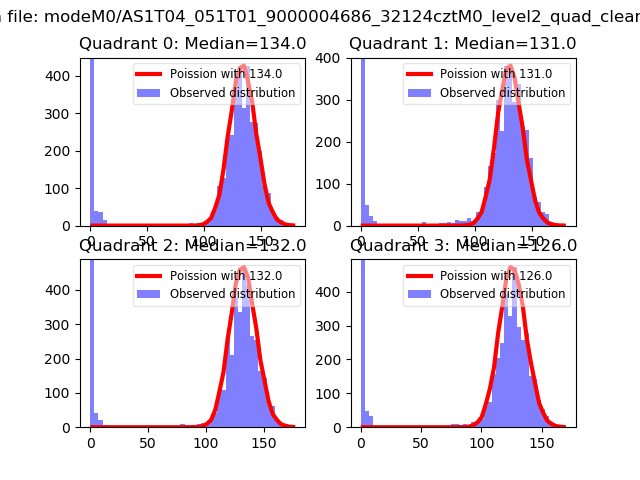 |
 |
| Quadrant-wise count rates Data is divided into 100 sec bins |
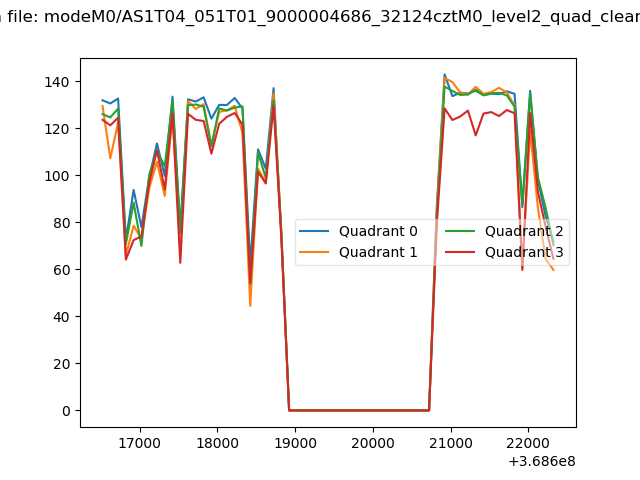 |
|
| Module-wise count rates for Quadrant A Data is divided into 100 sec bins |
 |
 |
| Module-wise count rates for Quadrant B Data is divided into 100 sec bins |
 |
 |
| Module-wise count rates for Quadrant C Data is divided into 100 sec bins |
 |
 |
| Module-wise count rates for Quadrant D Data is divided into 100 sec bins |
 |
 |
| Parameter | Plot |
|---|---|
| CZT HV Monitor |  |
| D_VDD |  |
| Temperature 1 |  |
| Veto HV Monitor |  |
| Veto LLD |  |
| Alpha Counter | 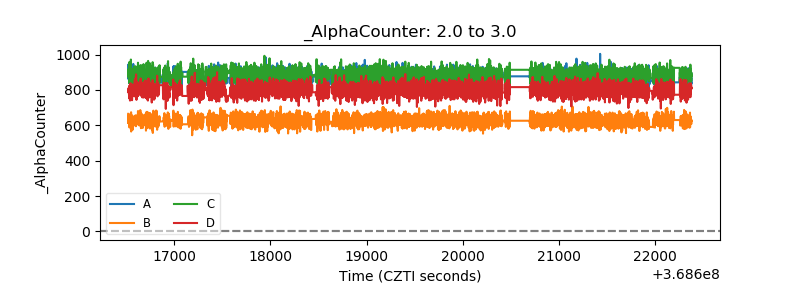 |
| _CPM_Rate | 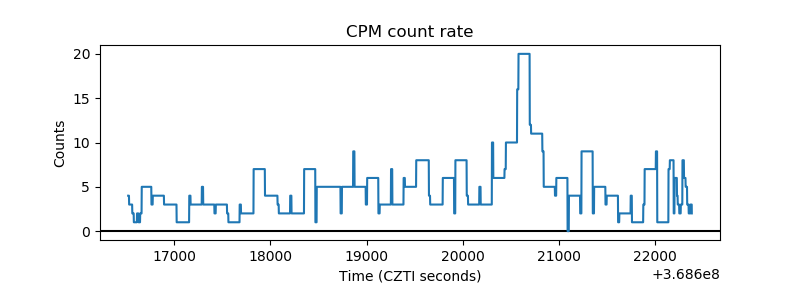 |
| CZT Counter |  |
| +2.5 Volts monitor |  |
| +5 Volts monitor |  |
| _ROLL_ROT |  |
| _Roll_DEC |  |
| _Roll_RA |  |
| Veto Counter |  |