| Param | Original file | Final file |
|---|---|---|
| Filename | modeM0/AS1T04_051T01_9000004686_32125cztM0_level2.evt | modeM0/AS1T04_051T01_9000004686_32125cztM0_level2_quad_clean.evt |
| Size (bytes) | 750,136,320 | 113,469,120 |
| Size | 715.4 MB | 108.2 MB |
| Events in quadrant A | 3,729,199 | 752,105 |
| Events in quadrant B | 8,450,323 | 706,564 |
| Events in quadrant C | 3,998,959 | 736,931 |
| Events in quadrant D | 6,024,753 | 710,109 |
| Mode M0 | |||
|---|---|---|---|
| Quadrant | BADHDUFLAG | Total packets | Discarded packets |
| A | 0 | 15796 | 0 |
| B | 0 | 30540 | 0 |
| C | 0 | 16578 | 0 |
| D | 0 | 23314 | 0 |
| Mode SS | |||
|---|---|---|---|
| Quadrant | BADHDUFLAG | Total packets | Discarded packets |
| A | 0 | 152 | 0 |
| B | 0 | 152 | 0 |
| C | 0 | 152 | 0 |
| D | 0 | 152 | 0 |
| Quadrant | Total seconds | Saturated seconds | Saturation percentage |
|---|---|---|---|
| A | 7622 | 130 | 1.705589% |
| B | 7623 | 1219 | 15.991080% |
| C | 7623 | 245 | 3.213958% |
| D | 7623 | 207 | 2.715466% |
Noise dominated data is calculated using 1-second bins in cleaned event files. If a bin has >2000 counts, and if more than 50% of those come from <1% of pixels, then it is considered to be noise-dominated and hence unusable.
| Quadrant | # 1 sec bins | Bins with >0 counts | Bins with >2000 counts | High rate bins dominated by noise | Noise dominated (total time) | Noise dominated (detector-on time) | Marked lightcurve |
|---|---|---|---|---|---|---|---|
| A | 7622 | 7622 | 0 | 0 | 0.00% | 0.00% |  |
| B | 7623 | 7623 | 666 | 666 | 8.74% | 8.74% |  |
| C | 7623 | 7623 | 1 | 1 | 0.01% | 0.01% |  |
| D | 7623 | 7623 | 89 | 89 | 1.17% | 1.17% |  |
Top three noisy pixels from each quadrant. If the there are fewer than three noisy pixels in the level2.evt file, extra rows are filled as -1
| Pixel properties | Quadrant properties | ||||||
|---|---|---|---|---|---|---|---|
| Quadrant | DetID | PixID | Counts | Sigma | Mean | Median | Sigma |
| A | 13 | 6 | 17896 | 87.44 | 961 | 939 | 193.9 |
| A | 13 | 254 | 15248 | 73.78 | 961 | 939 | 193.9 |
| A | 3 | 137 | 9849 | 45.94 | 961 | 939 | 193.9 |
| B | 10 | 245 | 2312654 | 13179.99 | 914 | 890 | 175.4 |
| B | 6 | 159 | 2055630 | 11714.63 | 914 | 890 | 175.4 |
| B | 5 | 172 | 269531 | 1531.59 | 914 | 890 | 175.4 |
| C | 0 | 10 | 197617 | 913.89 | 914 | 919 | 215.2 |
| C | 14 | 238 | 168386 | 778.08 | 914 | 919 | 215.2 |
| C | 14 | 254 | 29159 | 131.21 | 914 | 919 | 215.2 |
| D | 8 | 195 | 1845305 | 8326.33 | 927 | 900 | 221.5 |
| D | 12 | 233 | 293072 | 1318.97 | 927 | 900 | 221.5 |
| D | 10 | 199 | 166119 | 745.86 | 927 | 900 | 221.5 |
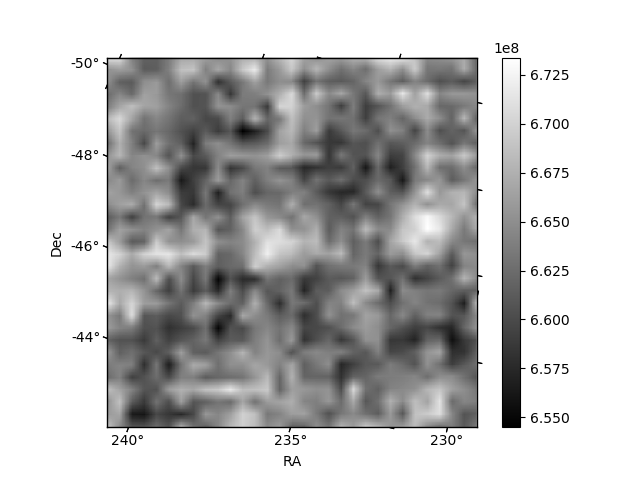
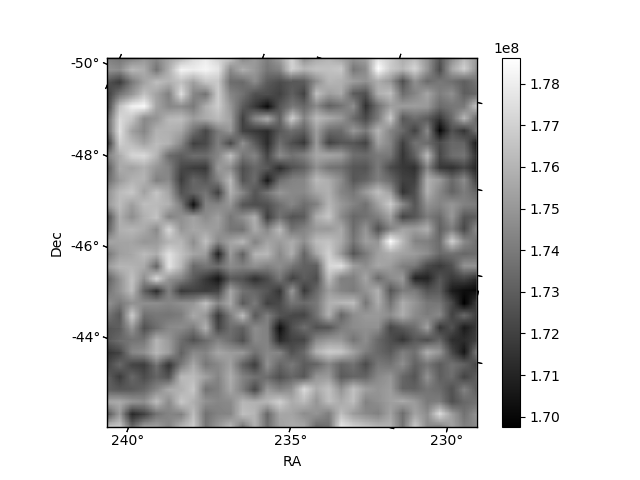
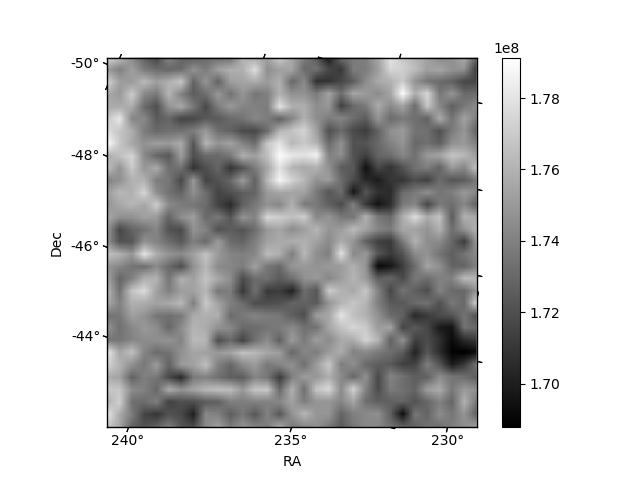
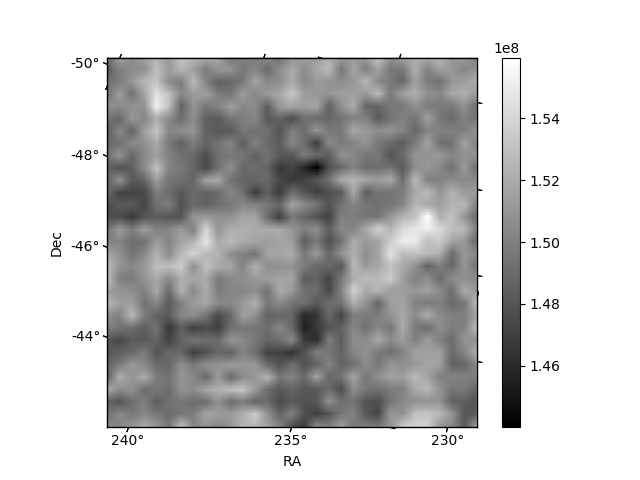
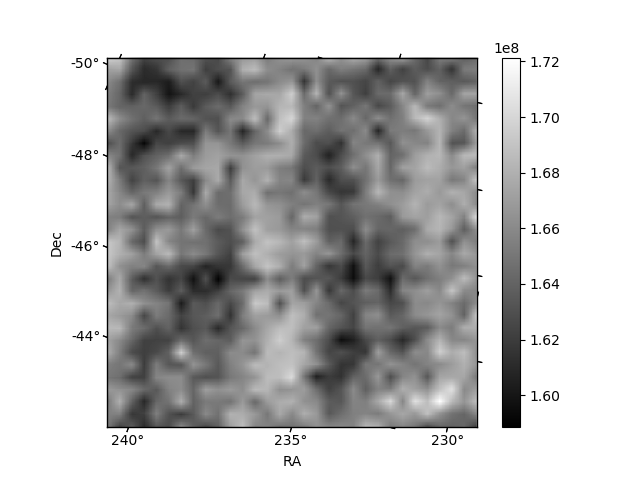
Histogram calculated using DETX and DETY for each event in the final _common_clean file
| Quadrant A | 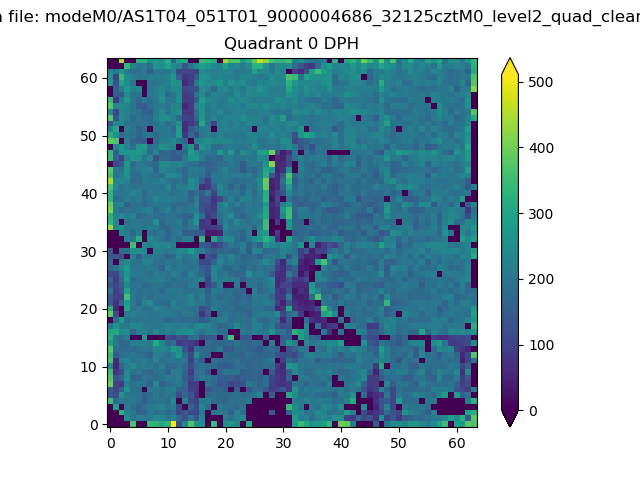 |
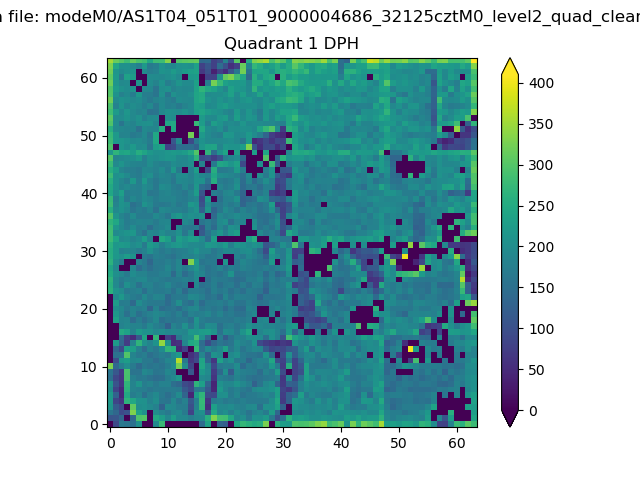 |
Quadrant B |
|---|---|---|---|
| Quadrant D | 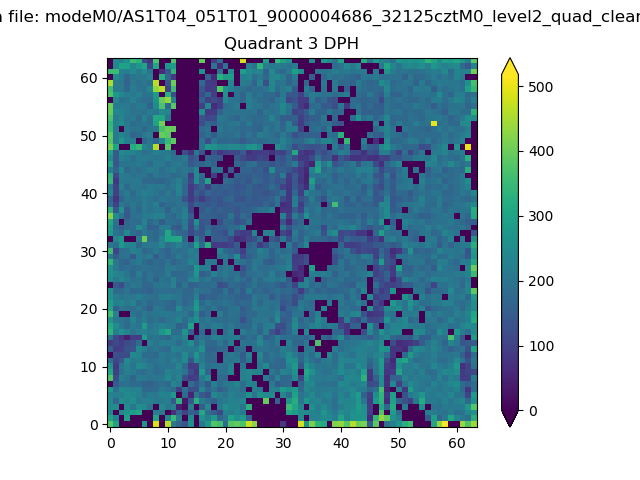 |
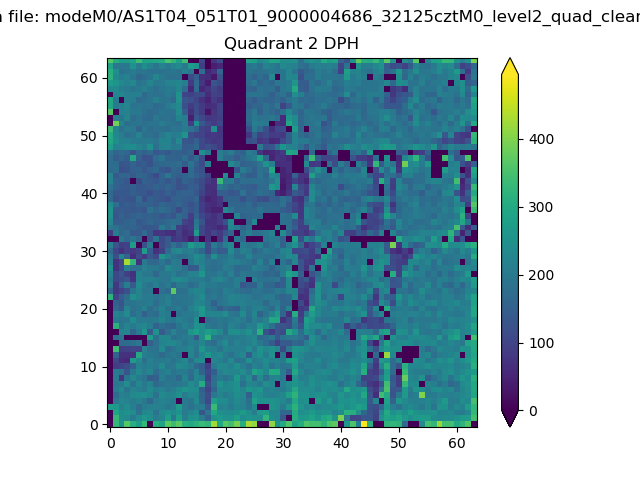 |
Quadrant C |
| Plot type | Count rate plots | Images |
|---|---|---|
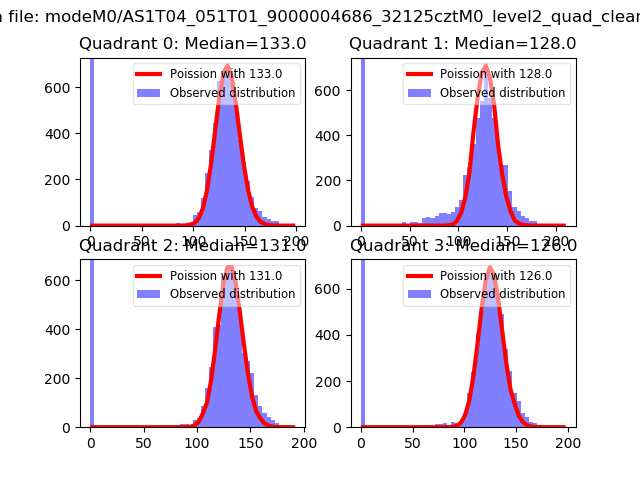
| Comparison with Poisson distribution Blue bars denote a histogram of data divided into 1 sec bins. Red curve is a Poisson curve with rate = median count rate of data. |
 |
 |
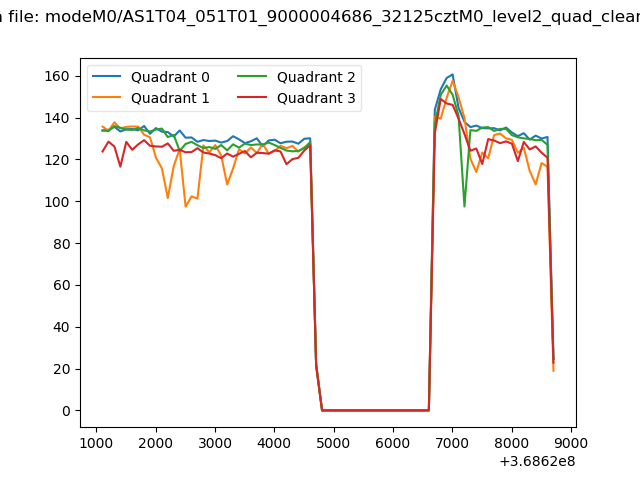
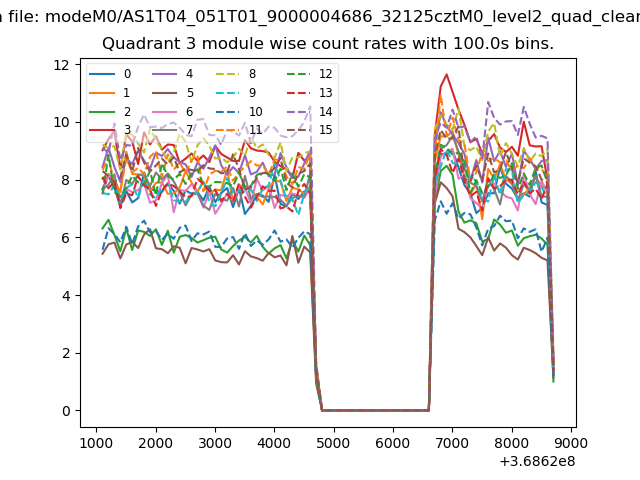
| Quadrant-wise count rates Data is divided into 100 sec bins |
 |
|
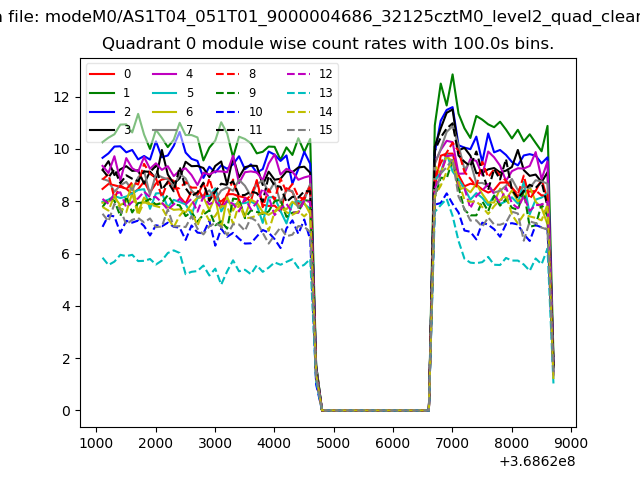
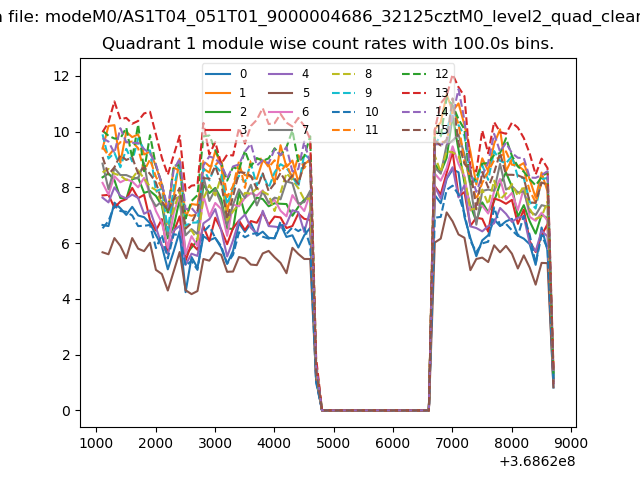
| Module-wise count rates for Quadrant A Data is divided into 100 sec bins |
 |
 |
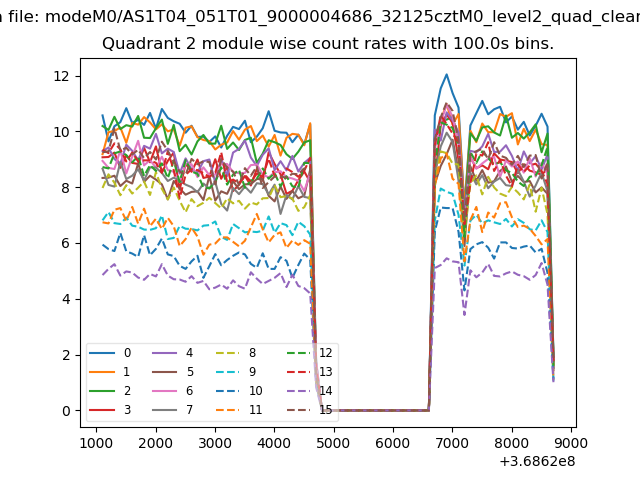
| Module-wise count rates for Quadrant B Data is divided into 100 sec bins |
 |
 |
| Module-wise count rates for Quadrant C Data is divided into 100 sec bins |
 |
 |
| Module-wise count rates for Quadrant D Data is divided into 100 sec bins |
 |
 |
| Parameter | Plot |
|---|---|
| CZT HV Monitor | 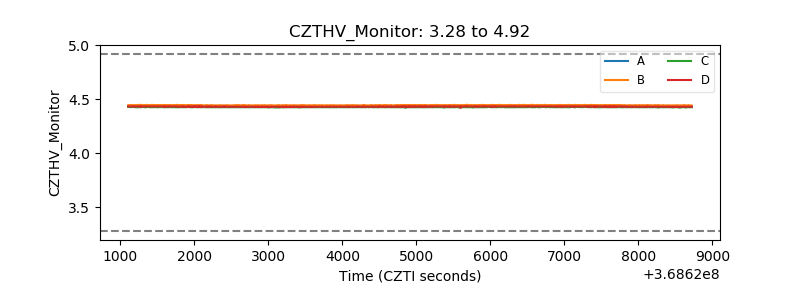 |
| D_VDD | 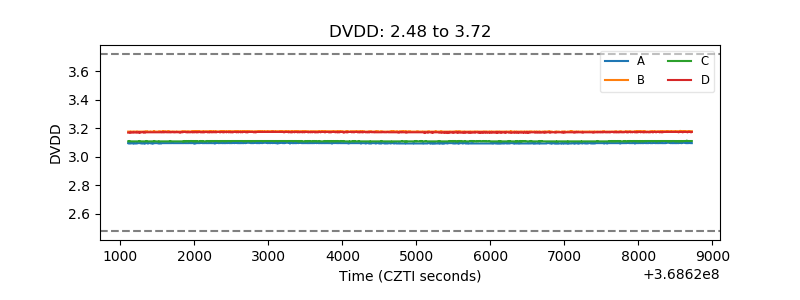 |
| Temperature 1 | 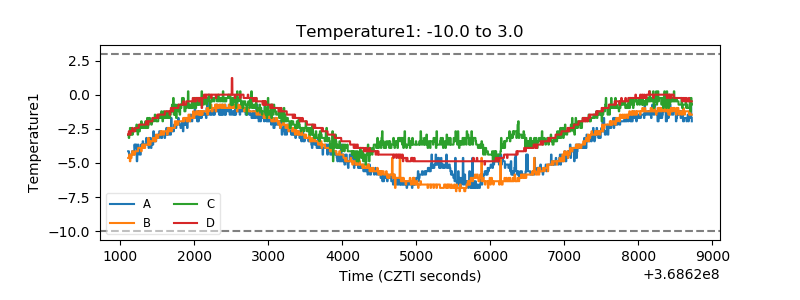 |
| Veto HV Monitor | 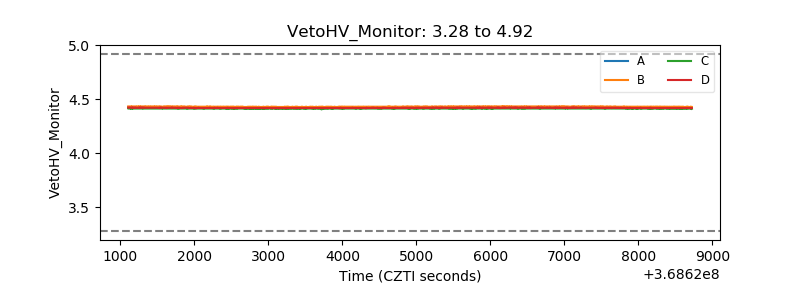 |
| Veto LLD | 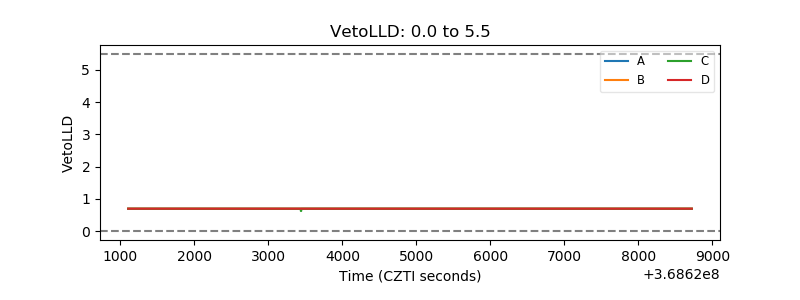 |
| Alpha Counter | 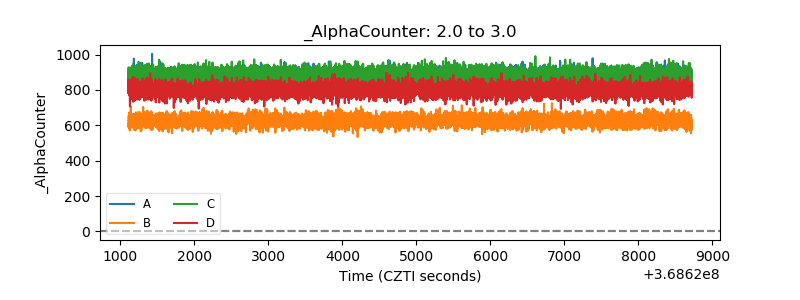 |
| _CPM_Rate | 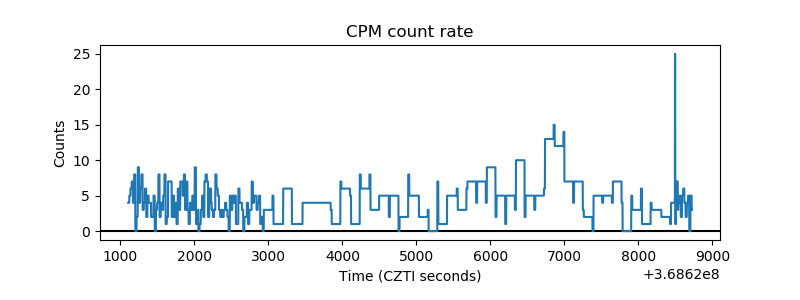 |
| CZT Counter | 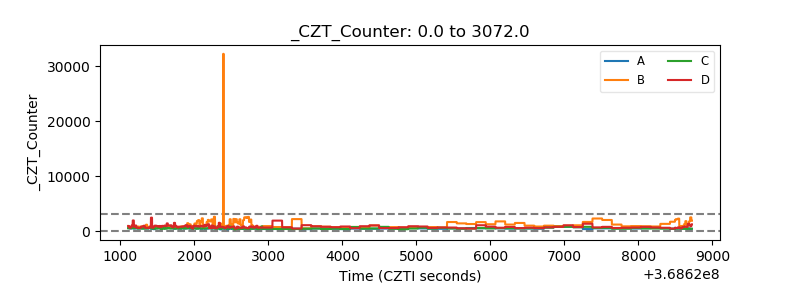 |
| +2.5 Volts monitor |  |
| +5 Volts monitor | 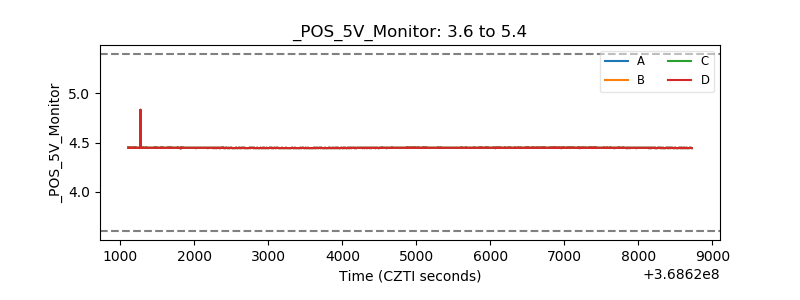 |
| _ROLL_ROT | 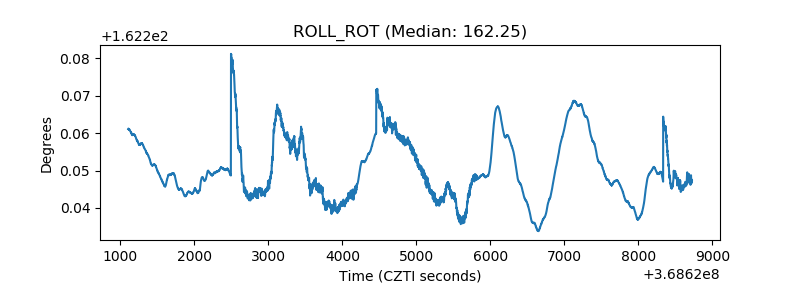 |
| _Roll_DEC |  |
| _Roll_RA | 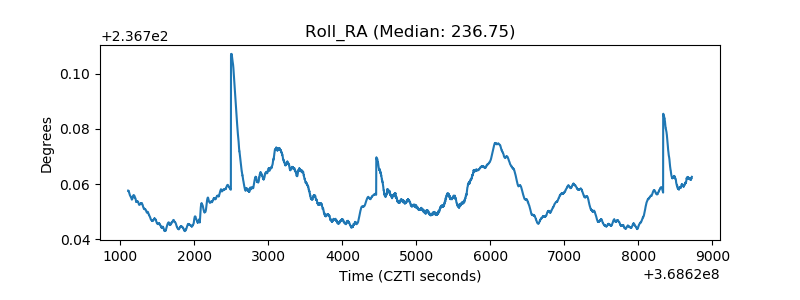 |
| Veto Counter | 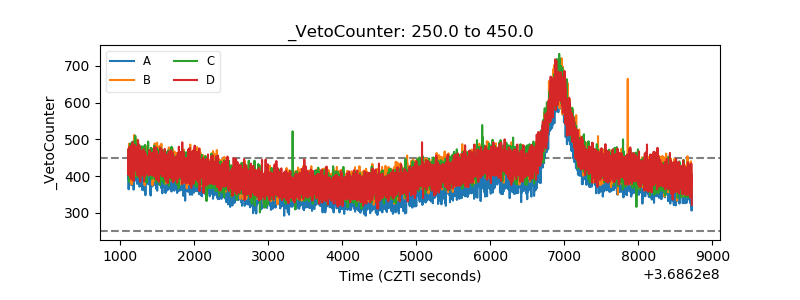 |