| Param | Original file | Final file |
|---|---|---|
| Filename | modeM0/AS1T04_051T01_9000004686_32126cztM0_level2.evt | modeM0/AS1T04_051T01_9000004686_32126cztM0_level2_quad_clean.evt |
| Size (bytes) | 681,410,880 | 97,329,600 |
| Size | 649.8 MB | 92.8 MB |
| Events in quadrant A | 3,285,326 | 643,509 |
| Events in quadrant B | 7,868,589 | 588,785 |
| Events in quadrant C | 3,558,836 | 629,183 |
| Events in quadrant D | 5,457,032 | 604,223 |
| Mode M9 | |||
|---|---|---|---|
| Quadrant | BADHDUFLAG | Total packets | Discarded packets |
| A | 0 | 4 | 0 |
| B | 0 | 4 | 0 |
| C | 0 | 4 | 0 |
| D | 0 | 4 | 0 |
| Mode M0 | |||
|---|---|---|---|
| Quadrant | BADHDUFLAG | Total packets | Discarded packets |
| A | 0 | 14156 | 1 |
| B | 0 | 28352 | 1 |
| C | 0 | 14931 | 1 |
| D | 0 | 21156 | 1 |
| Mode SS | |||
|---|---|---|---|
| Quadrant | BADHDUFLAG | Total packets | Discarded packets |
| A | 0 | 138 | 0 |
| B | 0 | 138 | 0 |
| C | 0 | 138 | 0 |
| D | 0 | 138 | 0 |
| Quadrant | Total seconds | Saturated seconds | Saturation percentage |
|---|---|---|---|
| A | 6916 | 38 | 0.549451% |
| B | 6917 | 1057 | 15.281191% |
| C | 6917 | 145 | 2.096285% |
| D | 6917 | 145 | 2.096285% |
Noise dominated data is calculated using 1-second bins in cleaned event files. If a bin has >2000 counts, and if more than 50% of those come from <1% of pixels, then it is considered to be noise-dominated and hence unusable.
| Quadrant | # 1 sec bins | Bins with >0 counts | Bins with >2000 counts | High rate bins dominated by noise | Noise dominated (total time) | Noise dominated (detector-on time) | Marked lightcurve |
|---|---|---|---|---|---|---|---|
| A | 7236 | 6917 | 0 | 0 | 0.00% | 0.00% | 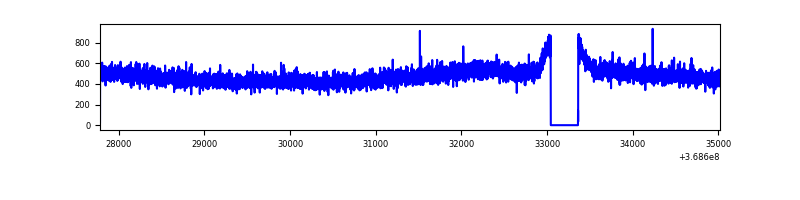 |
| B | 7237 | 6918 | 801 | 801 | 11.07% | 11.58% | 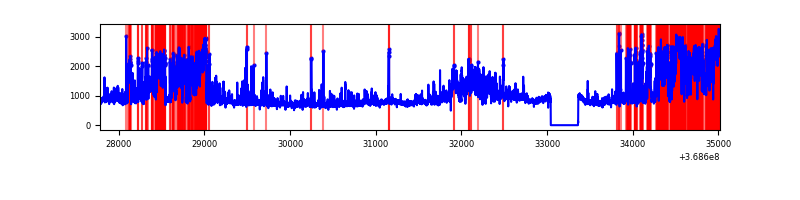 |
| C | 7237 | 6918 | 14 | 14 | 0.19% | 0.20% | 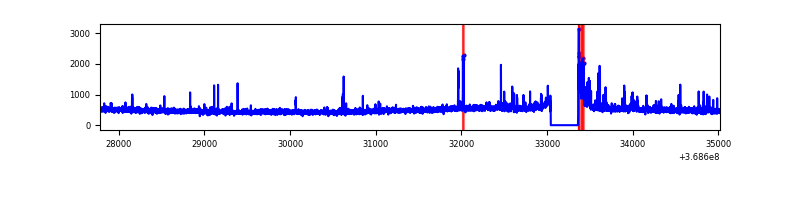 |
| D | 7237 | 6918 | 128 | 128 | 1.77% | 1.85% | 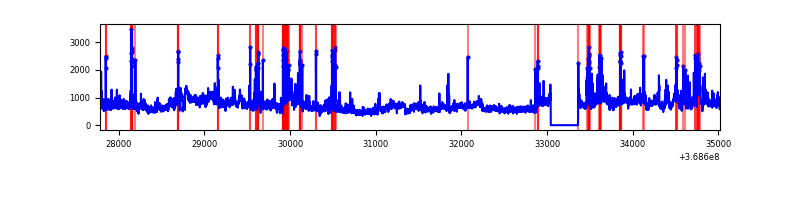 |
Top three noisy pixels from each quadrant. If the there are fewer than three noisy pixels in the level2.evt file, extra rows are filled as -1
| Pixel properties | Quadrant properties | ||||||
|---|---|---|---|---|---|---|---|
| Quadrant | DetID | PixID | Counts | Sigma | Mean | Median | Sigma |
| A | 13 | 6 | 17504 | 97.18 | 846 | 828 | 171.6 |
| A | 13 | 254 | 13464 | 73.64 | 846 | 828 | 171.6 |
| A | 3 | 137 | 8643 | 45.54 | 846 | 828 | 171.6 |
| B | 10 | 245 | 2416691 | 15734.75 | 796 | 775 | 153.5 |
| B | 6 | 159 | 1861977 | 12121.92 | 796 | 775 | 153.5 |
| B | 5 | 172 | 231477 | 1502.55 | 796 | 775 | 153.5 |
| C | 0 | 10 | 221568 | 1167.67 | 803 | 810 | 189.1 |
| C | 14 | 238 | 131517 | 691.36 | 803 | 810 | 189.1 |
| C | 3 | 233 | 25710 | 131.7 | 803 | 810 | 189.1 |
| D | 8 | 195 | 1687828 | 8659.6 | 812 | 790 | 194.8 |
| D | 12 | 233 | 381837 | 1955.92 | 812 | 790 | 194.8 |
| D | 7 | 38 | 158762 | 810.87 | 812 | 790 | 194.8 |
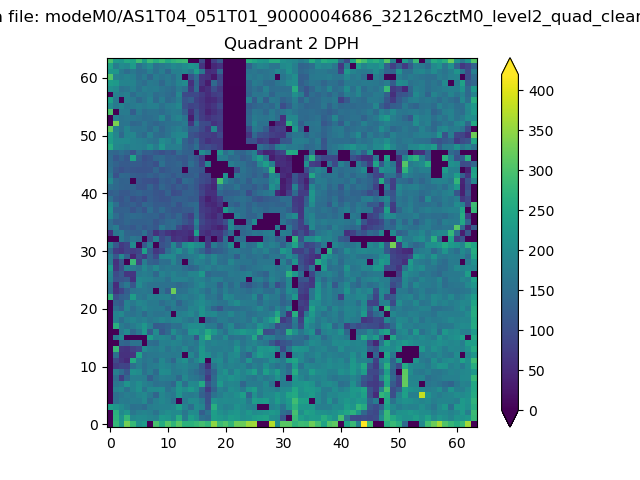
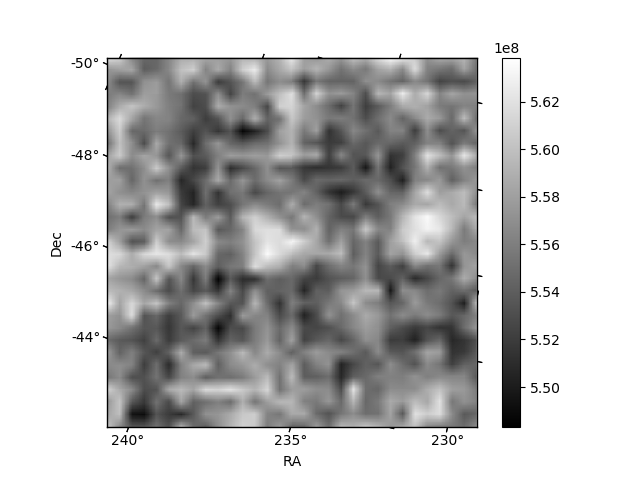
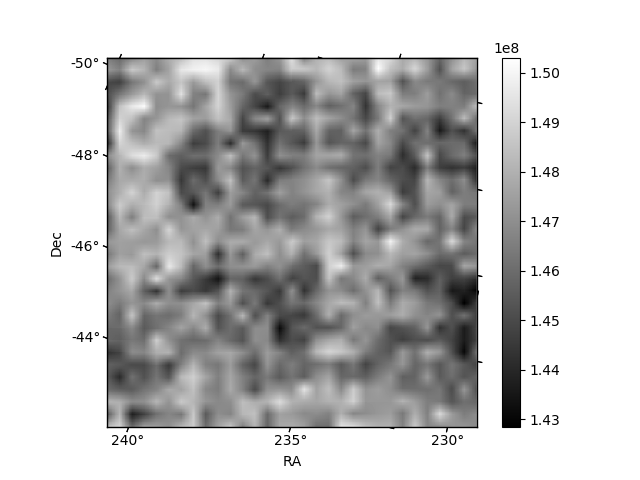
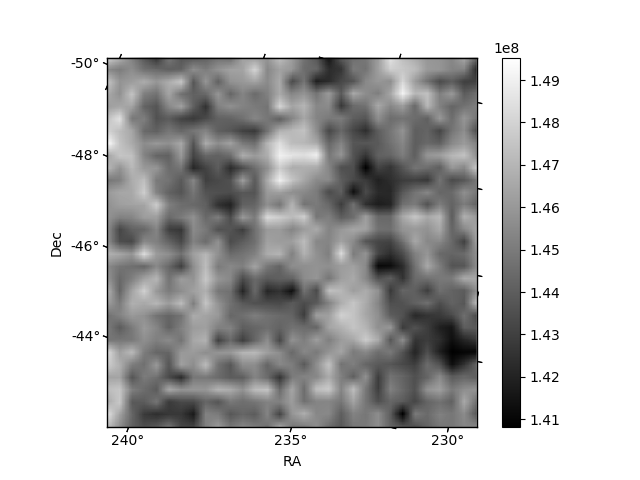
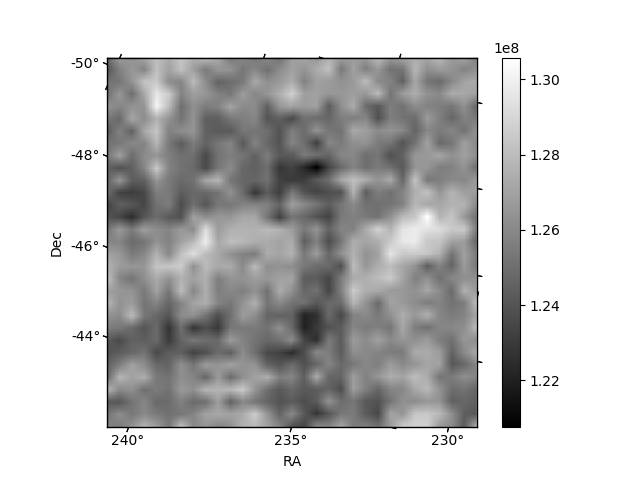
Histogram calculated using DETX and DETY for each event in the final _common_clean file
| Quadrant A | 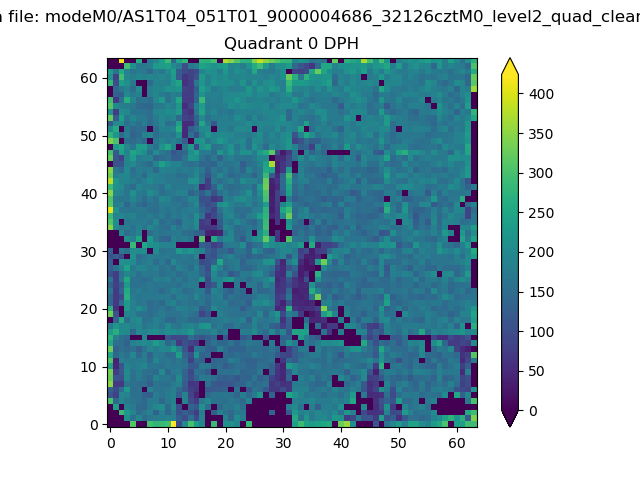 |
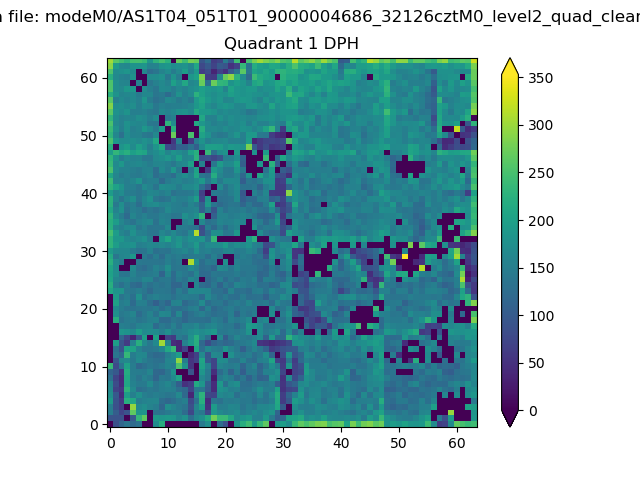 |
Quadrant B |
|---|---|---|---|
| Quadrant D | 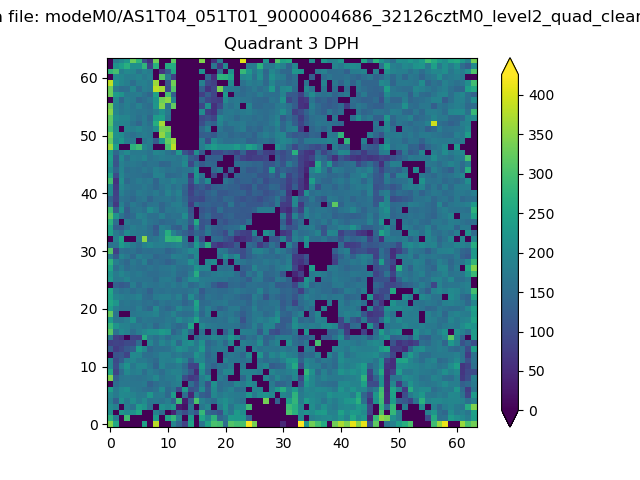 |
 |
Quadrant C |
| Plot type | Count rate plots | Images |
|---|---|---|
| Comparison with Poisson distribution Blue bars denote a histogram of data divided into 1 sec bins. Red curve is a Poisson curve with rate = median count rate of data. |
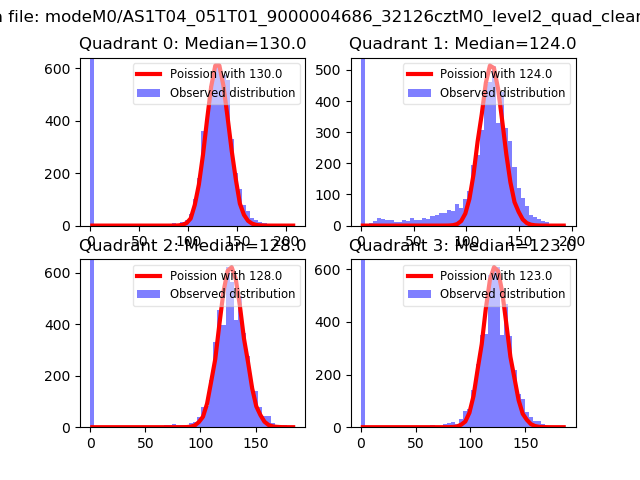 |
 |
| Quadrant-wise count rates Data is divided into 100 sec bins |
 |
|
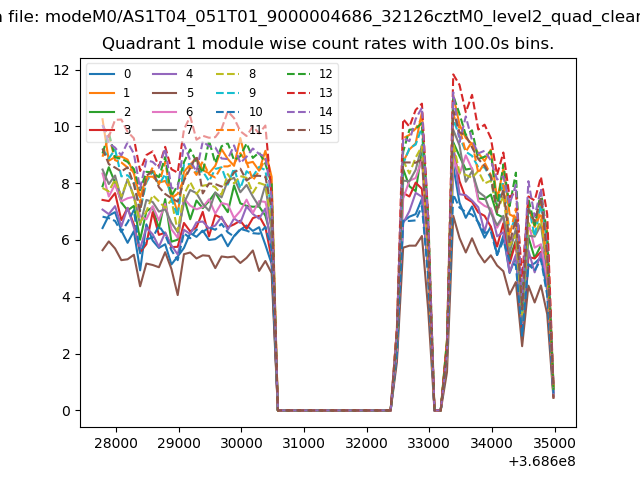
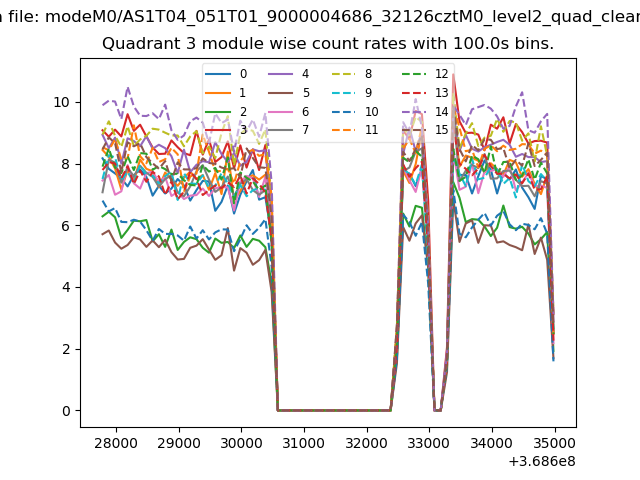
| Module-wise count rates for Quadrant A Data is divided into 100 sec bins |
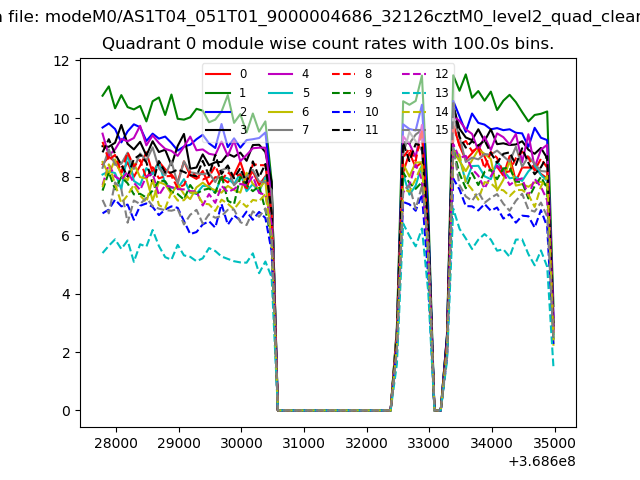 |
 |
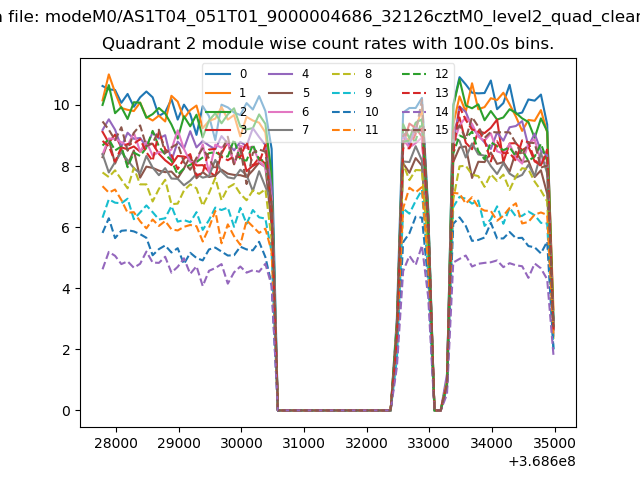
| Module-wise count rates for Quadrant B Data is divided into 100 sec bins |
 |
 |
| Module-wise count rates for Quadrant C Data is divided into 100 sec bins |
 |
 |
| Module-wise count rates for Quadrant D Data is divided into 100 sec bins |
 |
 |
| Parameter | Plot |
|---|---|
| CZT HV Monitor | 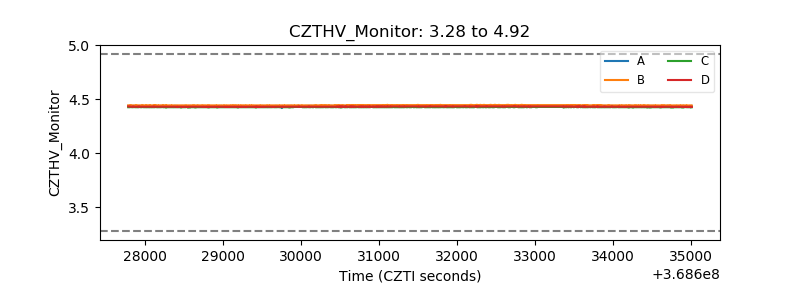 |
| D_VDD | 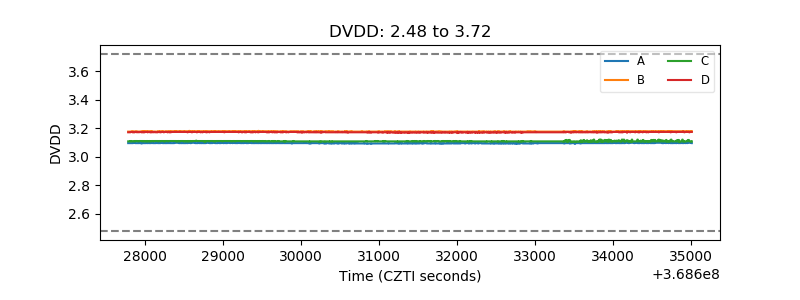 |
| Temperature 1 | 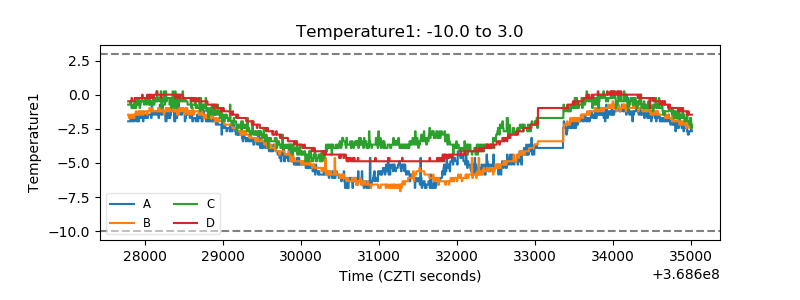 |
| Veto HV Monitor | 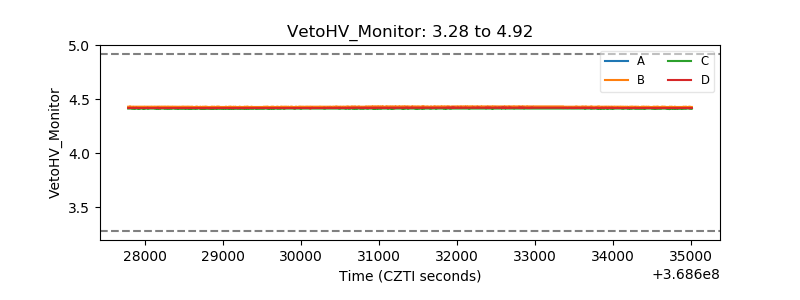 |
| Veto LLD | 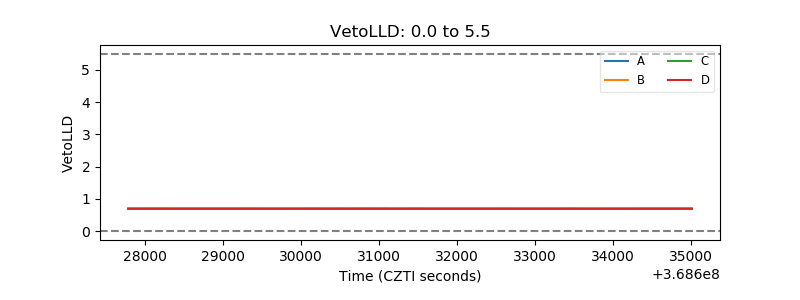 |
| Alpha Counter | 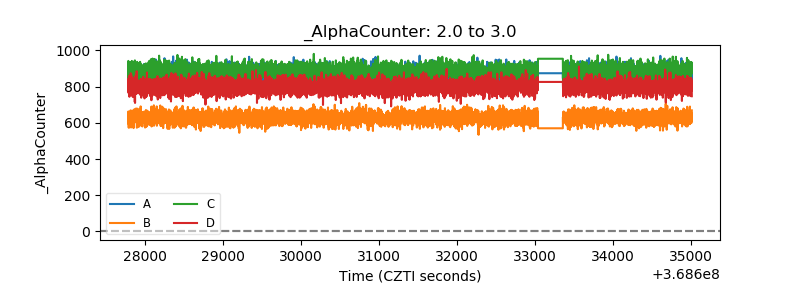 |
| _CPM_Rate | 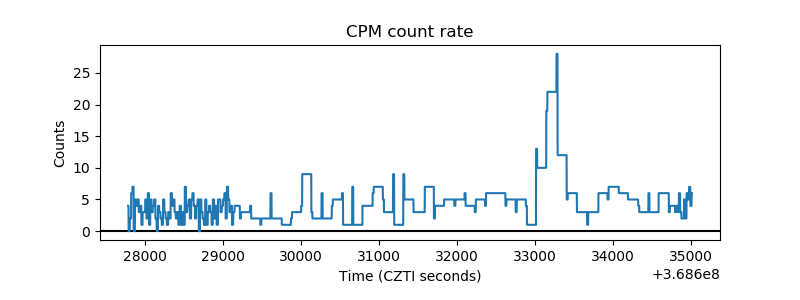 |
| CZT Counter | 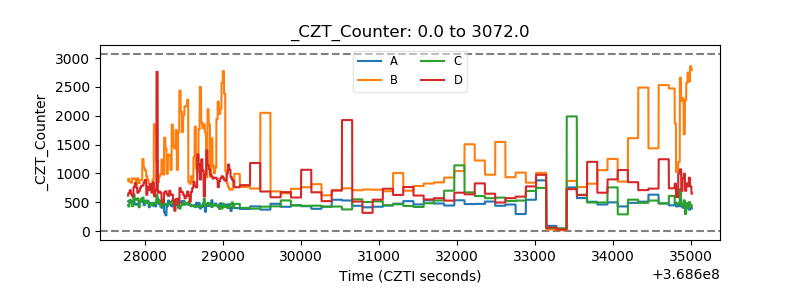 |
| +2.5 Volts monitor |  |
| +5 Volts monitor | 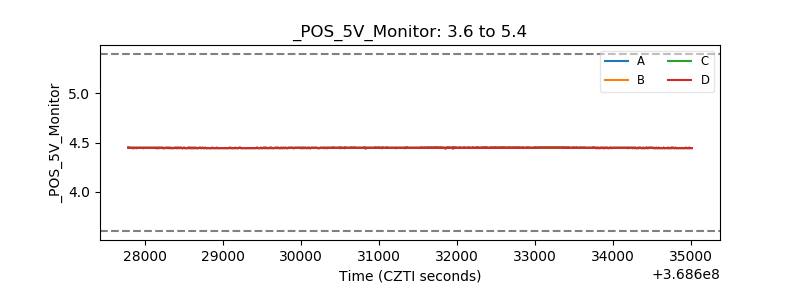 |
| _ROLL_ROT | 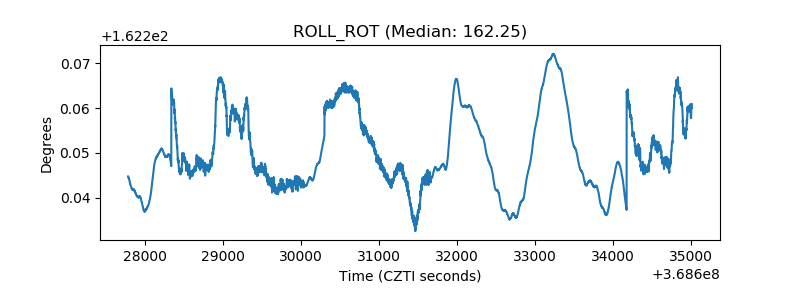 |
| _Roll_DEC | 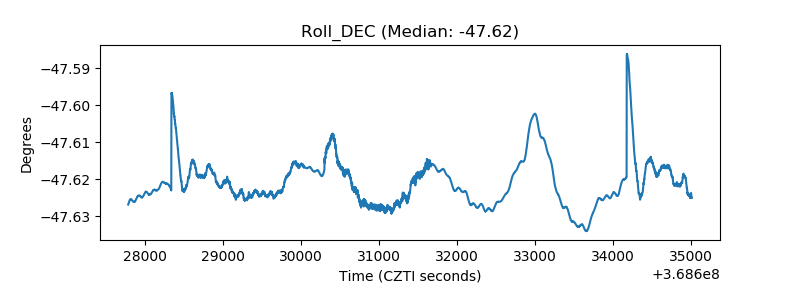 |
| _Roll_RA | 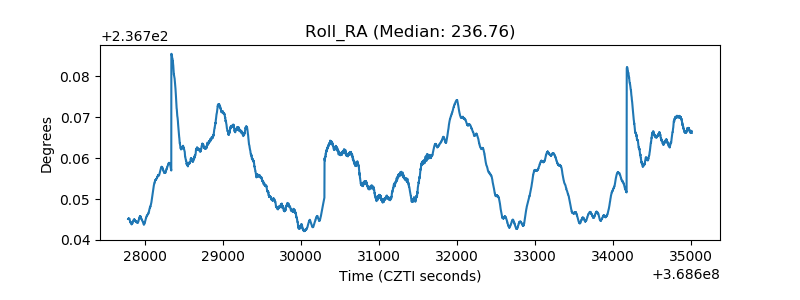 |
| Veto Counter | 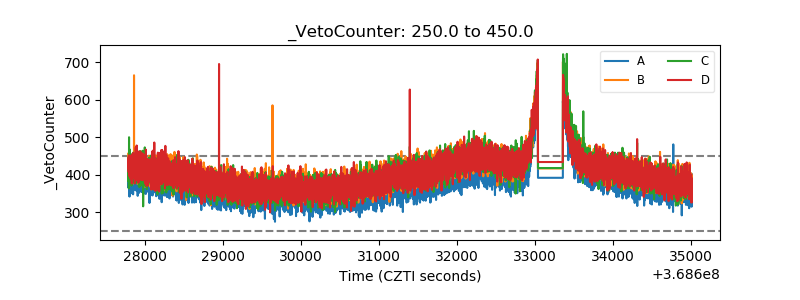 |