| Param | Original file | Final file |
|---|---|---|
| Filename | modeM0/AS1T04_051T01_9000004686_32128cztM0_level2.evt | modeM0/AS1T04_051T01_9000004686_32128cztM0_level2_quad_clean.evt |
| Size (bytes) | 1,298,183,040 | 164,145,600 |
| Size | 1.2 GB | 156.5 MB |
| Events in quadrant A | 5,872,638 | 1,104,154 |
| Events in quadrant B | 15,741,129 | 929,454 |
| Events in quadrant C | 6,743,964 | 1,064,762 |
| Events in quadrant D | 10,121,136 | 1,012,331 |
| Mode M9 | |||
|---|---|---|---|
| Quadrant | BADHDUFLAG | Total packets | Discarded packets |
| A | 0 | 12 | 0 |
| B | 0 | 12 | 0 |
| C | 0 | 12 | 0 |
| D | 0 | 12 | 0 |
| Mode M0 | |||
|---|---|---|---|
| Quadrant | BADHDUFLAG | Total packets | Discarded packets |
| A | 0 | 25413 | 2 |
| B | 0 | 55364 | 4 |
| C | 0 | 28062 | 2 |
| D | 0 | 38929 | 2 |
| Mode SS | |||
|---|---|---|---|
| Quadrant | BADHDUFLAG | Total packets | Discarded packets |
| A | 0 | 254 | 0 |
| B | 0 | 254 | 0 |
| C | 0 | 254 | 0 |
| D | 0 | 254 | 0 |
| Quadrant | Total seconds | Saturated seconds | Saturation percentage |
|---|---|---|---|
| A | 12425 | 56 | 0.450704% |
| B | 12424 | 2722 | 21.909208% |
| C | 12424 | 347 | 2.792981% |
| D | 12425 | 604 | 4.861167% |
Noise dominated data is calculated using 1-second bins in cleaned event files. If a bin has >2000 counts, and if more than 50% of those come from <1% of pixels, then it is considered to be noise-dominated and hence unusable.
| Quadrant | # 1 sec bins | Bins with >0 counts | Bins with >2000 counts | High rate bins dominated by noise | Noise dominated (total time) | Noise dominated (detector-on time) | Marked lightcurve |
|---|---|---|---|---|---|---|---|
| A | 13615 | 12427 | 0 | 0 | 0.00% | 0.00% | 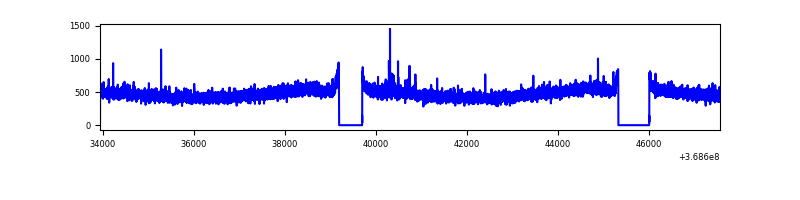 |
| B | 13614 | 12426 | 2232 | 2232 | 16.39% | 17.96% | 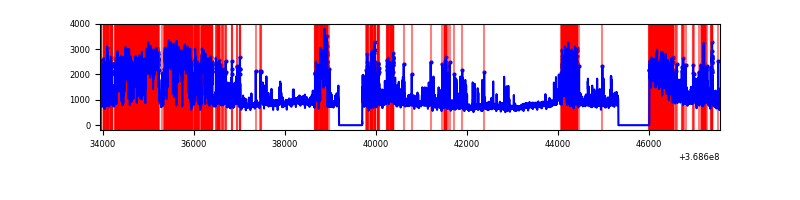 |
| C | 13614 | 12426 | 79 | 79 | 0.58% | 0.64% | 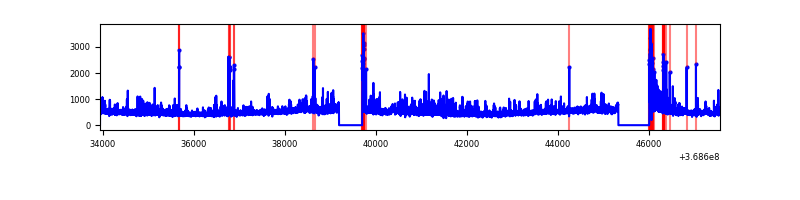 |
| D | 13615 | 12427 | 601 | 601 | 4.41% | 4.84% | 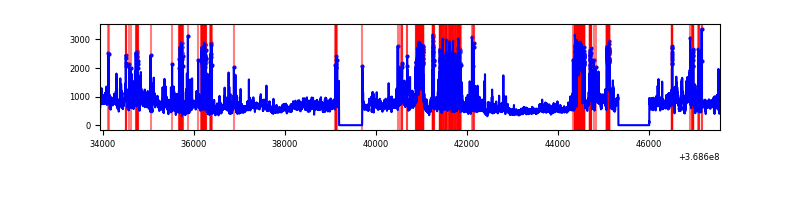 |
Top three noisy pixels from each quadrant. If the there are fewer than three noisy pixels in the level2.evt file, extra rows are filled as -1
| Pixel properties | Quadrant properties | ||||||
|---|---|---|---|---|---|---|---|
| Quadrant | DetID | PixID | Counts | Sigma | Mean | Median | Sigma |
| A | 13 | 6 | 38678 | 124.22 | 1503 | 1473 | 299.5 |
| A | 2 | 79 | 28236 | 89.36 | 1503 | 1473 | 299.5 |
| A | 13 | 254 | 24761 | 77.75 | 1503 | 1473 | 299.5 |
| B | 10 | 245 | 6223387 | 23994.76 | 1355 | 1323 | 259.3 |
| B | 6 | 159 | 3386444 | 13054.38 | 1355 | 1323 | 259.3 |
| B | 5 | 172 | 418109 | 1607.29 | 1355 | 1323 | 259.3 |
| C | 0 | 10 | 666829 | 1991.94 | 1420 | 1430 | 334.0 |
| C | 14 | 238 | 299224 | 891.48 | 1420 | 1430 | 334.0 |
| C | 14 | 254 | 103730 | 306.25 | 1420 | 1430 | 334.0 |
| D | 8 | 195 | 2517073 | 7328.81 | 1419 | 1379 | 343.3 |
| D | 12 | 233 | 1392875 | 4053.75 | 1419 | 1379 | 343.3 |
| D | 7 | 38 | 439912 | 1277.55 | 1419 | 1379 | 343.3 |
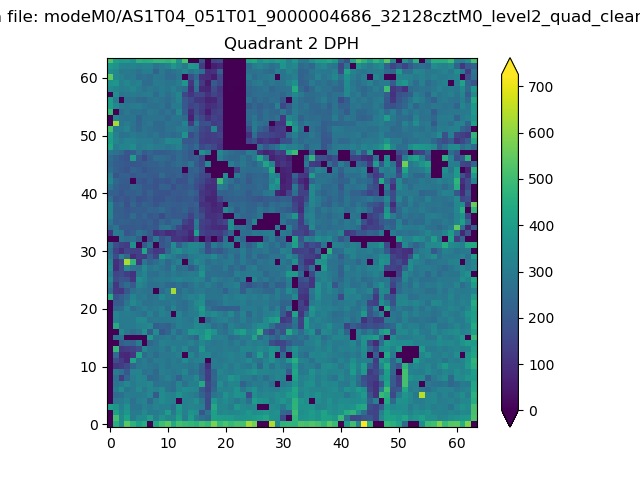
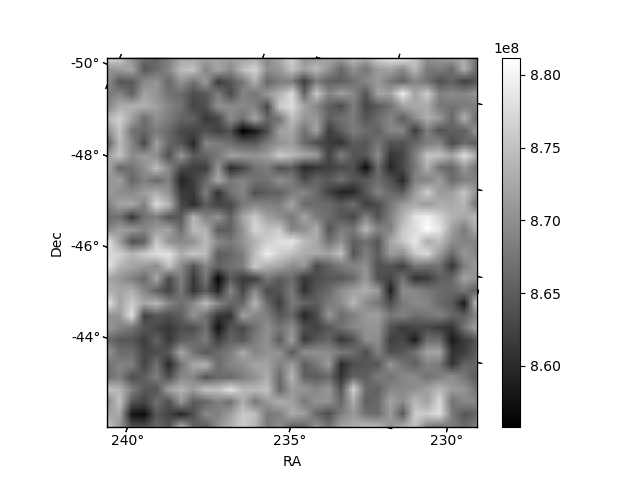
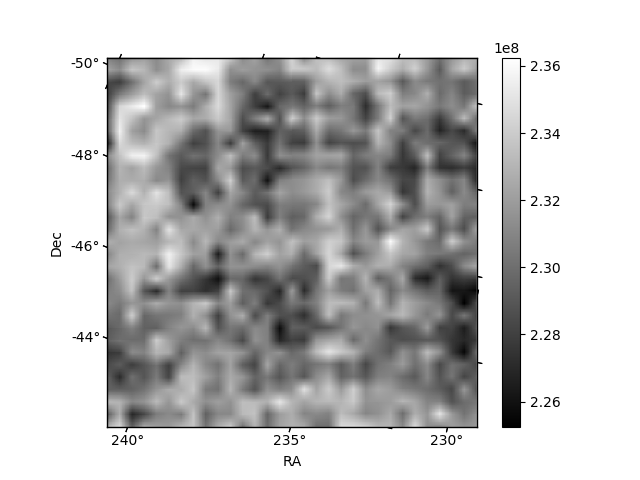
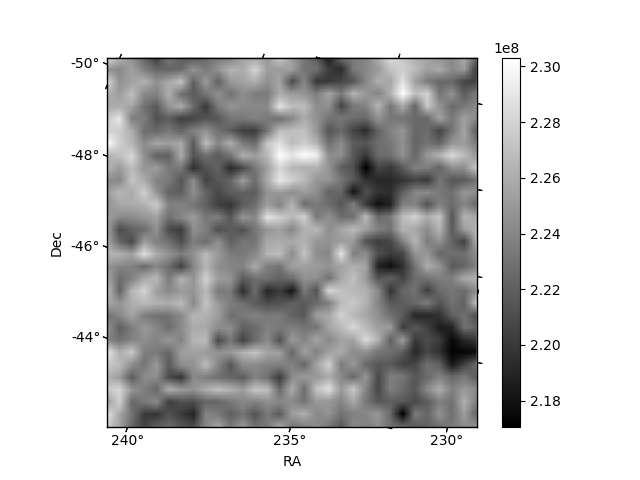
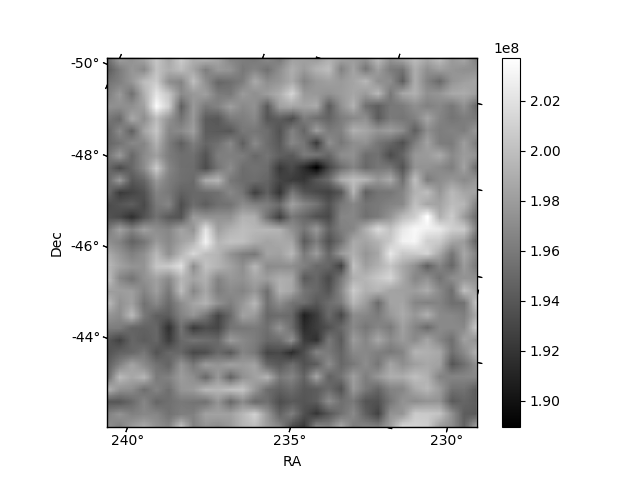
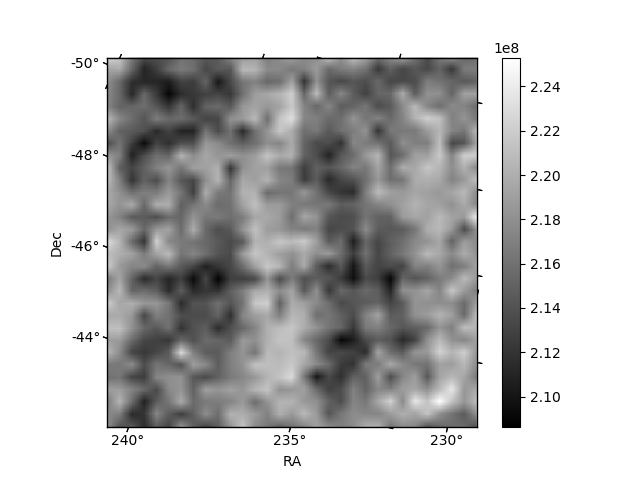
Histogram calculated using DETX and DETY for each event in the final _common_clean file
| Quadrant A | 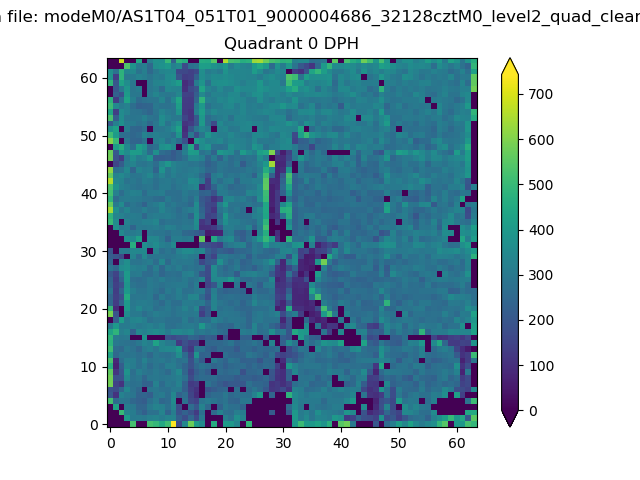 |
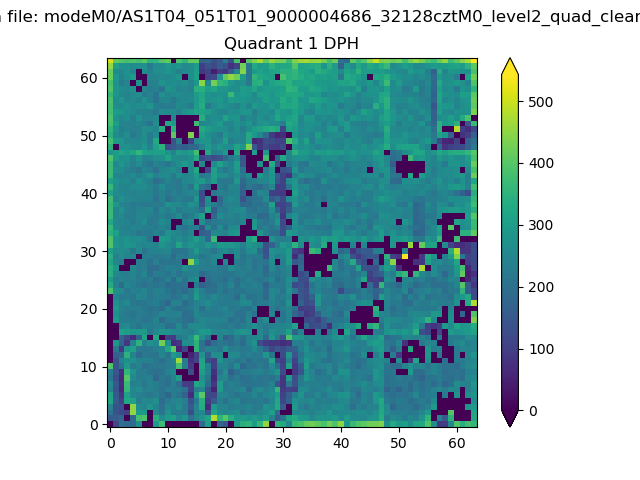 |
Quadrant B |
|---|---|---|---|
| Quadrant D | 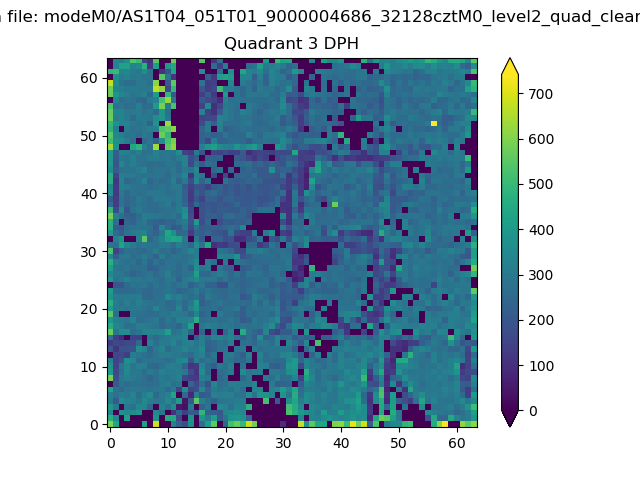 |
 |
Quadrant C |
| Plot type | Count rate plots | Images |
|---|---|---|
| Comparison with Poisson distribution Blue bars denote a histogram of data divided into 1 sec bins. Red curve is a Poisson curve with rate = median count rate of data. |
 |
 |
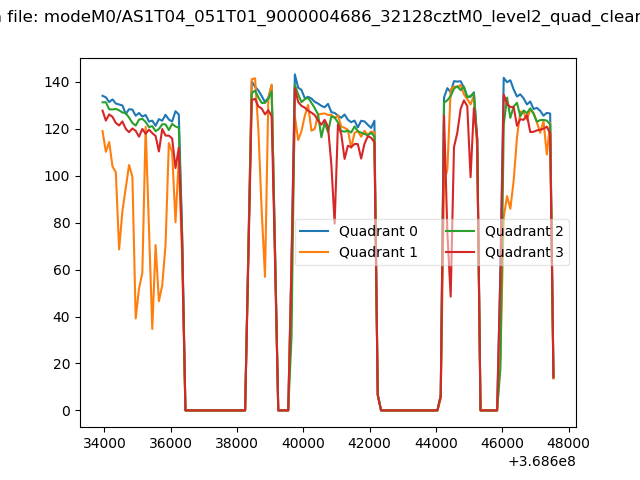
| Quadrant-wise count rates Data is divided into 100 sec bins |
 |
|
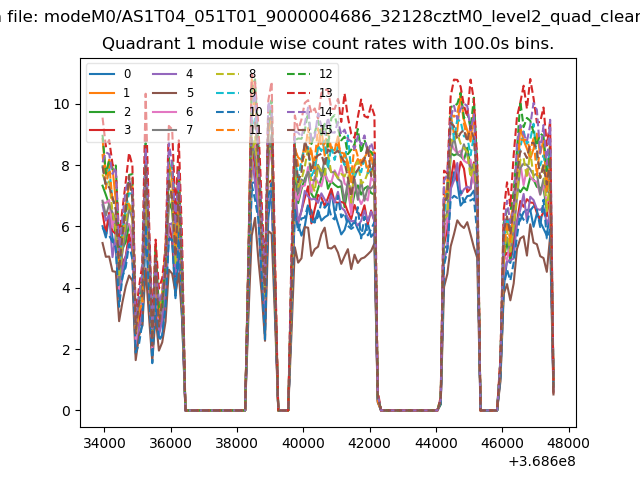
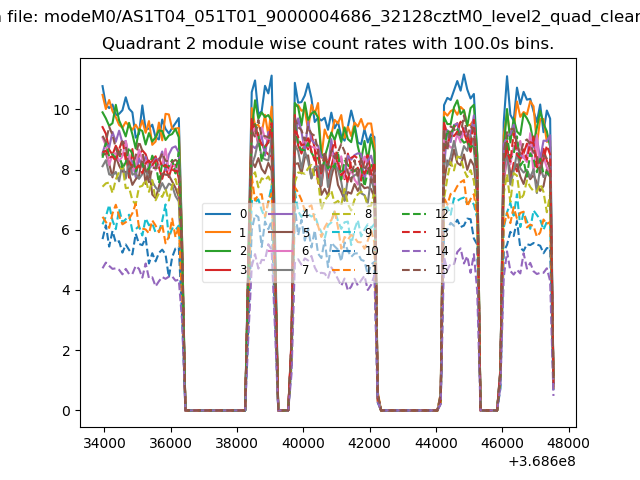
| Module-wise count rates for Quadrant A Data is divided into 100 sec bins |
 |
 |
| Module-wise count rates for Quadrant B Data is divided into 100 sec bins |
 |
 |
| Module-wise count rates for Quadrant C Data is divided into 100 sec bins |
 |
 |
| Module-wise count rates for Quadrant D Data is divided into 100 sec bins |
 |
 |
| Parameter | Plot |
|---|---|
| CZT HV Monitor | 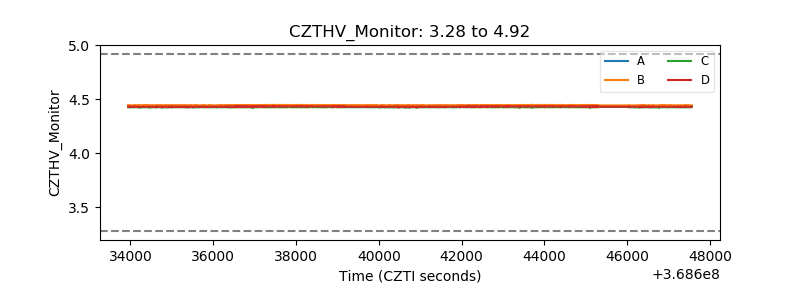 |
| D_VDD | 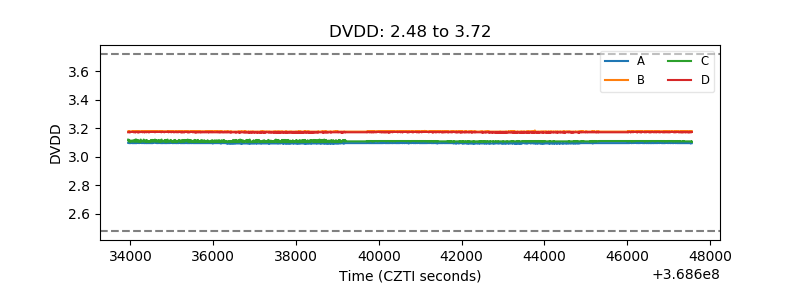 |
| Temperature 1 | 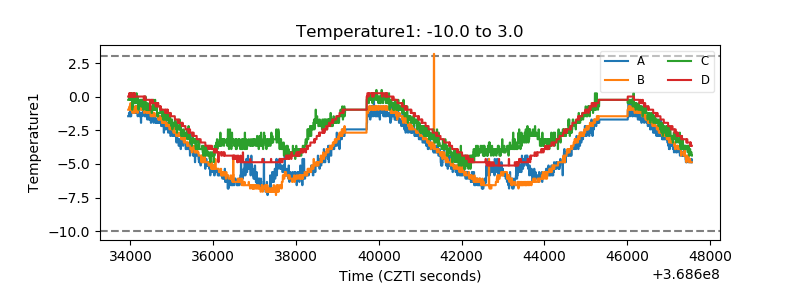 |
| Veto HV Monitor | 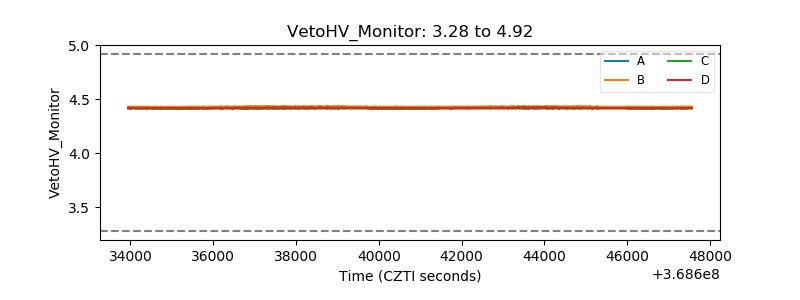 |
| Veto LLD |  |
| Alpha Counter | 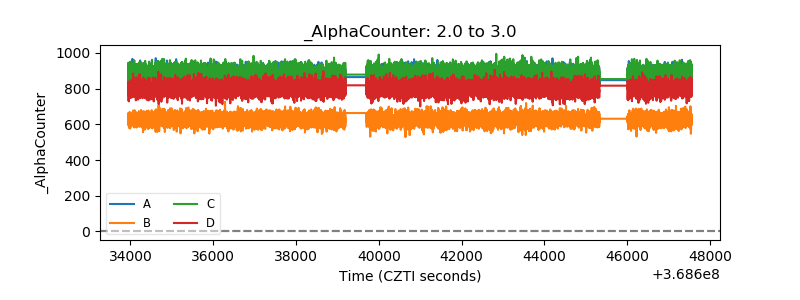 |
| _CPM_Rate | 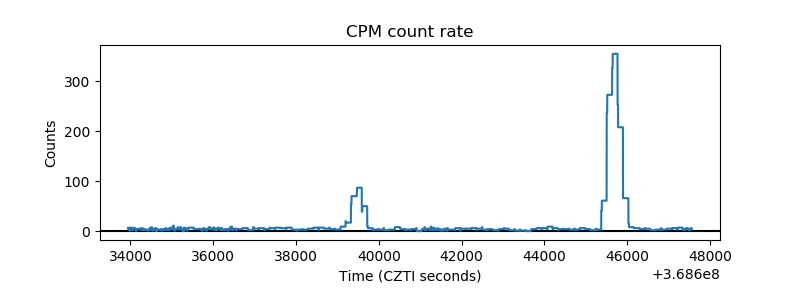 |
| CZT Counter | 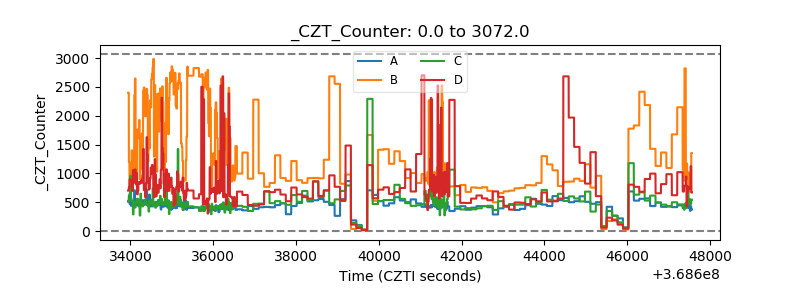 |
| +2.5 Volts monitor |  |
| +5 Volts monitor |  |
| _ROLL_ROT |  |
| _Roll_DEC | 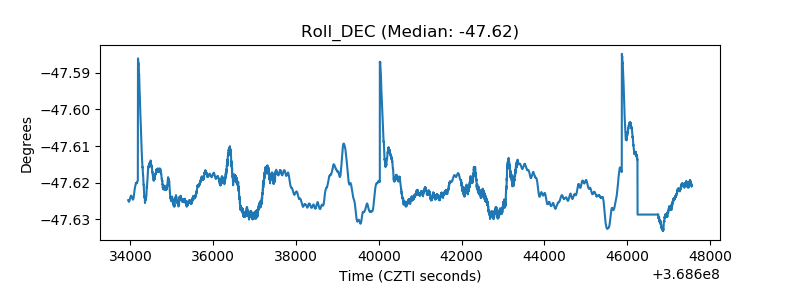 |
| _Roll_RA | 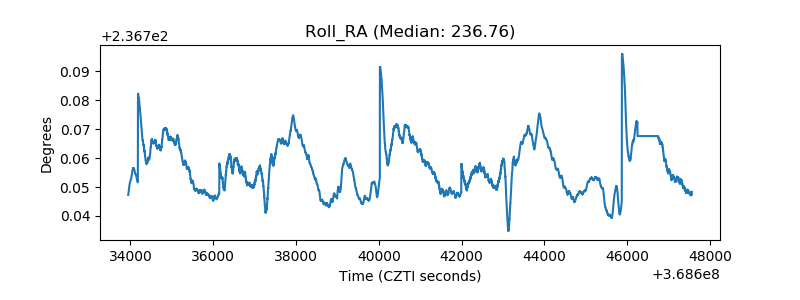 |
| Veto Counter | 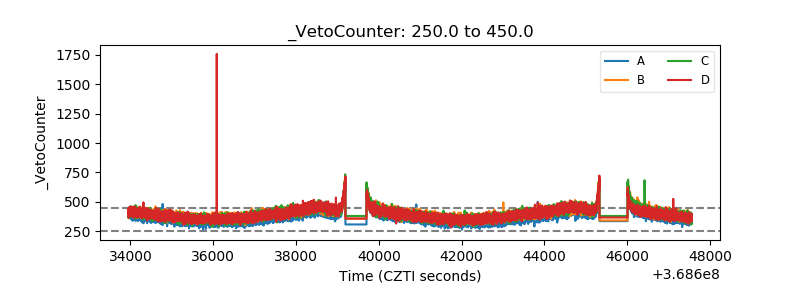 |