| Param | Original file | Final file |
|---|---|---|
| Filename | modeM0/AS1T04_051T01_9000004686_32129cztM0_level2.evt | modeM0/AS1T04_051T01_9000004686_32129cztM0_level2_quad_clean.evt |
| Size (bytes) | 629,366,400 | 94,645,440 |
| Size | 600.2 MB | 90.3 MB |
| Events in quadrant A | 3,123,467 | 623,386 |
| Events in quadrant B | 6,724,863 | 595,601 |
| Events in quadrant C | 3,450,553 | 603,884 |
| Events in quadrant D | 5,312,408 | 579,994 |
| Mode M9 | |||
|---|---|---|---|
| Quadrant | BADHDUFLAG | Total packets | Discarded packets |
| A | 0 | 9 | 0 |
| B | 0 | 9 | 0 |
| C | 0 | 9 | 0 |
| D | 0 | 9 | 0 |
| Mode M0 | |||
|---|---|---|---|
| Quadrant | BADHDUFLAG | Total packets | Discarded packets |
| A | 0 | 13515 | 2 |
| B | 0 | 24543 | 1 |
| C | 0 | 14391 | 1 |
| D | 0 | 20326 | 1 |
| Mode SS | |||
|---|---|---|---|
| Quadrant | BADHDUFLAG | Total packets | Discarded packets |
| A | 0 | 134 | 0 |
| B | 0 | 134 | 0 |
| C | 0 | 134 | 0 |
| D | 0 | 134 | 0 |
| Quadrant | Total seconds | Saturated seconds | Saturation percentage |
|---|---|---|---|
| A | 6648 | 11 | 0.165463% |
| B | 6649 | 490 | 7.369529% |
| C | 6649 | 195 | 2.932772% |
| D | 6649 | 208 | 3.128290% |
Noise dominated data is calculated using 1-second bins in cleaned event files. If a bin has >2000 counts, and if more than 50% of those come from <1% of pixels, then it is considered to be noise-dominated and hence unusable.
| Quadrant | # 1 sec bins | Bins with >0 counts | Bins with >2000 counts | High rate bins dominated by noise | Noise dominated (total time) | Noise dominated (detector-on time) | Marked lightcurve |
|---|---|---|---|---|---|---|---|
| A | 7523 | 6649 | 0 | 0 | 0.00% | 0.00% | 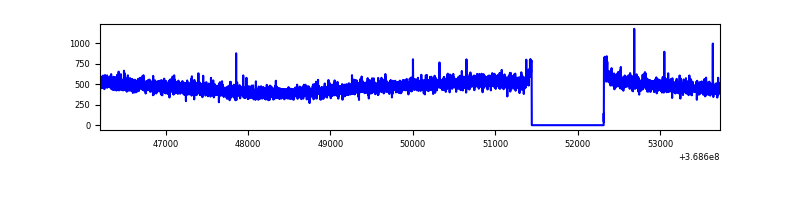 |
| B | 7524 | 6650 | 324 | 324 | 4.31% | 4.87% | 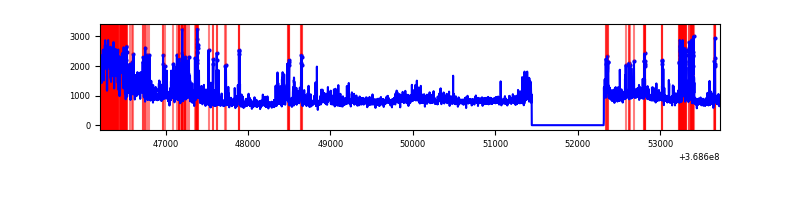 |
| C | 7524 | 6650 | 38 | 38 | 0.51% | 0.57% | 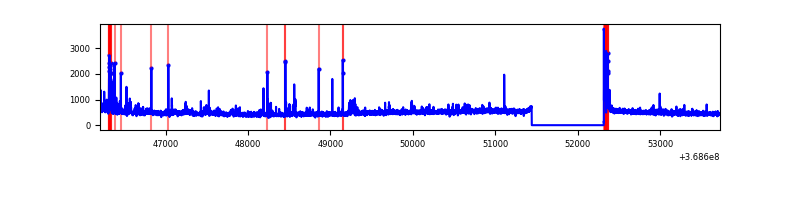 |
| D | 7524 | 6650 | 207 | 207 | 2.75% | 3.11% | 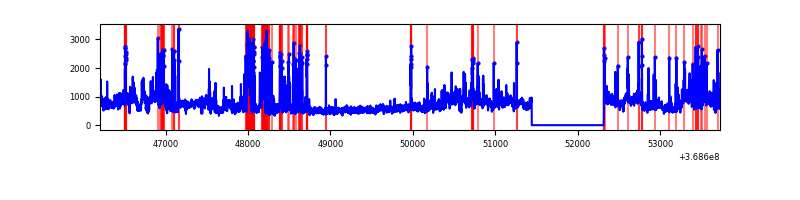 |
Top three noisy pixels from each quadrant. If the there are fewer than three noisy pixels in the level2.evt file, extra rows are filled as -1
| Pixel properties | Quadrant properties | ||||||
|---|---|---|---|---|---|---|---|
| Quadrant | DetID | PixID | Counts | Sigma | Mean | Median | Sigma |
| A | 13 | 6 | 20118 | 118.85 | 802 | 785 | 162.7 |
| A | 13 | 254 | 14850 | 86.46 | 802 | 785 | 162.7 |
| A | 3 | 137 | 8184 | 45.49 | 802 | 785 | 162.7 |
| B | 6 | 159 | 1953565 | 13101.45 | 780 | 760 | 149.1 |
| B | 10 | 245 | 1301542 | 8727.0 | 780 | 760 | 149.1 |
| B | 5 | 172 | 239957 | 1604.78 | 780 | 760 | 149.1 |
| C | 0 | 10 | 225897 | 1242.17 | 759 | 762 | 181.2 |
| C | 14 | 238 | 159715 | 877.02 | 759 | 762 | 181.2 |
| C | 14 | 254 | 54593 | 297.01 | 759 | 762 | 181.2 |
| D | 8 | 195 | 1400586 | 7685.58 | 760 | 741 | 182.1 |
| D | 12 | 233 | 780260 | 4279.8 | 760 | 741 | 182.1 |
| D | 12 | 218 | 99781 | 543.76 | 760 | 741 | 182.1 |
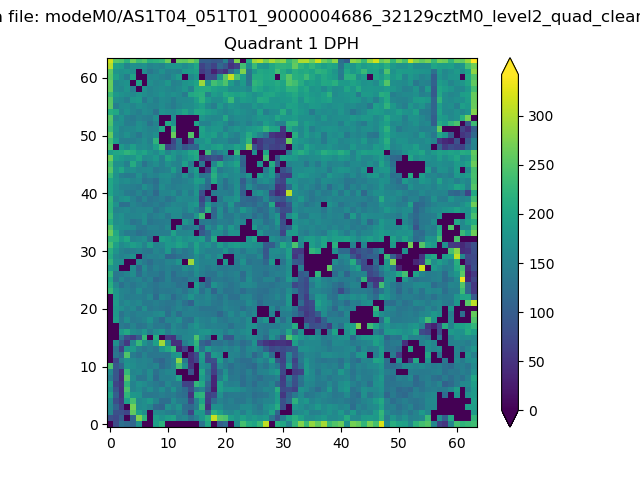
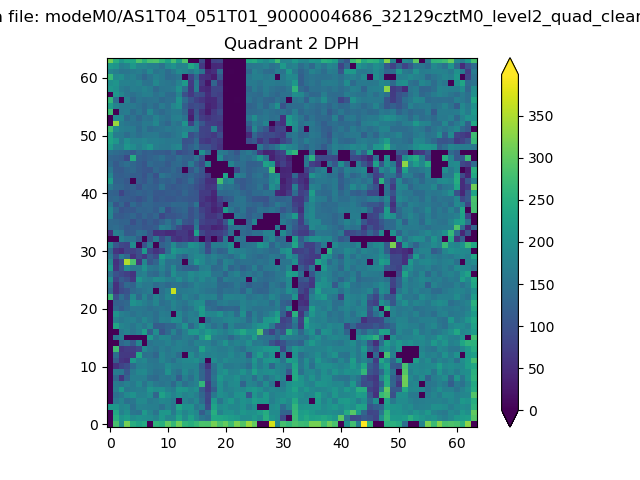
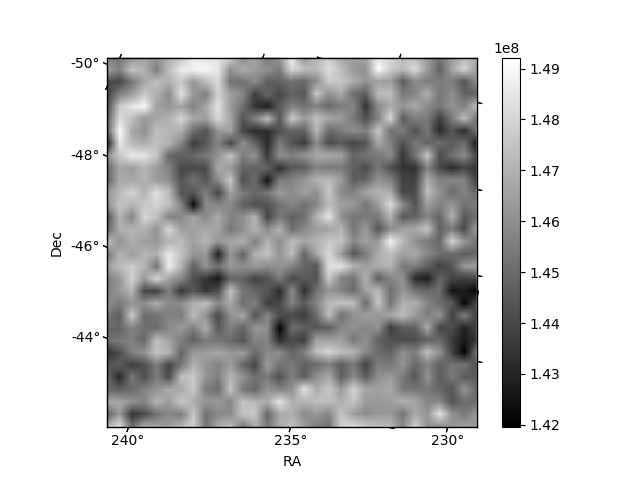
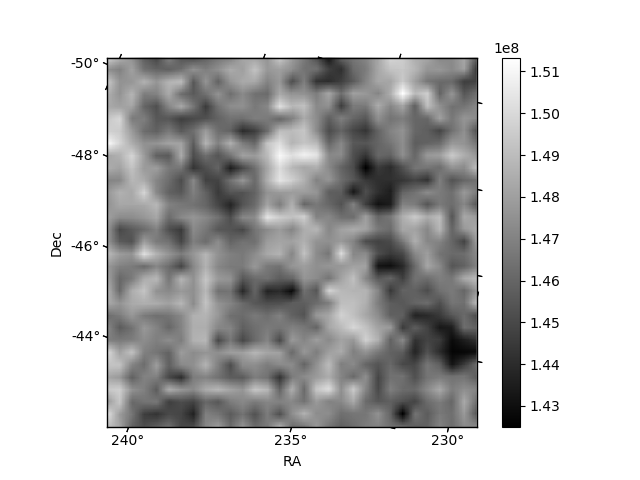
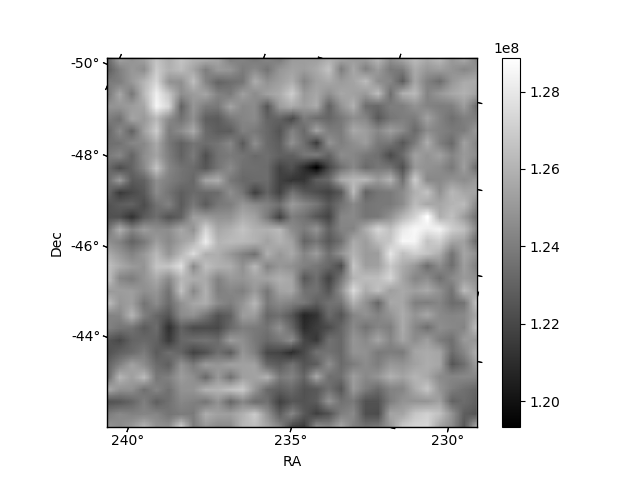
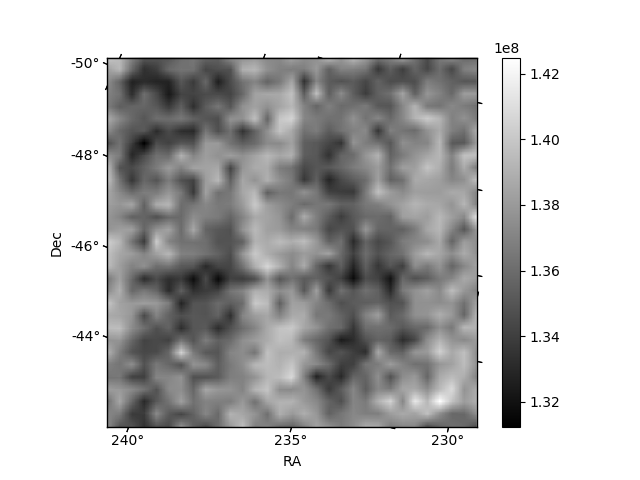
Histogram calculated using DETX and DETY for each event in the final _common_clean file
| Quadrant A |  |
 |
Quadrant B |
|---|---|---|---|
| Quadrant D |  |
 |
Quadrant C |
| Plot type | Count rate plots | Images |
|---|---|---|
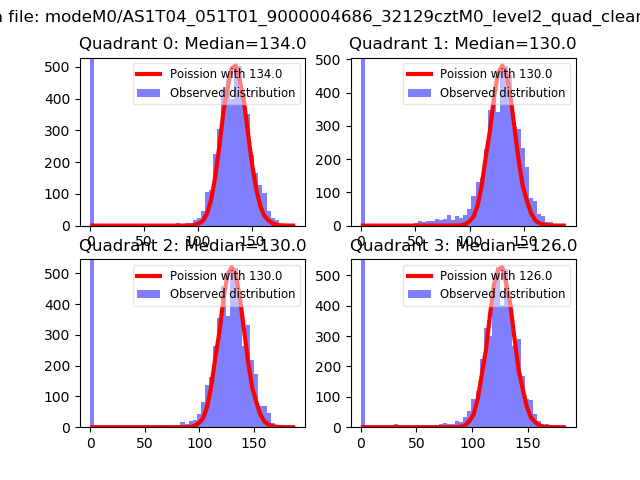
| Comparison with Poisson distribution Blue bars denote a histogram of data divided into 1 sec bins. Red curve is a Poisson curve with rate = median count rate of data. |
 |
 |
| Quadrant-wise count rates Data is divided into 100 sec bins |
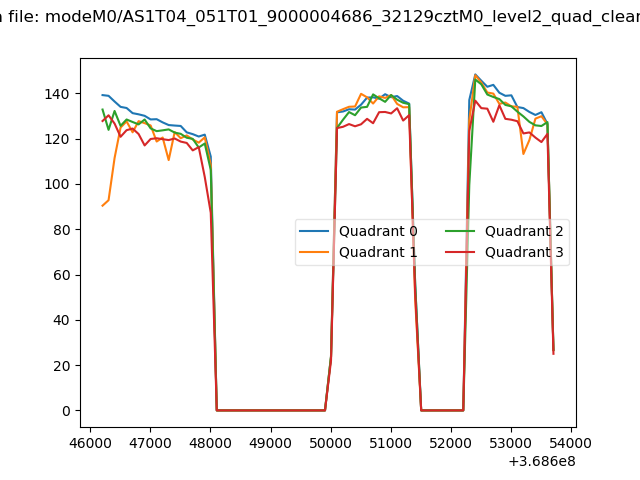 |
|
| Module-wise count rates for Quadrant A Data is divided into 100 sec bins |
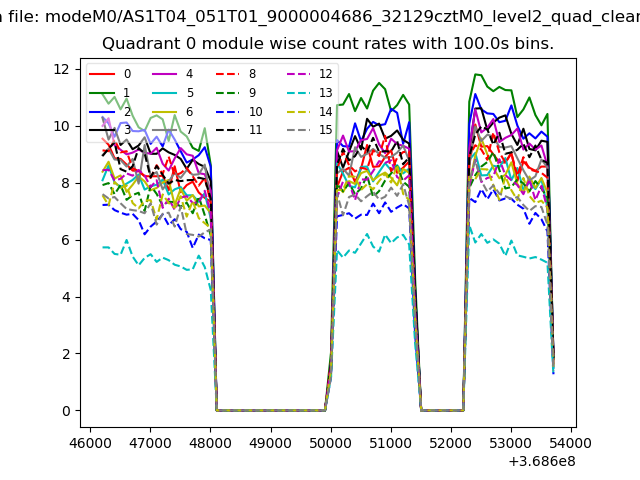 |
 |
| Module-wise count rates for Quadrant B Data is divided into 100 sec bins |
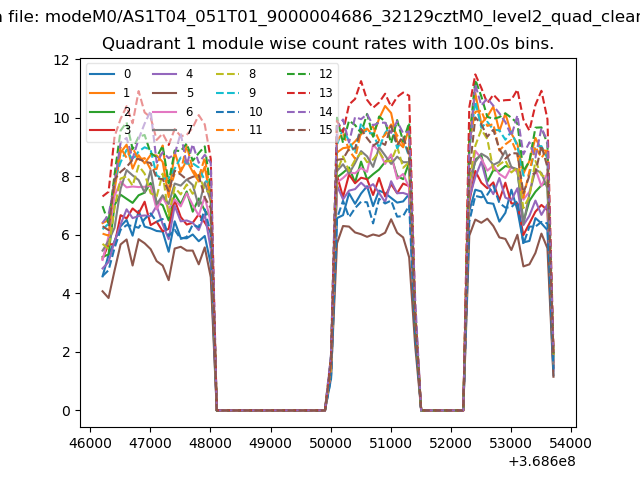 |
 |
| Module-wise count rates for Quadrant C Data is divided into 100 sec bins |
 |
 |
| Module-wise count rates for Quadrant D Data is divided into 100 sec bins |
 |
 |
| Parameter | Plot |
|---|---|
| CZT HV Monitor | 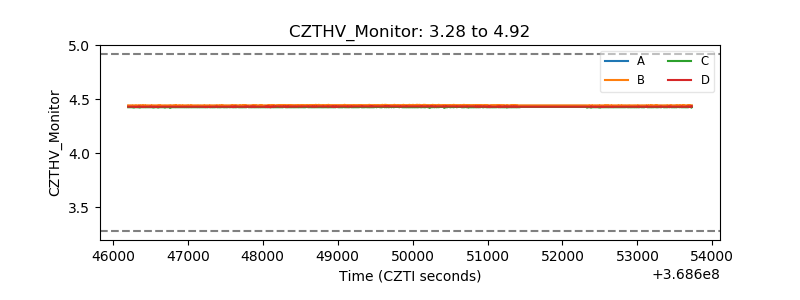 |
| D_VDD | 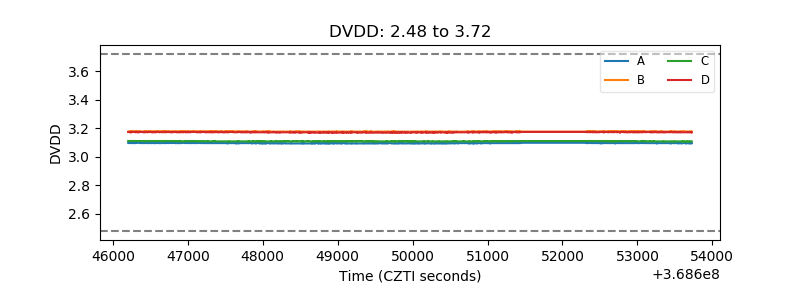 |
| Temperature 1 |  |
| Veto HV Monitor | 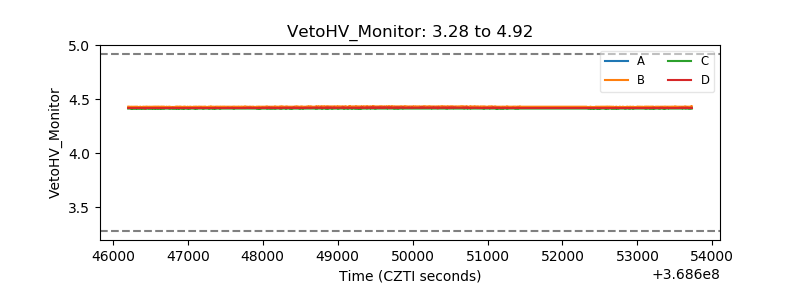 |
| Veto LLD |  |
| Alpha Counter | 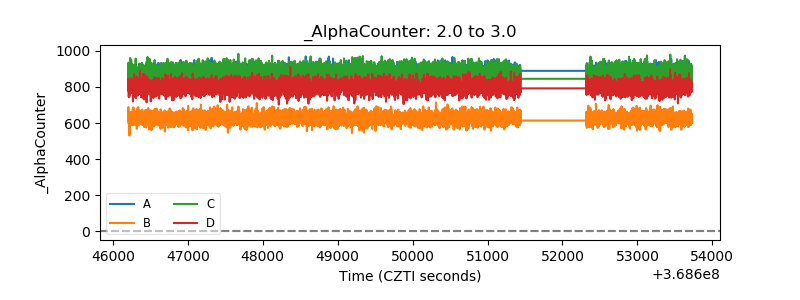 |
| _CPM_Rate | 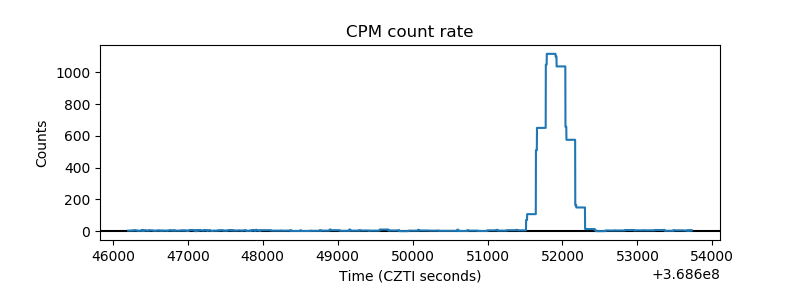 |
| CZT Counter |  |
| +2.5 Volts monitor |  |
| +5 Volts monitor |  |
| _ROLL_ROT | 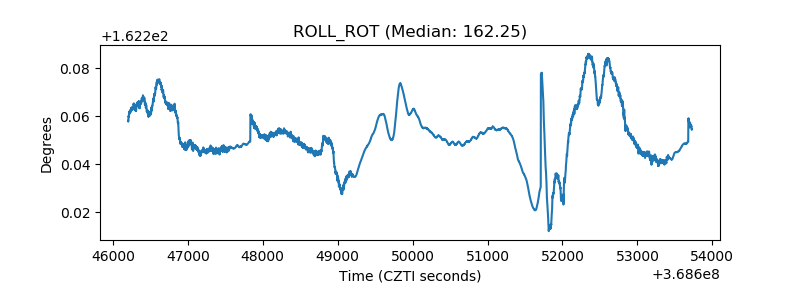 |
| _Roll_DEC | 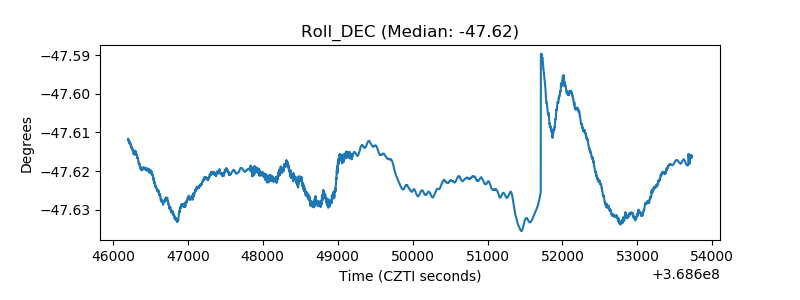 |
| _Roll_RA | 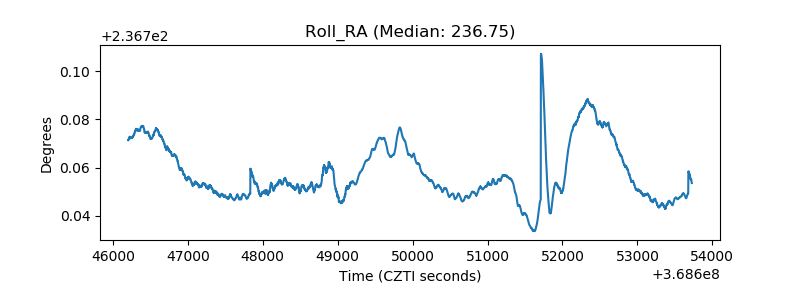 |
| Veto Counter | 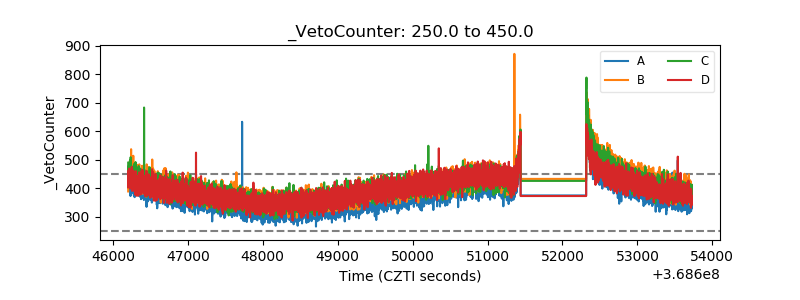 |