| Param | Original file | Final file |
|---|---|---|
| Filename | modeM0/AS1T04_051T01_9000004686_32130cztM0_level2.evt | modeM0/AS1T04_051T01_9000004686_32130cztM0_level2_quad_clean.evt |
| Size (bytes) | 631,114,560 | 87,183,360 |
| Size | 601.9 MB | 83.1 MB |
| Events in quadrant A | 2,993,971 | 582,447 |
| Events in quadrant B | 6,012,328 | 561,746 |
| Events in quadrant C | 3,235,316 | 561,362 |
| Events in quadrant D | 6,448,641 | 497,198 |
| Mode M9 | |||
|---|---|---|---|
| Quadrant | BADHDUFLAG | Total packets | Discarded packets |
| A | 0 | 10 | 0 |
| B | 0 | 10 | 0 |
| C | 0 | 10 | 0 |
| D | 0 | 10 | 0 |
| Mode M0 | |||
|---|---|---|---|
| Quadrant | BADHDUFLAG | Total packets | Discarded packets |
| A | 0 | 12831 | 1 |
| B | 0 | 22212 | 1 |
| C | 0 | 13471 | 1 |
| D | 0 | 23565 | 1 |
| Mode SS | |||
|---|---|---|---|
| Quadrant | BADHDUFLAG | Total packets | Discarded packets |
| A | 0 | 128 | 0 |
| B | 0 | 128 | 0 |
| C | 0 | 128 | 0 |
| D | 0 | 128 | 0 |
| Quadrant | Total seconds | Saturated seconds | Saturation percentage |
|---|---|---|---|
| A | 6255 | 7 | 0.111910% |
| B | 6256 | 355 | 5.674552% |
| C | 6256 | 107 | 1.710358% |
| D | 6256 | 957 | 15.297315% |
Noise dominated data is calculated using 1-second bins in cleaned event files. If a bin has >2000 counts, and if more than 50% of those come from <1% of pixels, then it is considered to be noise-dominated and hence unusable.
| Quadrant | # 1 sec bins | Bins with >0 counts | Bins with >2000 counts | High rate bins dominated by noise | Noise dominated (total time) | Noise dominated (detector-on time) | Marked lightcurve |
|---|---|---|---|---|---|---|---|
| A | 7315 | 6256 | 0 | 0 | 0.00% | 0.00% | 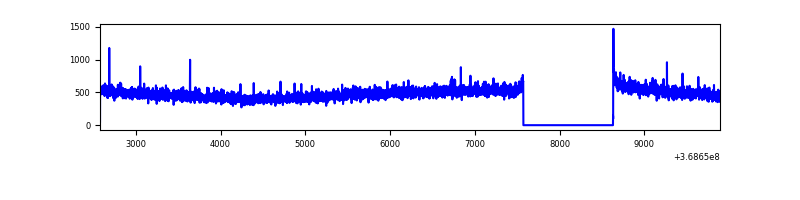 |
| B | 7316 | 6257 | 199 | 199 | 2.72% | 3.18% | 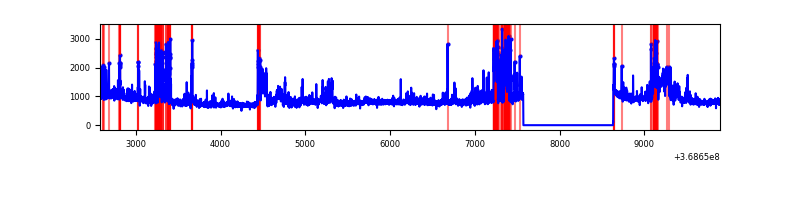 |
| C | 7316 | 6257 | 47 | 47 | 0.64% | 0.75% |  |
| D | 7316 | 6257 | 902 | 902 | 12.33% | 14.42% | 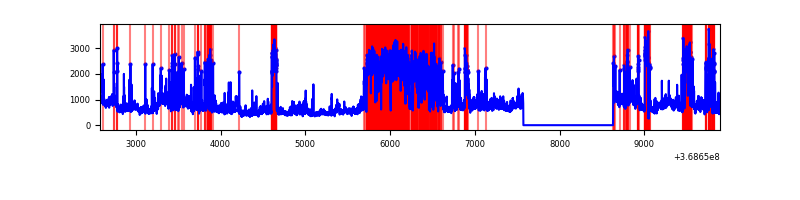 |
Top three noisy pixels from each quadrant. If the there are fewer than three noisy pixels in the level2.evt file, extra rows are filled as -1
| Pixel properties | Quadrant properties | ||||||
|---|---|---|---|---|---|---|---|
| Quadrant | DetID | PixID | Counts | Sigma | Mean | Median | Sigma |
| A | 13 | 6 | 17879 | 110.7 | 767 | 752 | 154.7 |
| A | 13 | 254 | 14431 | 88.42 | 767 | 752 | 154.7 |
| A | 3 | 137 | 7705 | 44.94 | 767 | 752 | 154.7 |
| B | 6 | 159 | 1805677 | 12721.68 | 745 | 725 | 141.9 |
| B | 10 | 245 | 628747 | 4426.43 | 745 | 725 | 141.9 |
| B | 5 | 172 | 470620 | 3311.92 | 745 | 725 | 141.9 |
| C | 0 | 10 | 219690 | 1293.48 | 724 | 729 | 169.3 |
| C | 14 | 238 | 123936 | 727.83 | 724 | 729 | 169.3 |
| C | 4 | 175 | 14905 | 83.74 | 724 | 729 | 169.3 |
| D | 12 | 233 | 2398727 | 14669.43 | 679 | 662 | 163.5 |
| D | 8 | 195 | 1145915 | 7005.74 | 679 | 662 | 163.5 |
| D | 7 | 38 | 129321 | 787.03 | 679 | 662 | 163.5 |
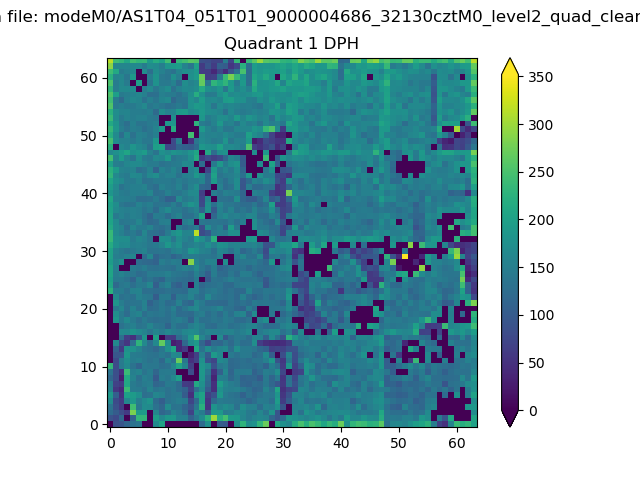
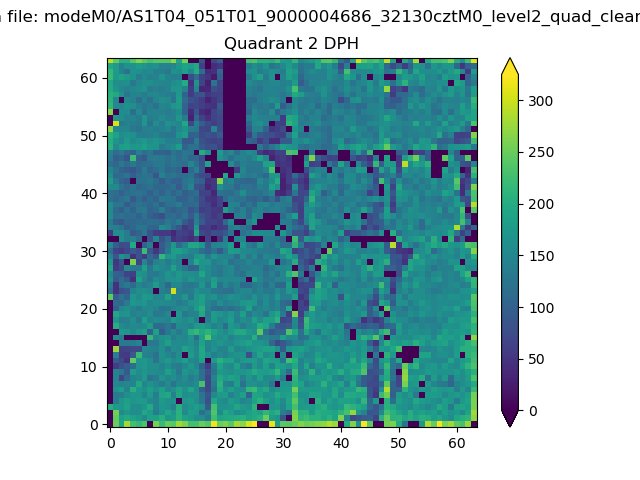
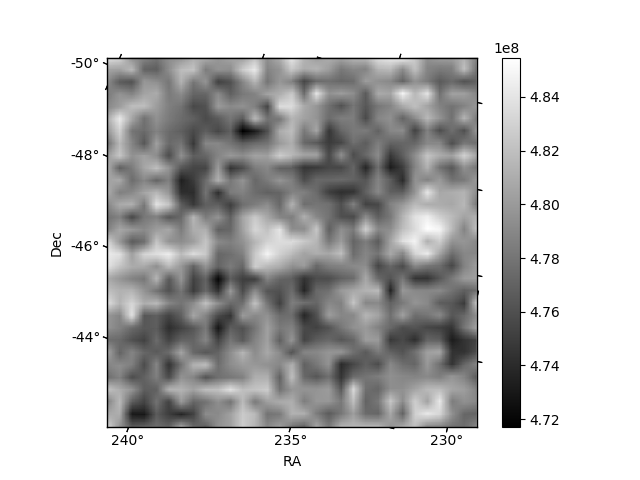
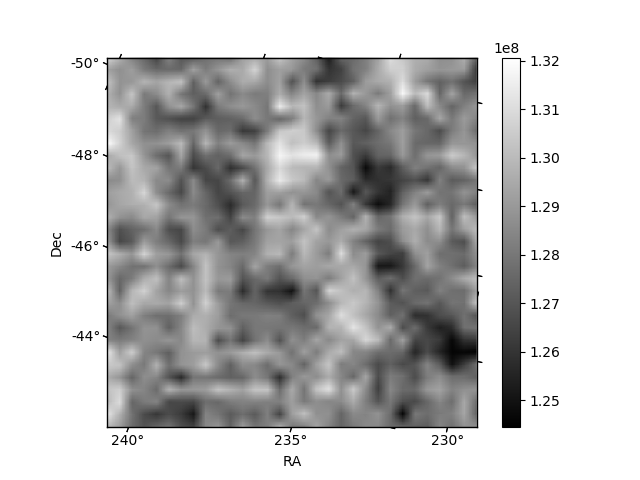
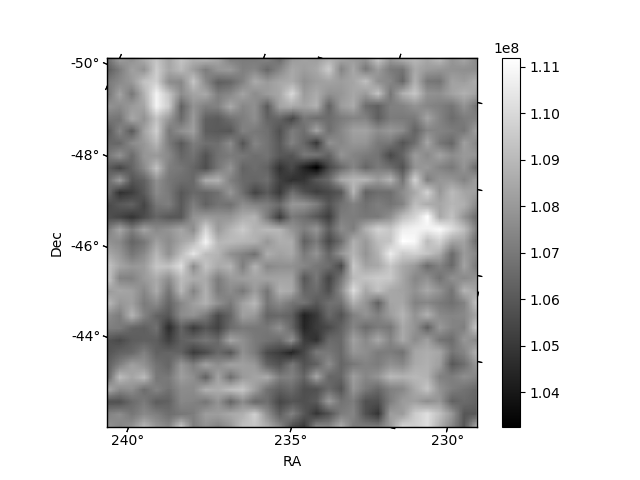
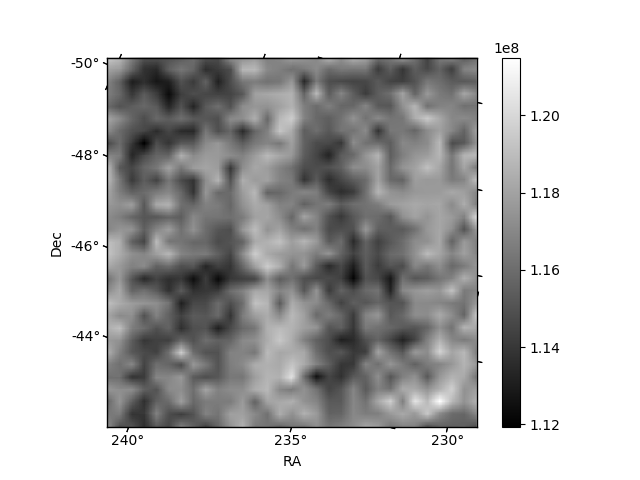
Histogram calculated using DETX and DETY for each event in the final _common_clean file
| Quadrant A | 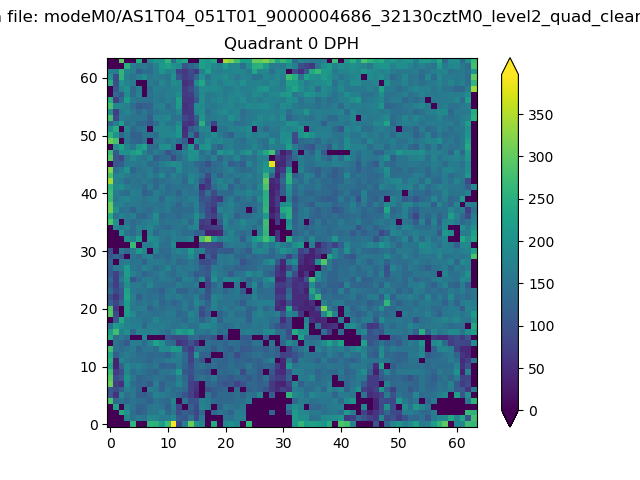 |
 |
Quadrant B |
|---|---|---|---|
| Quadrant D | 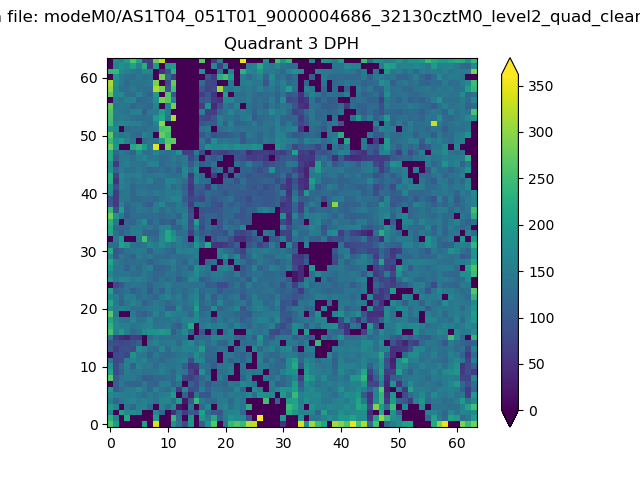 |
 |
Quadrant C |
| Plot type | Count rate plots | Images |
|---|---|---|
| Comparison with Poisson distribution Blue bars denote a histogram of data divided into 1 sec bins. Red curve is a Poisson curve with rate = median count rate of data. |
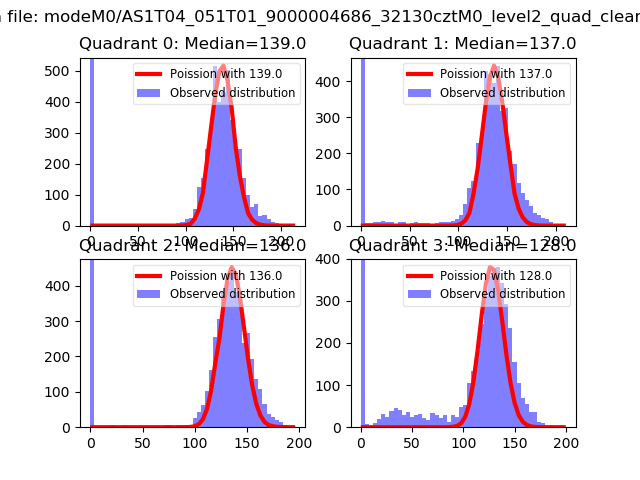 |
 |
| Quadrant-wise count rates Data is divided into 100 sec bins |
 |
|
| Module-wise count rates for Quadrant A Data is divided into 100 sec bins |
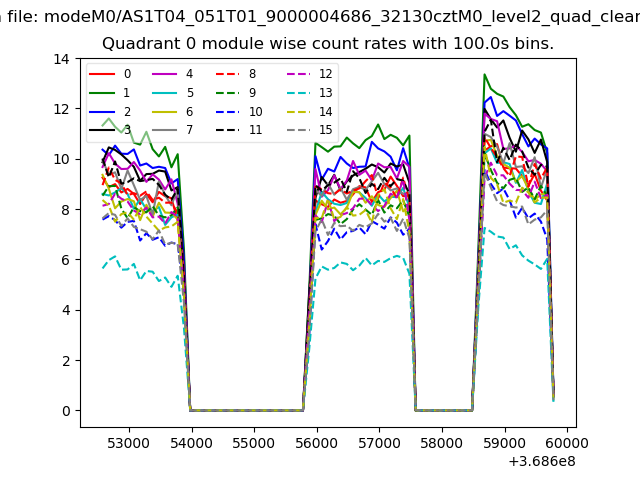 |
 |
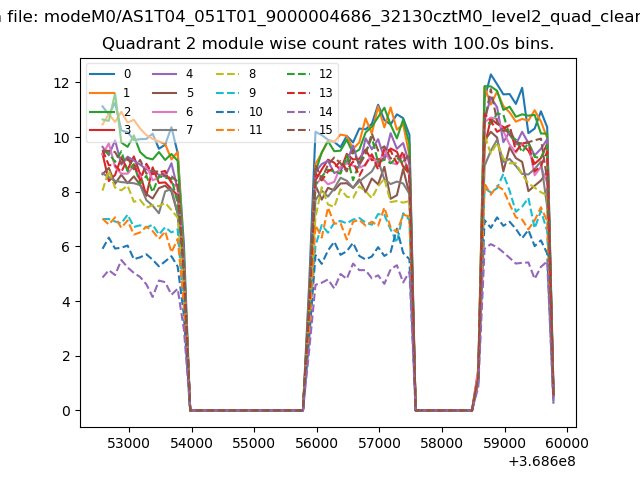
| Module-wise count rates for Quadrant B Data is divided into 100 sec bins |
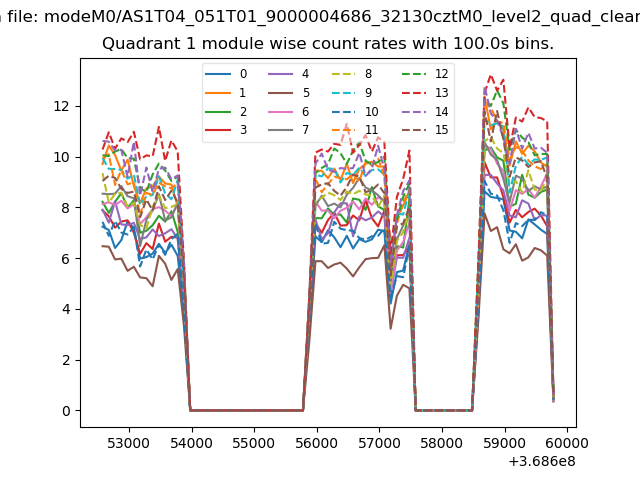 |
 |
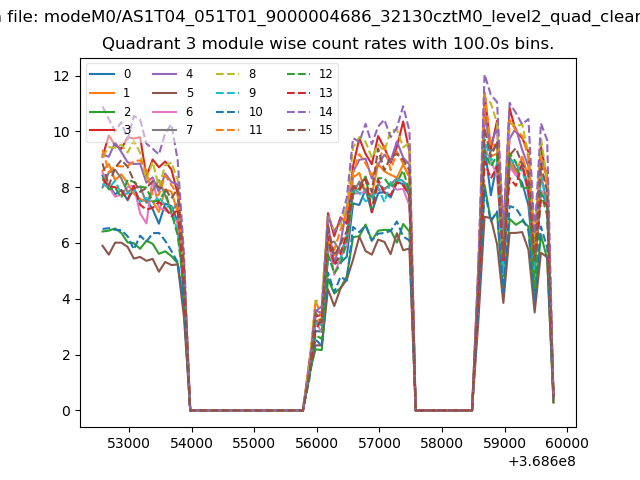
| Module-wise count rates for Quadrant C Data is divided into 100 sec bins |
 |
 |
| Module-wise count rates for Quadrant D Data is divided into 100 sec bins |
 |
 |
| Parameter | Plot |
|---|---|
| CZT HV Monitor | 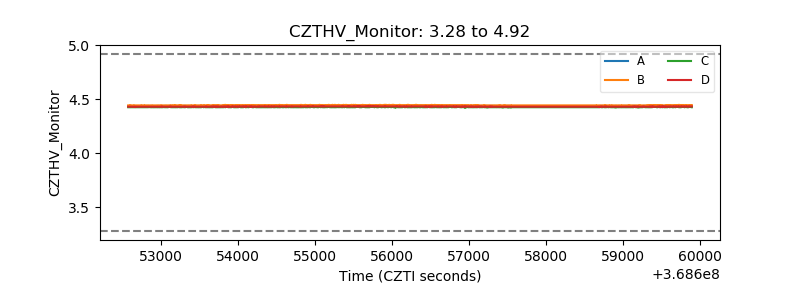 |
| D_VDD | 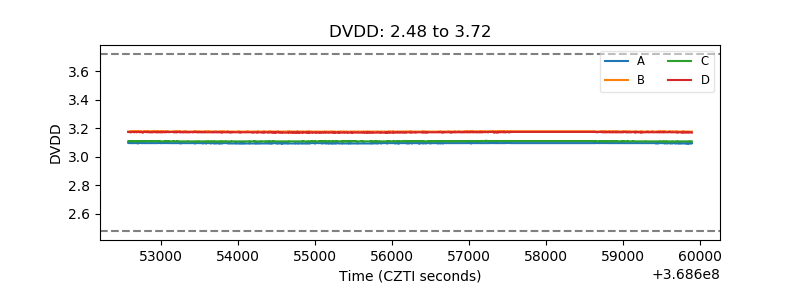 |
| Temperature 1 |  |
| Veto HV Monitor |  |
| Veto LLD | 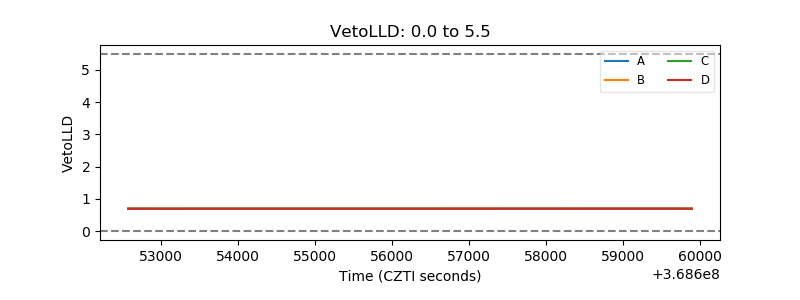 |
| Alpha Counter | 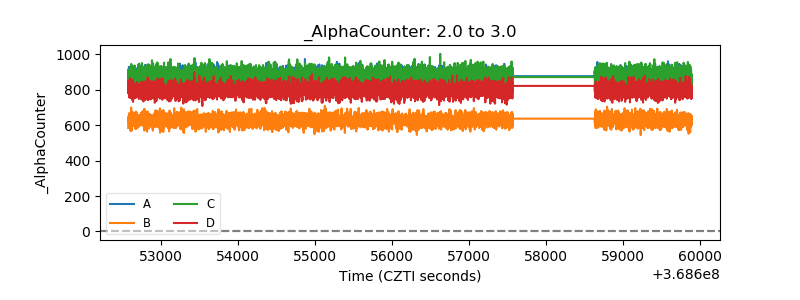 |
| _CPM_Rate | 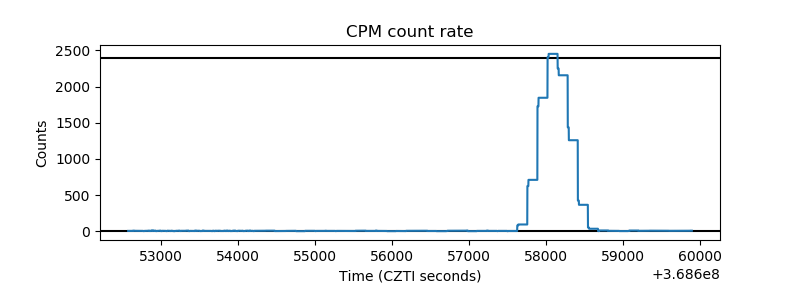 |
| CZT Counter | 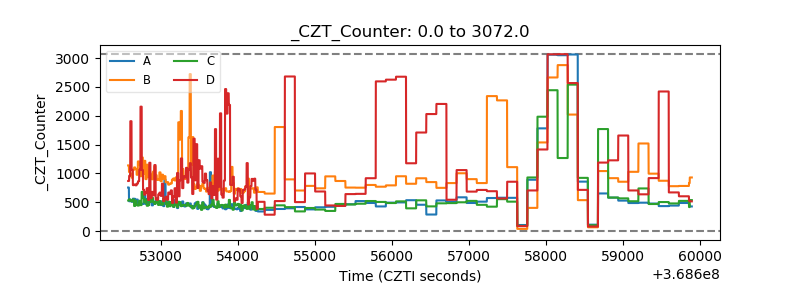 |
| +2.5 Volts monitor |  |
| +5 Volts monitor |  |
| _ROLL_ROT | 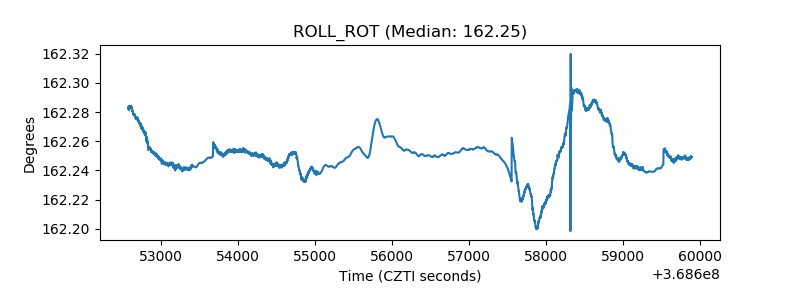 |
| _Roll_DEC |  |
| _Roll_RA | 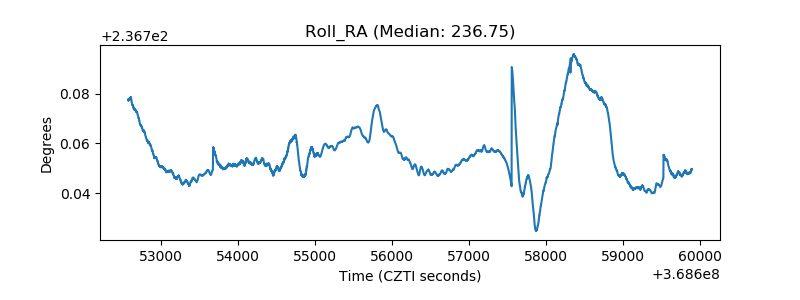 |
| Veto Counter | 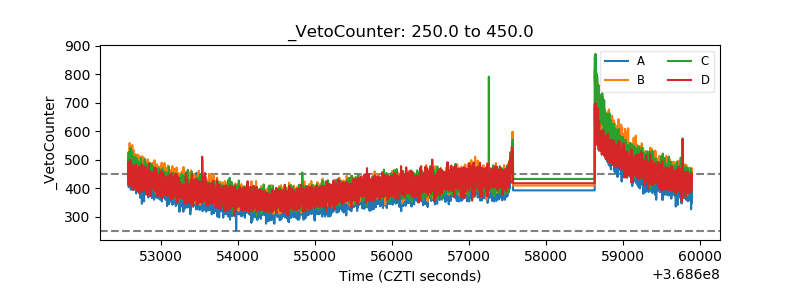 |