| Param | Original file | Final file |
|---|---|---|
| Filename | modeM0/AS1T04_051T01_9000004686_32132cztM0_level2.evt | modeM0/AS1T04_051T01_9000004686_32132cztM0_level2_quad_clean.evt |
| Size (bytes) | 611,176,320 | 87,448,320 |
| Size | 582.9 MB | 83.4 MB |
| Events in quadrant A | 3,145,728 | 574,841 |
| Events in quadrant B | 6,154,032 | 565,813 |
| Events in quadrant C | 3,778,514 | 545,455 |
| Events in quadrant D | 5,005,826 | 522,267 |
| Mode M9 | |||
|---|---|---|---|
| Quadrant | BADHDUFLAG | Total packets | Discarded packets |
| A | 0 | 17 | 0 |
| B | 0 | 18 | 0 |
| C | 0 | 18 | 0 |
| D | 0 | 18 | 0 |
| Mode M0 | |||
|---|---|---|---|
| Quadrant | BADHDUFLAG | Total packets | Discarded packets |
| A | 0 | 13231 | 2 |
| B | 0 | 22544 | 2 |
| C | 0 | 15107 | 2 |
| D | 0 | 19384 | 2 |
| Mode SS | |||
|---|---|---|---|
| Quadrant | BADHDUFLAG | Total packets | Discarded packets |
| A | 0 | 128 | 0 |
| B | 0 | 128 | 0 |
| C | 0 | 128 | 0 |
| D | 0 | 128 | 0 |
| Quadrant | Total seconds | Saturated seconds | Saturation percentage |
|---|---|---|---|
| A | 6298 | 10 | 0.158781% |
| B | 6298 | 276 | 4.382344% |
| C | 6297 | 246 | 3.906622% |
| D | 6297 | 226 | 3.589011% |
Noise dominated data is calculated using 1-second bins in cleaned event files. If a bin has >2000 counts, and if more than 50% of those come from <1% of pixels, then it is considered to be noise-dominated and hence unusable.
| Quadrant | # 1 sec bins | Bins with >0 counts | Bins with >2000 counts | High rate bins dominated by noise | Noise dominated (total time) | Noise dominated (detector-on time) | Marked lightcurve |
|---|---|---|---|---|---|---|---|
| A | 7493 | 6299 | 0 | 0 | 0.00% | 0.00% | 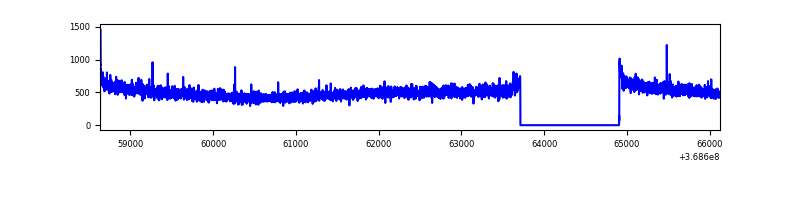 |
| B | 7493 | 6299 | 108 | 108 | 1.44% | 1.71% | 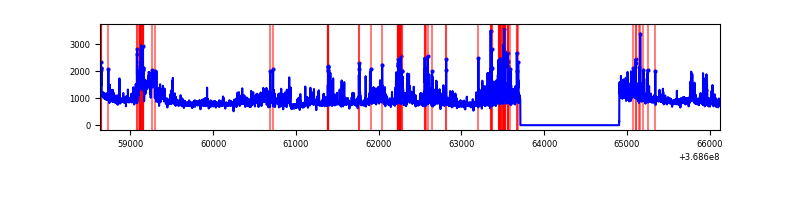 |
| C | 7492 | 6298 | 119 | 119 | 1.59% | 1.89% | 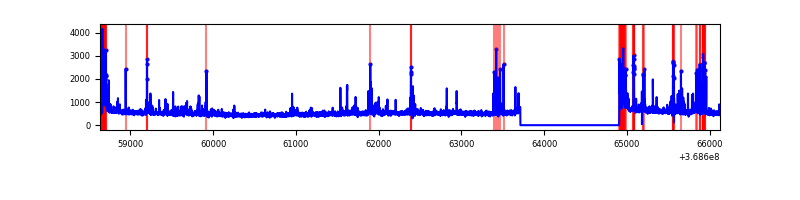 |
| D | 7492 | 6298 | 212 | 212 | 2.83% | 3.37% | 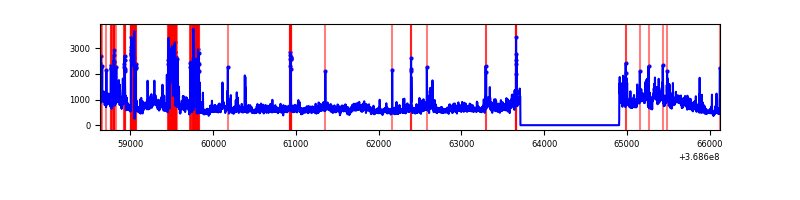 |
Top three noisy pixels from each quadrant. If the there are fewer than three noisy pixels in the level2.evt file, extra rows are filled as -1
| Pixel properties | Quadrant properties | ||||||
|---|---|---|---|---|---|---|---|
| Quadrant | DetID | PixID | Counts | Sigma | Mean | Median | Sigma |
| A | 13 | 6 | 17752 | 105.28 | 807 | 792 | 161.1 |
| A | 13 | 254 | 13647 | 79.8 | 807 | 792 | 161.1 |
| A | 0 | 6 | 10362 | 59.41 | 807 | 792 | 161.1 |
| B | 6 | 159 | 1794241 | 12039.03 | 794 | 776 | 149.0 |
| B | 10 | 245 | 910646 | 6107.7 | 794 | 776 | 149.0 |
| B | 5 | 172 | 147873 | 987.42 | 794 | 776 | 149.0 |
| C | 0 | 10 | 625007 | 3566.25 | 759 | 764 | 175.0 |
| C | 14 | 238 | 131107 | 744.64 | 759 | 764 | 175.0 |
| C | 4 | 175 | 25151 | 139.32 | 759 | 764 | 175.0 |
| D | 8 | 195 | 1389649 | 7581.74 | 760 | 738 | 183.2 |
| D | 12 | 233 | 492454 | 2684.16 | 760 | 738 | 183.2 |
| D | 7 | 38 | 143788 | 780.88 | 760 | 738 | 183.2 |
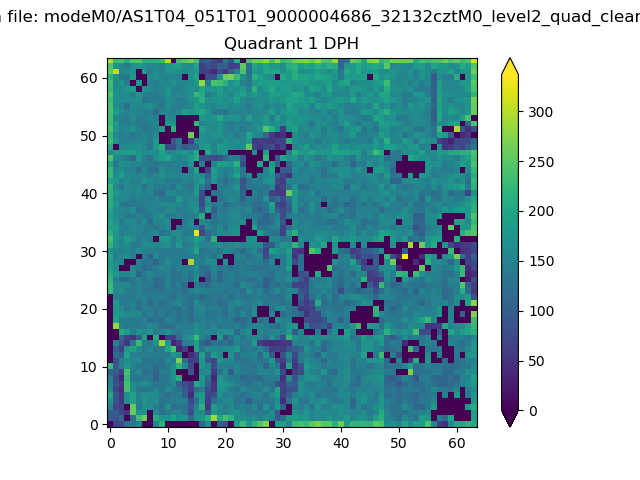
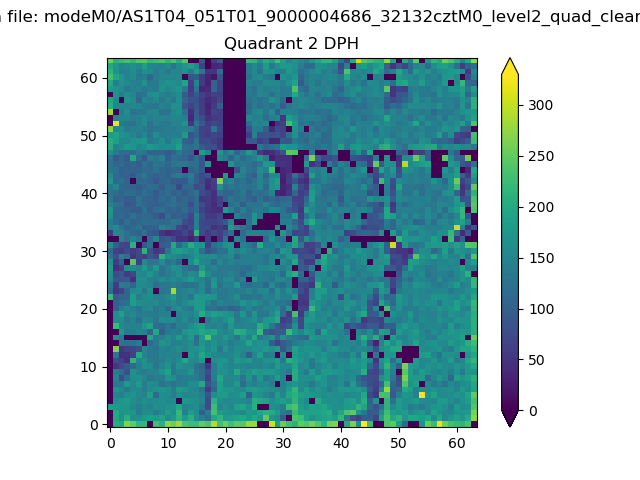
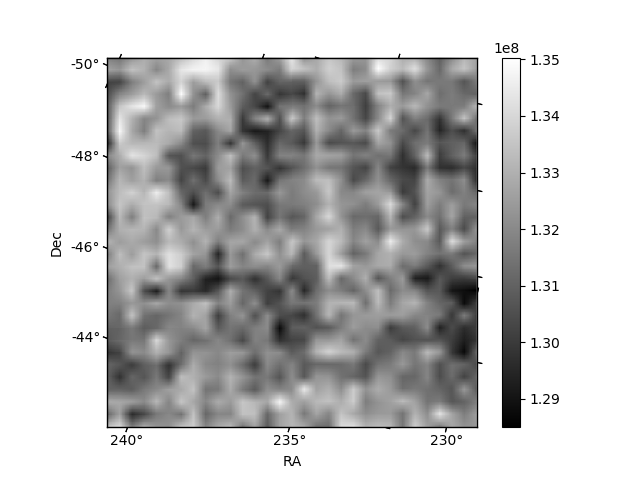
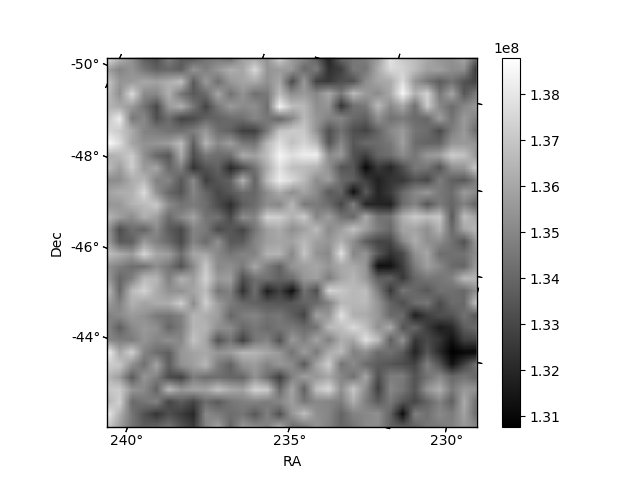
Histogram calculated using DETX and DETY for each event in the final _common_clean file
| Quadrant A |  |
 |
Quadrant B |
|---|---|---|---|
| Quadrant D |  |
 |
Quadrant C |
| Plot type | Count rate plots | Images |
|---|---|---|
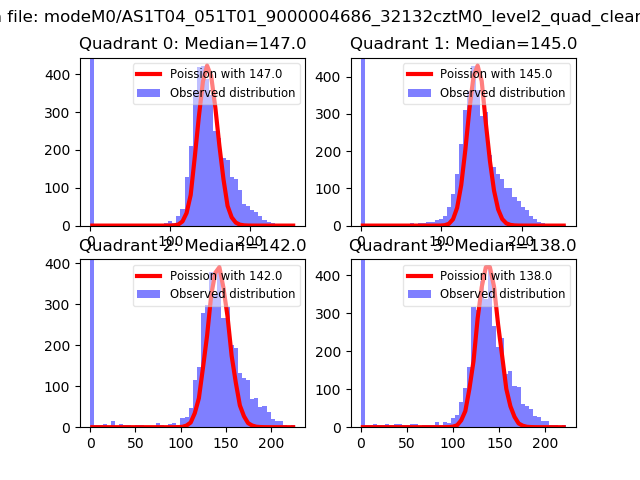
| Comparison with Poisson distribution Blue bars denote a histogram of data divided into 1 sec bins. Red curve is a Poisson curve with rate = median count rate of data. |
 |
 |
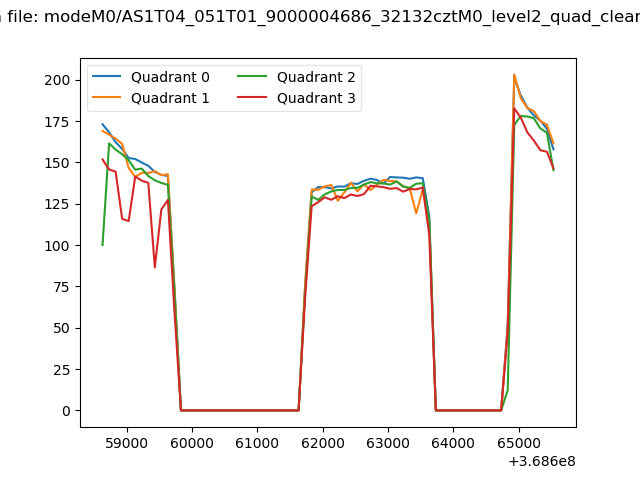
| Quadrant-wise count rates Data is divided into 100 sec bins |
 |
|
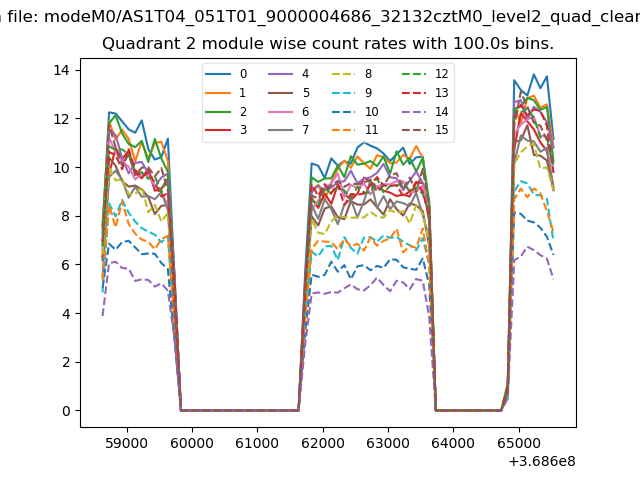
| Module-wise count rates for Quadrant A Data is divided into 100 sec bins |
 |
 |
| Module-wise count rates for Quadrant B Data is divided into 100 sec bins |
 |
 |
| Module-wise count rates for Quadrant C Data is divided into 100 sec bins |
 |
 |
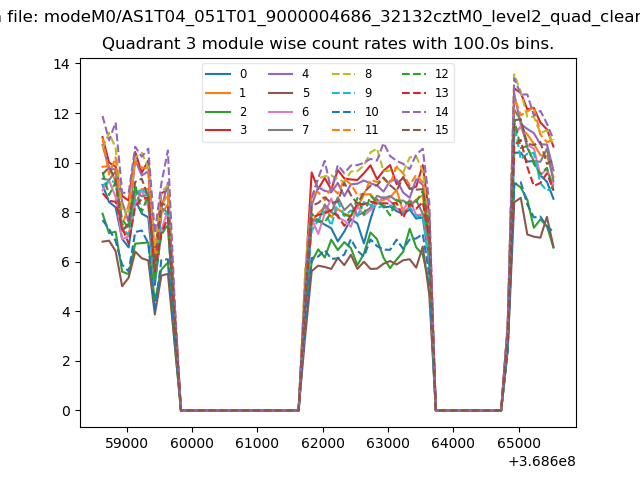
| Module-wise count rates for Quadrant D Data is divided into 100 sec bins |
 |
 |
| Parameter | Plot |
|---|---|
| CZT HV Monitor | 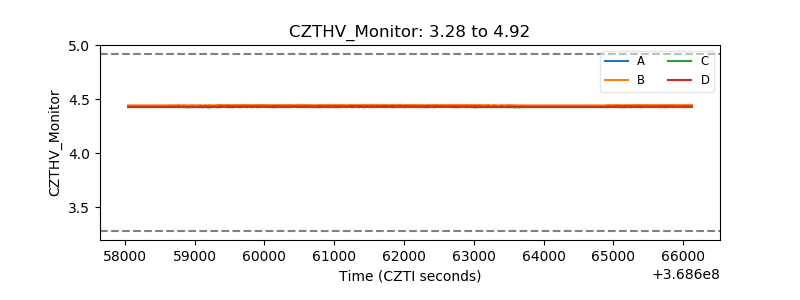 |
| D_VDD | 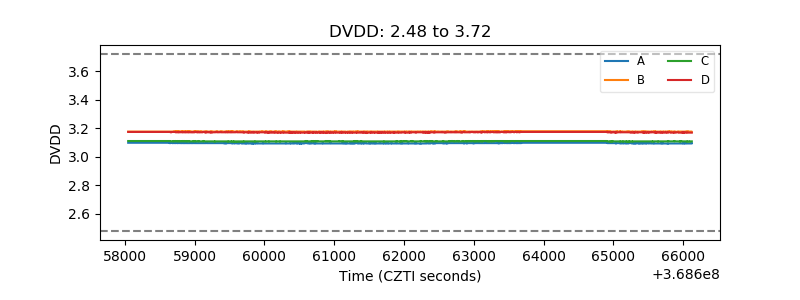 |
| Temperature 1 | 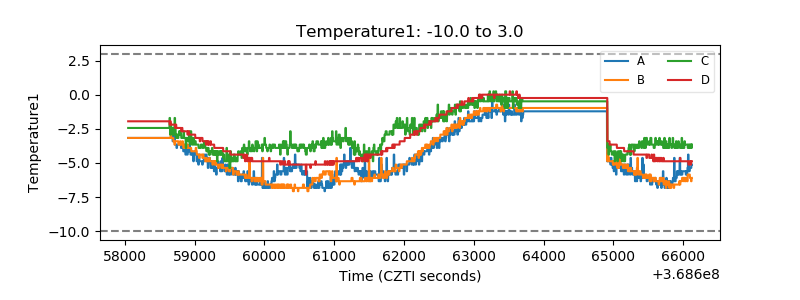 |
| Veto HV Monitor | 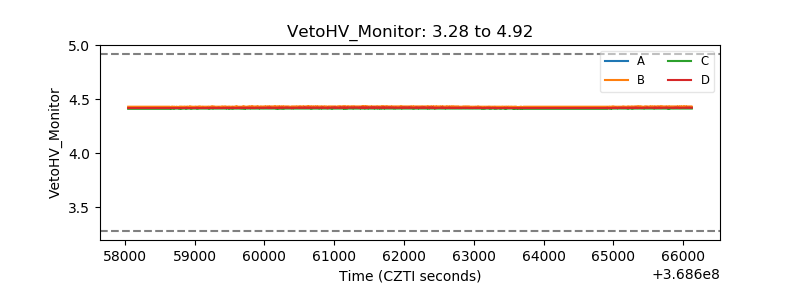 |
| Veto LLD | 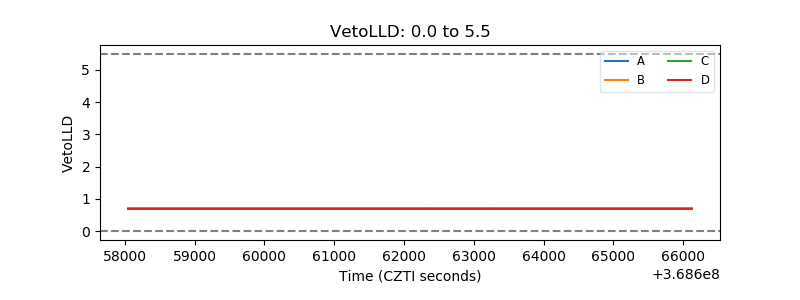 |
| Alpha Counter | 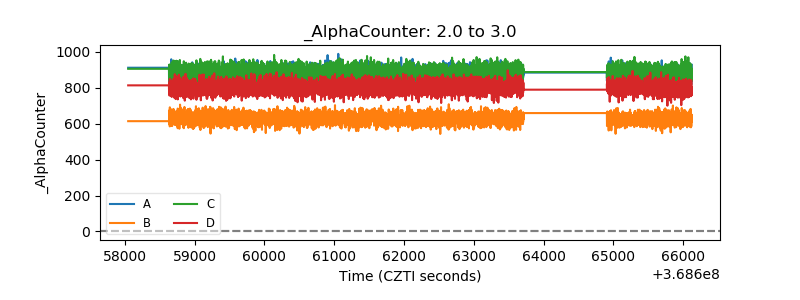 |
| _CPM_Rate | 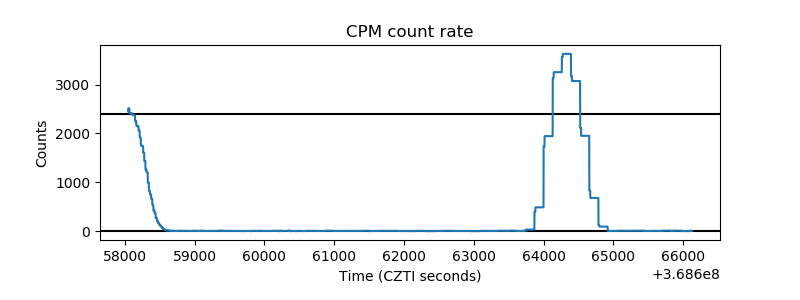 |
| CZT Counter | 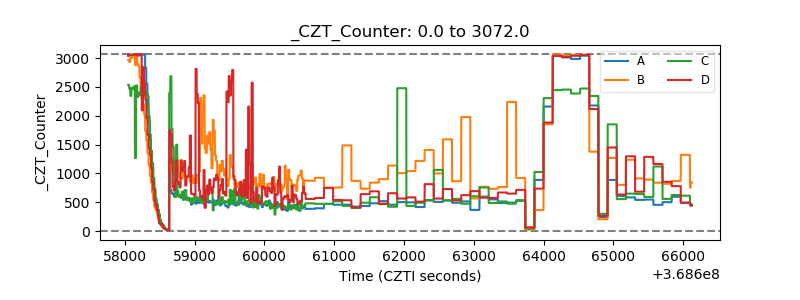 |
| +2.5 Volts monitor |  |
| +5 Volts monitor | 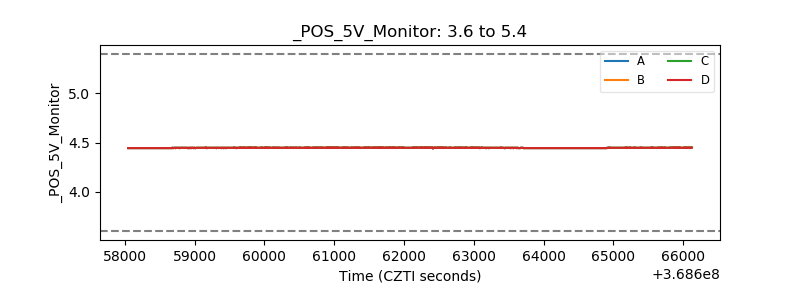 |
| _ROLL_ROT | 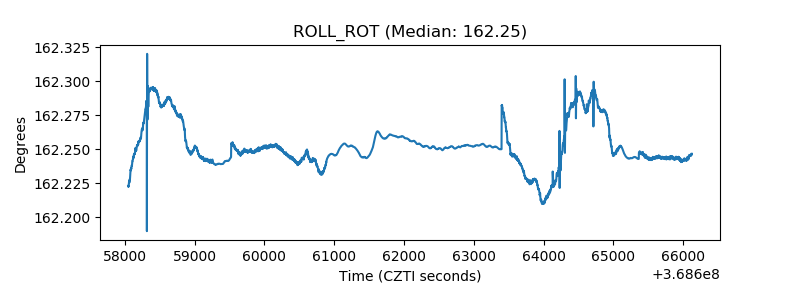 |
| _Roll_DEC | 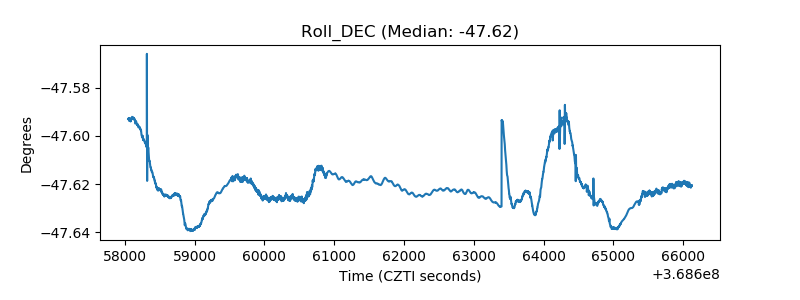 |
| _Roll_RA | 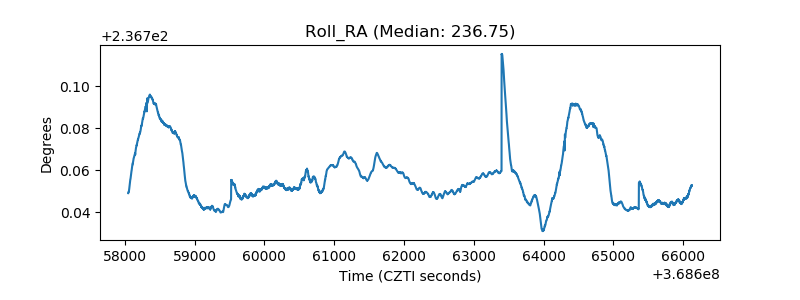 |
| Veto Counter | 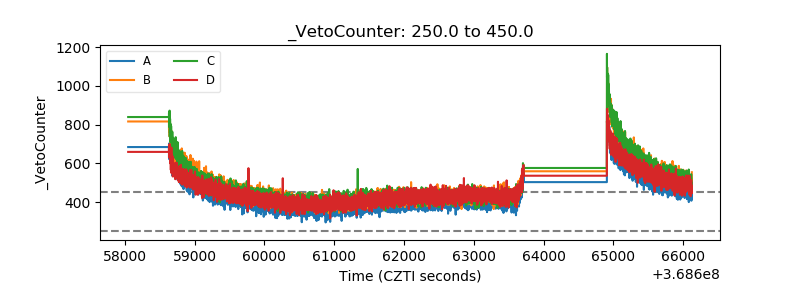 |