| Param | Original file | Final file |
|---|---|---|
| Filename | modeM0/AS1T04_051T01_9000004686_32133cztM0_level2.evt | modeM0/AS1T04_051T01_9000004686_32133cztM0_level2_quad_clean.evt |
| Size (bytes) | 699,831,360 | 79,329,600 |
| Size | 667.4 MB | 75.7 MB |
| Events in quadrant A | 3,276,953 | 518,044 |
| Events in quadrant B | 8,475,170 | 488,031 |
| Events in quadrant C | 3,868,118 | 490,477 |
| Events in quadrant D | 5,152,971 | 469,903 |
| Mode M9 | |||
|---|---|---|---|
| Quadrant | BADHDUFLAG | Total packets | Discarded packets |
| A | 0 | 16 | 0 |
| B | 0 | 17 | 0 |
| C | 0 | 17 | 0 |
| D | 0 | 17 | 0 |
| Mode M0 | |||
|---|---|---|---|
| Quadrant | BADHDUFLAG | Total packets | Discarded packets |
| A | 0 | 13427 | 2 |
| B | 0 | 29487 | 2 |
| C | 0 | 15319 | 2 |
| D | 0 | 19533 | 2 |
| Mode SS | |||
|---|---|---|---|
| Quadrant | BADHDUFLAG | Total packets | Discarded packets |
| A | 0 | 126 | 0 |
| B | 0 | 126 | 0 |
| C | 0 | 126 | 0 |
| D | 0 | 126 | 0 |
| Quadrant | Total seconds | Saturated seconds | Saturation percentage |
|---|---|---|---|
| A | 6238 | 26 | 0.416800% |
| B | 6238 | 1817 | 29.127926% |
| C | 6238 | 307 | 4.921449% |
| D | 6238 | 284 | 4.552741% |
Noise dominated data is calculated using 1-second bins in cleaned event files. If a bin has >2000 counts, and if more than 50% of those come from <1% of pixels, then it is considered to be noise-dominated and hence unusable.
| Quadrant | # 1 sec bins | Bins with >0 counts | Bins with >2000 counts | High rate bins dominated by noise | Noise dominated (total time) | Noise dominated (detector-on time) | Marked lightcurve |
|---|---|---|---|---|---|---|---|
| A | 7538 | 6239 | 0 | 0 | 0.00% | 0.00% | 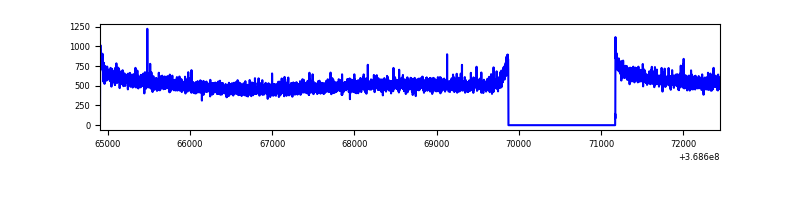 |
| B | 7538 | 6239 | 1492 | 1492 | 19.79% | 23.91% | 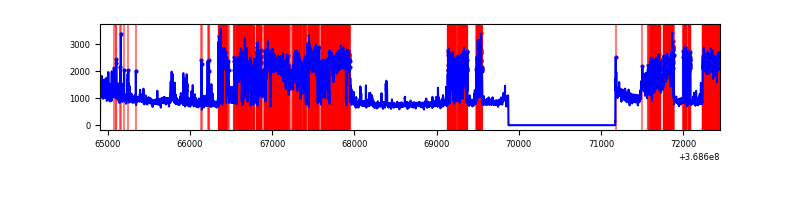 |
| C | 7538 | 6239 | 121 | 121 | 1.61% | 1.94% | 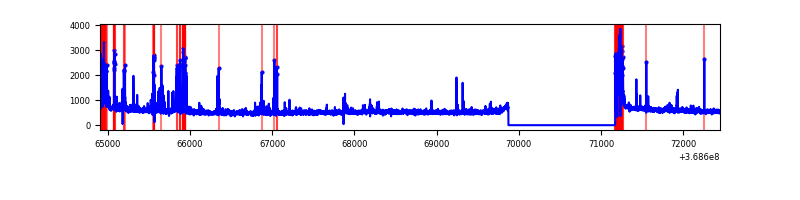 |
| D | 7538 | 6239 | 237 | 237 | 3.14% | 3.80% | 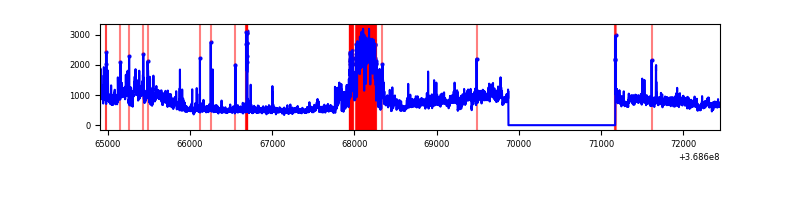 |
Top three noisy pixels from each quadrant. If the there are fewer than three noisy pixels in the level2.evt file, extra rows are filled as -1
| Pixel properties | Quadrant properties | ||||||
|---|---|---|---|---|---|---|---|
| Quadrant | DetID | PixID | Counts | Sigma | Mean | Median | Sigma |
| A | 13 | 6 | 19871 | 116.1 | 842 | 831 | 164.0 |
| A | 13 | 254 | 11561 | 65.43 | 842 | 831 | 164.0 |
| A | 3 | 137 | 7853 | 42.82 | 842 | 831 | 164.0 |
| B | 10 | 245 | 3366926 | 24007.38 | 765 | 751 | 140.2 |
| B | 6 | 159 | 1567885 | 11176.72 | 765 | 751 | 140.2 |
| B | 5 | 172 | 336899 | 2397.39 | 765 | 751 | 140.2 |
| C | 0 | 10 | 523186 | 2832.08 | 800 | 809 | 184.4 |
| C | 14 | 238 | 151278 | 815.77 | 800 | 809 | 184.4 |
| C | 14 | 254 | 27486 | 144.63 | 800 | 809 | 184.4 |
| D | 8 | 195 | 1275349 | 6844.54 | 797 | 778 | 186.2 |
| D | 12 | 233 | 632547 | 3392.64 | 797 | 778 | 186.2 |
| D | 12 | 227 | 174258 | 931.6 | 797 | 778 | 186.2 |
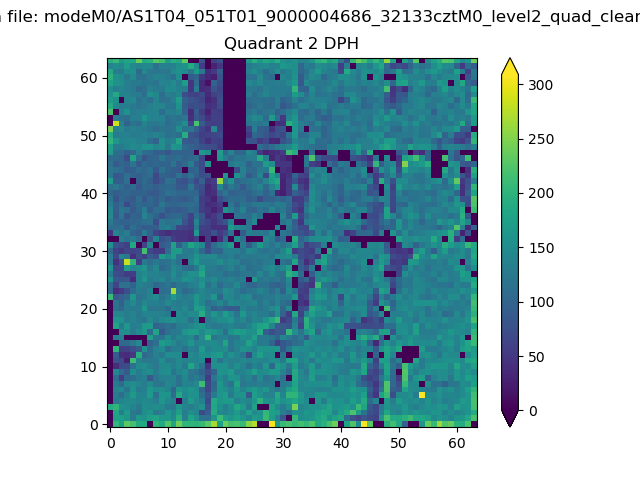
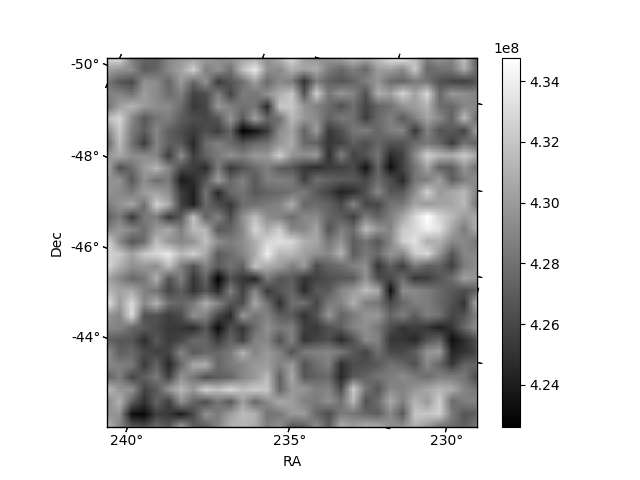
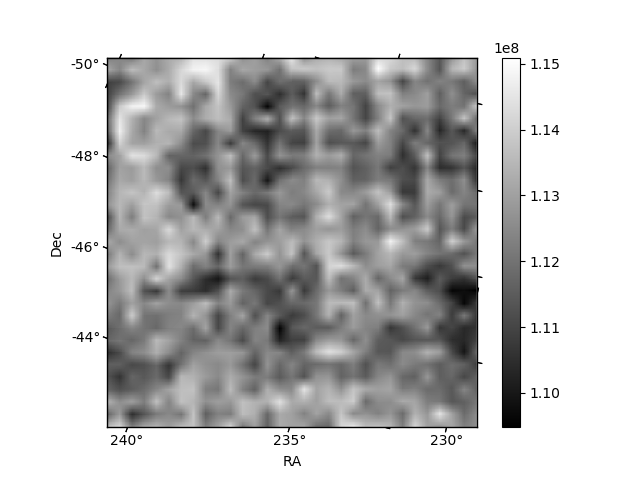
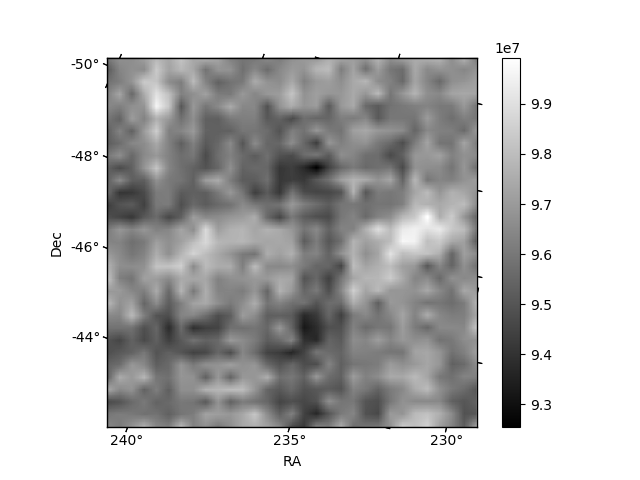
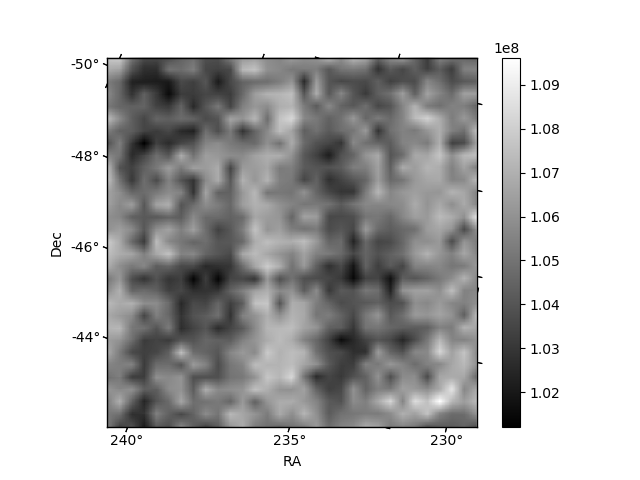
Histogram calculated using DETX and DETY for each event in the final _common_clean file
| Quadrant A | 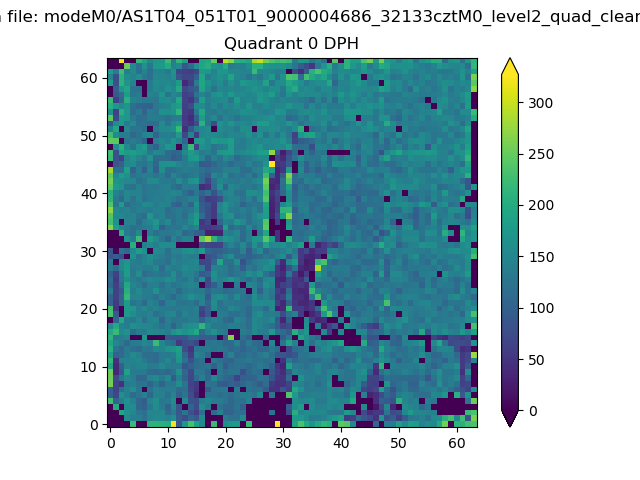 |
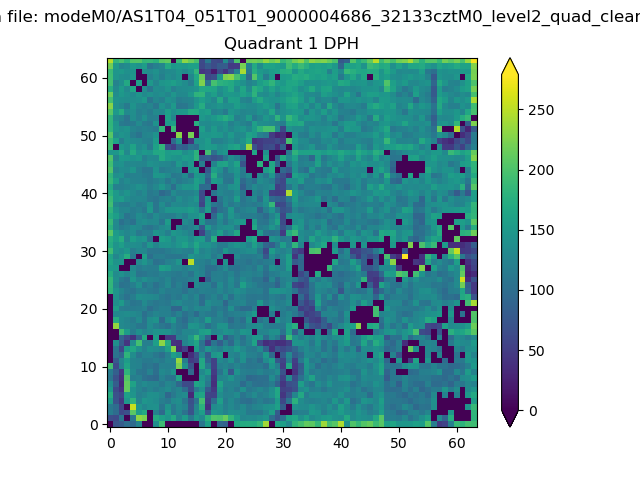 |
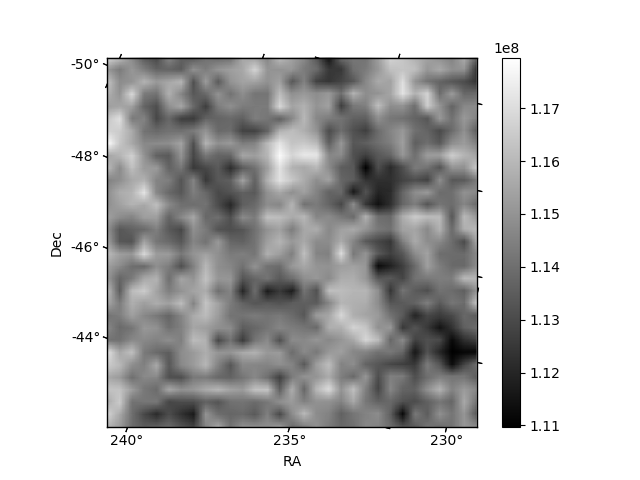
Quadrant B |
|---|---|---|---|
| Quadrant D | 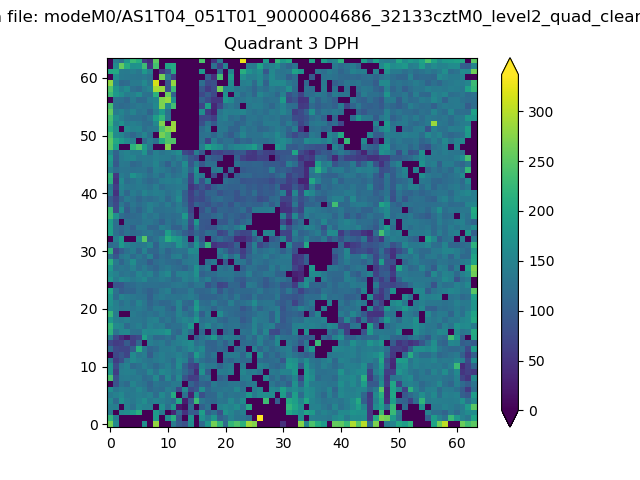 |
 |
Quadrant C |
| Plot type | Count rate plots | Images |
|---|---|---|
| Comparison with Poisson distribution Blue bars denote a histogram of data divided into 1 sec bins. Red curve is a Poisson curve with rate = median count rate of data. |
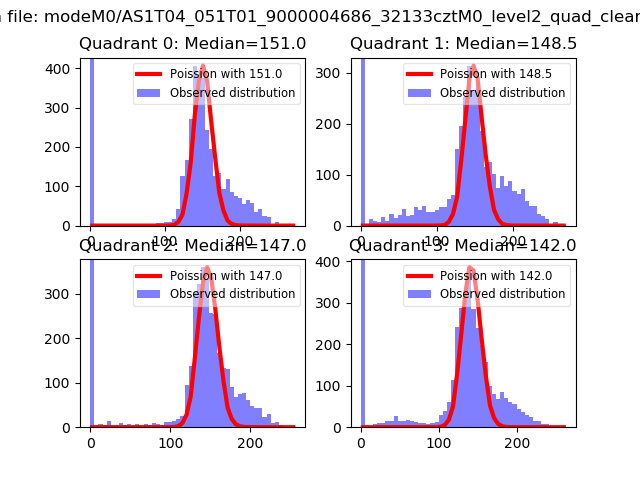 |
 |
| Quadrant-wise count rates Data is divided into 100 sec bins |
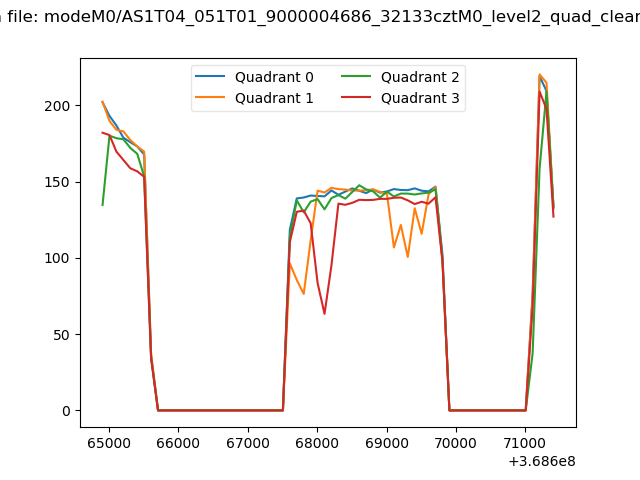 |
|
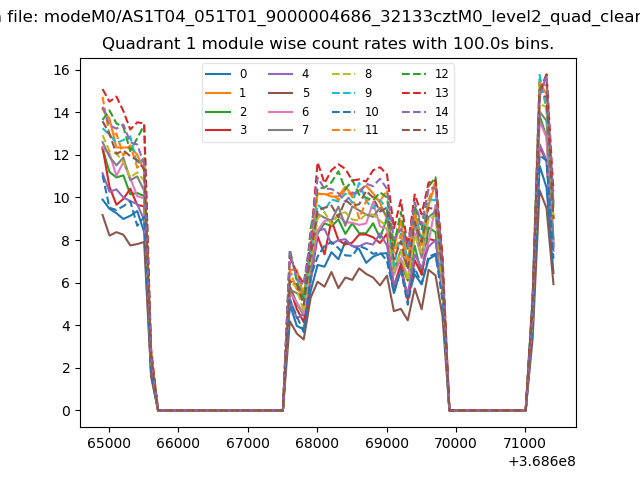
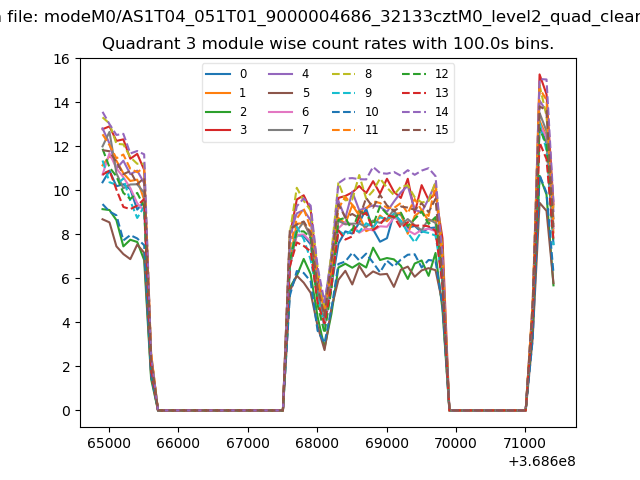
| Module-wise count rates for Quadrant A Data is divided into 100 sec bins |
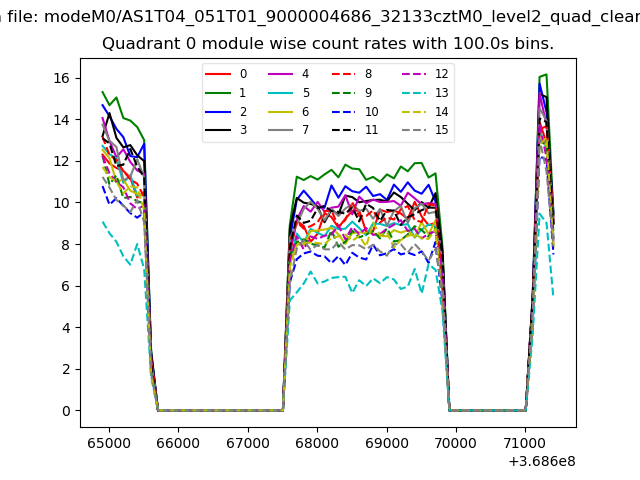 |
 |
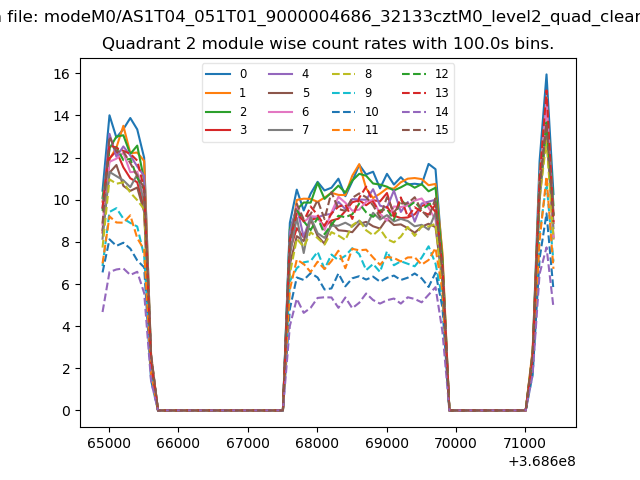
| Module-wise count rates for Quadrant B Data is divided into 100 sec bins |
 |
 |
| Module-wise count rates for Quadrant C Data is divided into 100 sec bins |
 |
 |
| Module-wise count rates for Quadrant D Data is divided into 100 sec bins |
 |
 |
| Parameter | Plot |
|---|---|
| CZT HV Monitor | 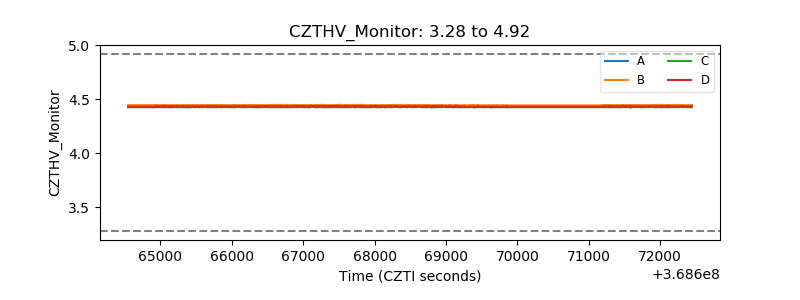 |
| D_VDD | 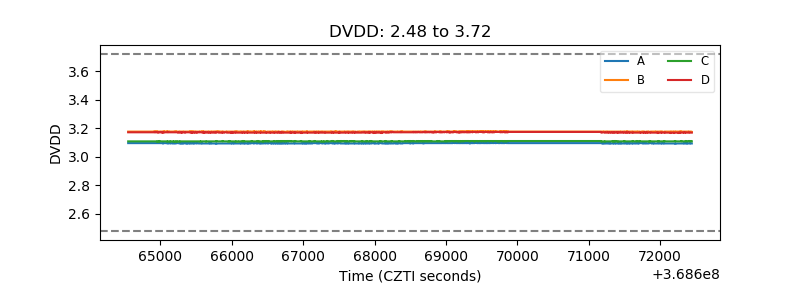 |
| Temperature 1 | 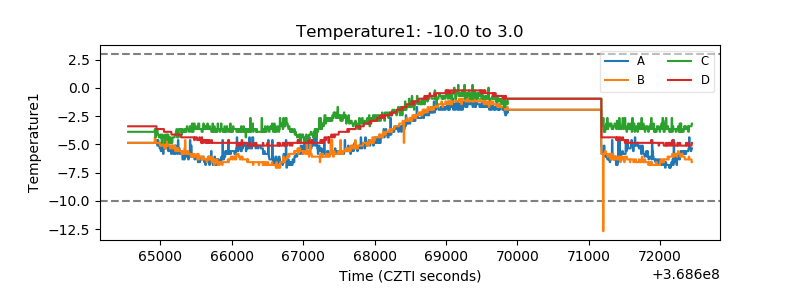 |
| Veto HV Monitor | 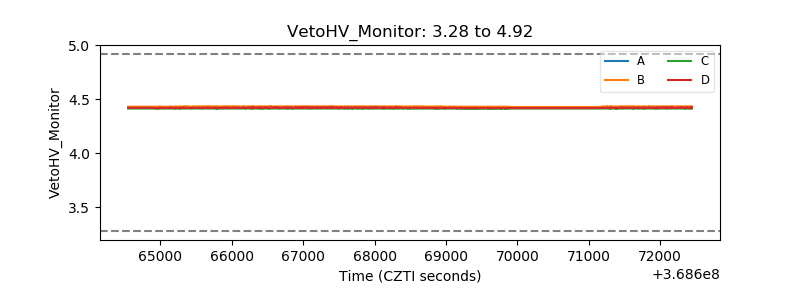 |
| Veto LLD | 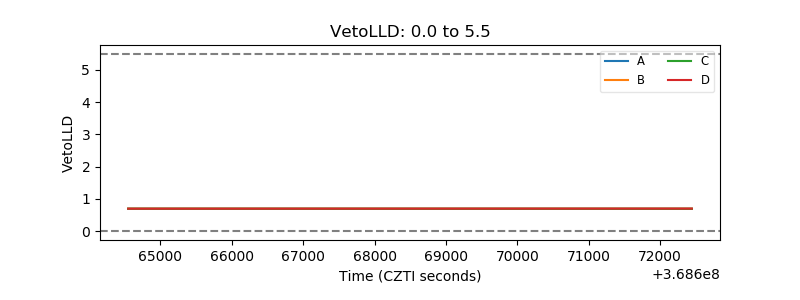 |
| Alpha Counter | 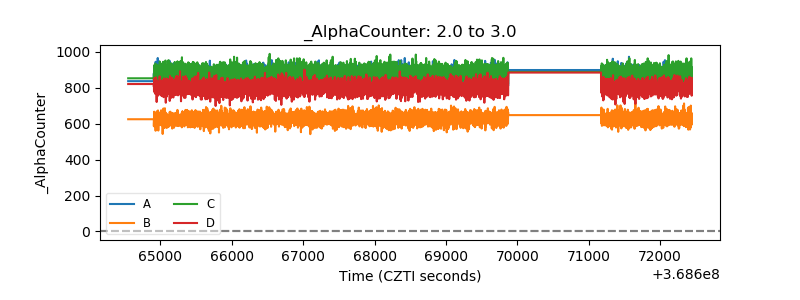 |
| _CPM_Rate | 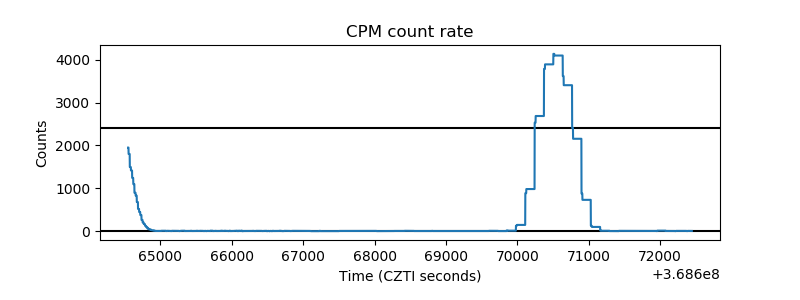 |
| CZT Counter | 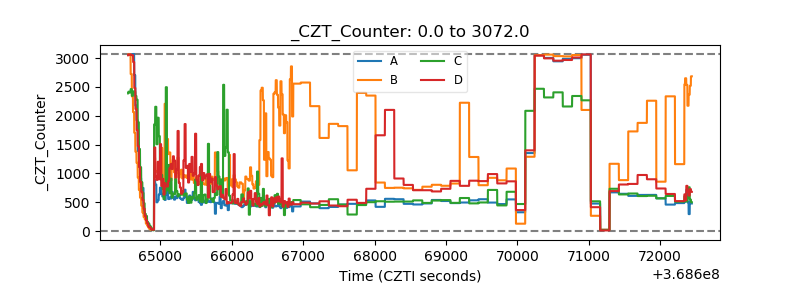 |
| +2.5 Volts monitor |  |
| +5 Volts monitor |  |
| _ROLL_ROT | 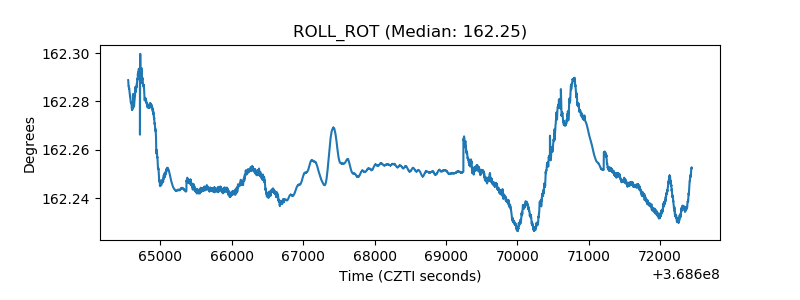 |
| _Roll_DEC | 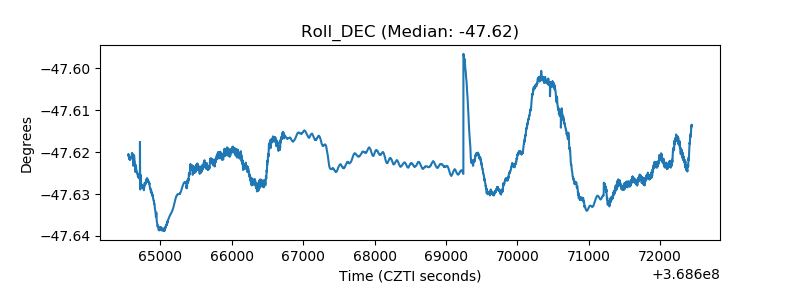 |
| _Roll_RA | 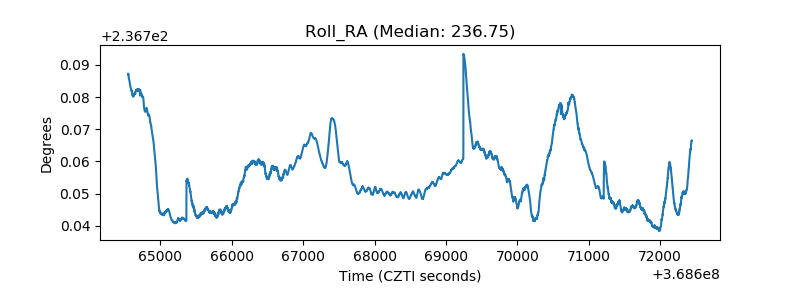 |
| Veto Counter | 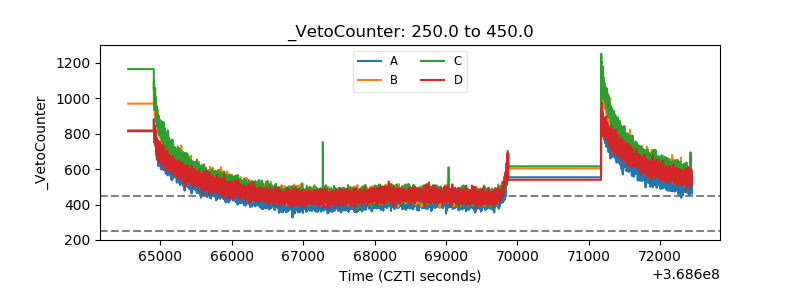 |