| Param | Original file | Final file |
|---|---|---|
| Filename | modeM0/AS1T04_051T01_9000004686_32135cztM0_level2.evt | modeM0/AS1T04_051T01_9000004686_32135cztM0_level2_quad_clean.evt |
| Size (bytes) | 641,871,360 | 72,993,600 |
| Size | 612.1 MB | 69.6 MB |
| Events in quadrant A | 3,510,409 | 454,951 |
| Events in quadrant B | 6,864,836 | 426,787 |
| Events in quadrant C | 3,936,064 | 451,929 |
| Events in quadrant D | 4,702,034 | 436,358 |
| Mode M9 | |||
|---|---|---|---|
| Quadrant | BADHDUFLAG | Total packets | Discarded packets |
| A | 0 | 19 | 0 |
| B | 0 | 20 | 0 |
| C | 0 | 20 | 0 |
| D | 0 | 20 | 0 |
| Mode M0 | |||
|---|---|---|---|
| Quadrant | BADHDUFLAG | Total packets | Discarded packets |
| A | 0 | 14070 | 2 |
| B | 0 | 24591 | 2 |
| C | 0 | 15680 | 2 |
| D | 0 | 18559 | 4 |
| Mode SS | |||
|---|---|---|---|
| Quadrant | BADHDUFLAG | Total packets | Discarded packets |
| A | 0 | 130 | 0 |
| B | 0 | 130 | 0 |
| C | 0 | 130 | 0 |
| D | 0 | 130 | 0 |
| Quadrant | Total seconds | Saturated seconds | Saturation percentage |
|---|---|---|---|
| A | 6298 | 48 | 0.762147% |
| B | 6298 | 674 | 10.701810% |
| C | 6298 | 263 | 4.175929% |
| D | 6297 | 142 | 2.255042% |
Noise dominated data is calculated using 1-second bins in cleaned event files. If a bin has >2000 counts, and if more than 50% of those come from <1% of pixels, then it is considered to be noise-dominated and hence unusable.
| Quadrant | # 1 sec bins | Bins with >0 counts | Bins with >2000 counts | High rate bins dominated by noise | Noise dominated (total time) | Noise dominated (detector-on time) | Marked lightcurve |
|---|---|---|---|---|---|---|---|
| A | 7673 | 6299 | 0 | 0 | 0.00% | 0.00% | 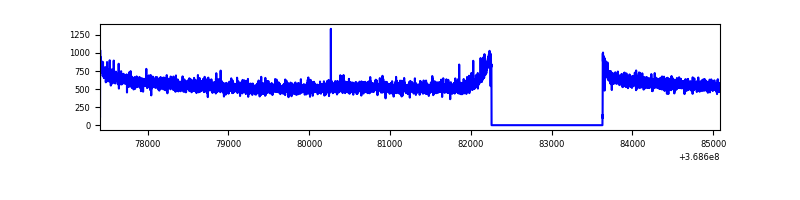 |
| B | 7673 | 6299 | 374 | 374 | 4.87% | 5.94% | 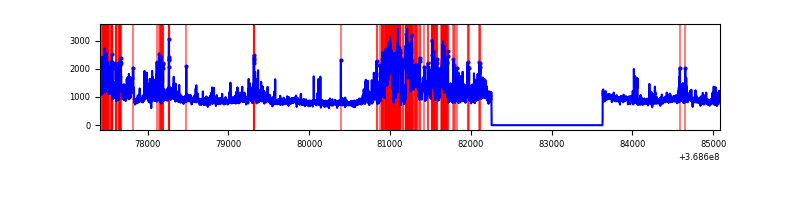 |
| C | 7673 | 6299 | 52 | 52 | 0.68% | 0.83% | 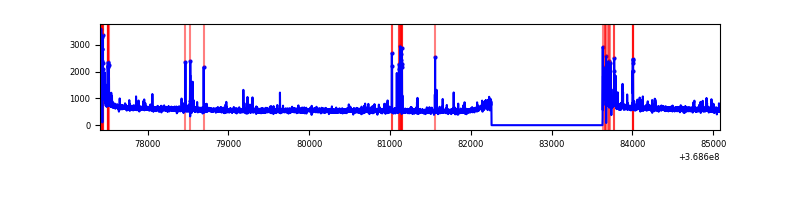 |
| D | 7672 | 6298 | 75 | 75 | 0.98% | 1.19% | 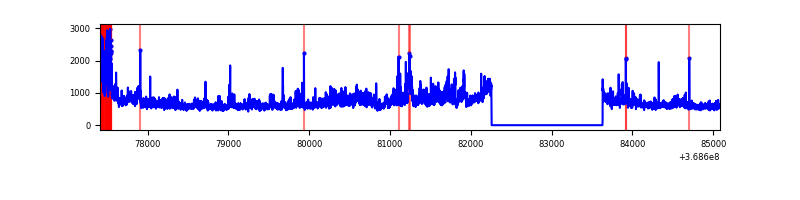 |
Top three noisy pixels from each quadrant. If the there are fewer than three noisy pixels in the level2.evt file, extra rows are filled as -1
| Pixel properties | Quadrant properties | ||||||
|---|---|---|---|---|---|---|---|
| Quadrant | DetID | PixID | Counts | Sigma | Mean | Median | Sigma |
| A | 13 | 6 | 12151 | 63.37 | 907 | 894 | 177.6 |
| A | 13 | 254 | 12043 | 62.76 | 907 | 894 | 177.6 |
| A | 3 | 137 | 7982 | 39.9 | 907 | 894 | 177.6 |
| B | 6 | 159 | 1672170 | 10565.99 | 872 | 854 | 158.2 |
| B | 10 | 245 | 1372709 | 8672.81 | 872 | 854 | 158.2 |
| B | 5 | 172 | 296821 | 1871.09 | 872 | 854 | 158.2 |
| C | 0 | 10 | 320325 | 1607.53 | 875 | 884 | 198.7 |
| C | 14 | 238 | 153347 | 767.24 | 875 | 884 | 198.7 |
| C | 4 | 175 | 22443 | 108.49 | 875 | 884 | 198.7 |
| D | 8 | 195 | 1075186 | 5210.64 | 879 | 856 | 206.2 |
| D | 12 | 227 | 167350 | 807.52 | 879 | 856 | 206.2 |
| D | 2 | 250 | 58207 | 278.16 | 879 | 856 | 206.2 |
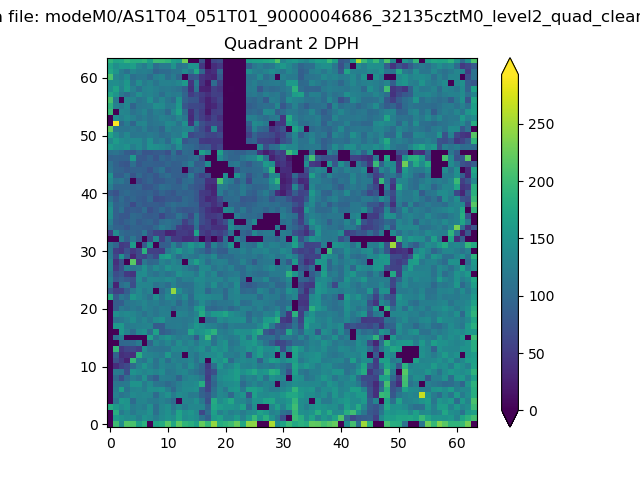
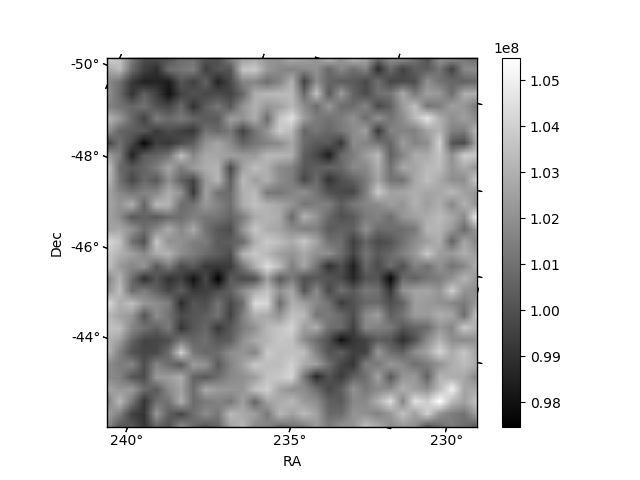
Histogram calculated using DETX and DETY for each event in the final _common_clean file
| Quadrant A | 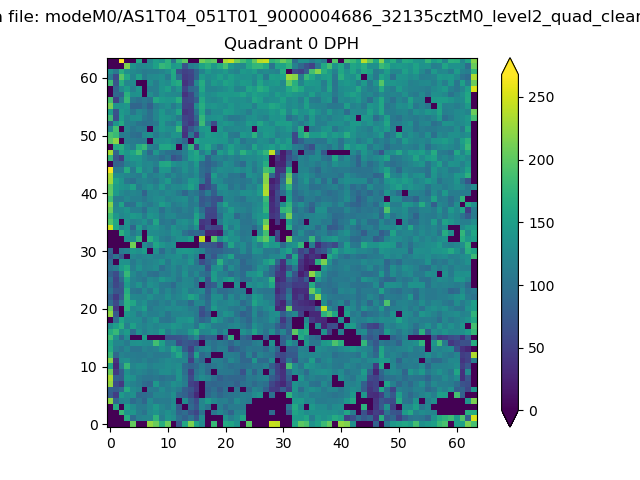 |
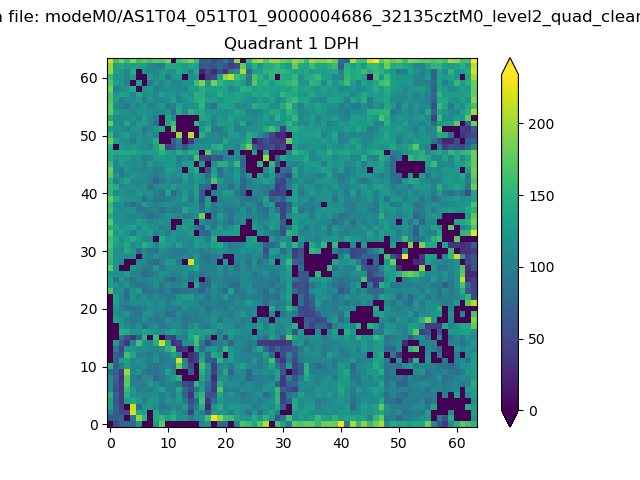 |
Quadrant B |
|---|---|---|---|
| Quadrant D | 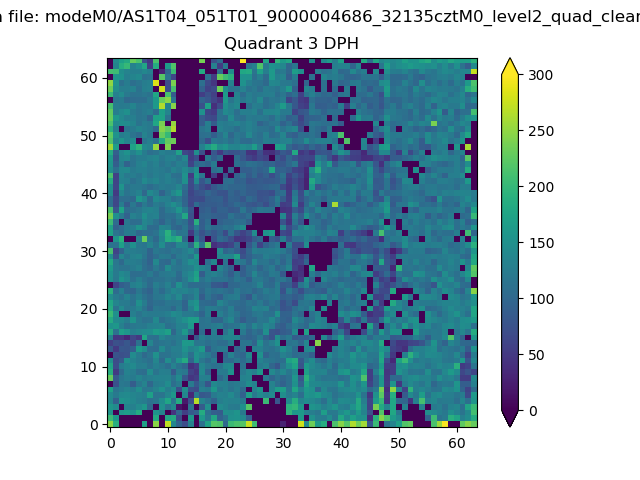 |
 |
Quadrant C |
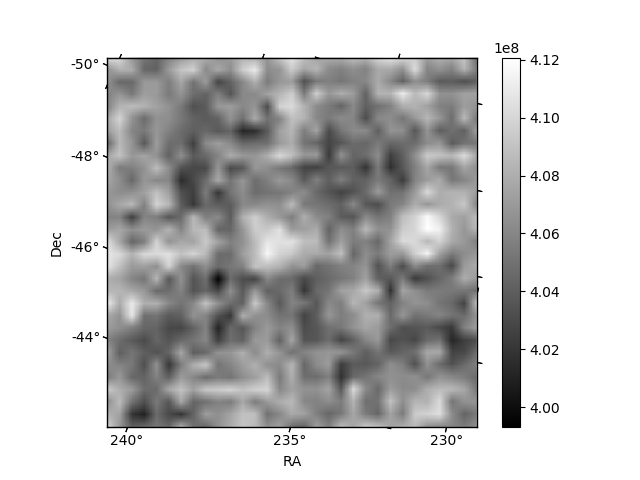
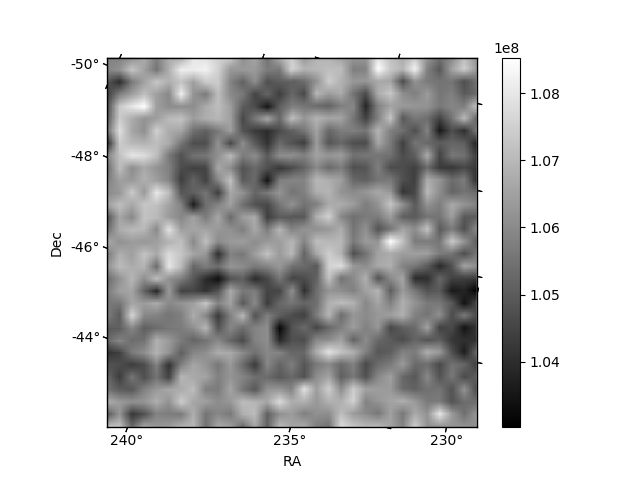
| Plot type | Count rate plots | Images |
|---|---|---|
| Comparison with Poisson distribution Blue bars denote a histogram of data divided into 1 sec bins. Red curve is a Poisson curve with rate = median count rate of data. |
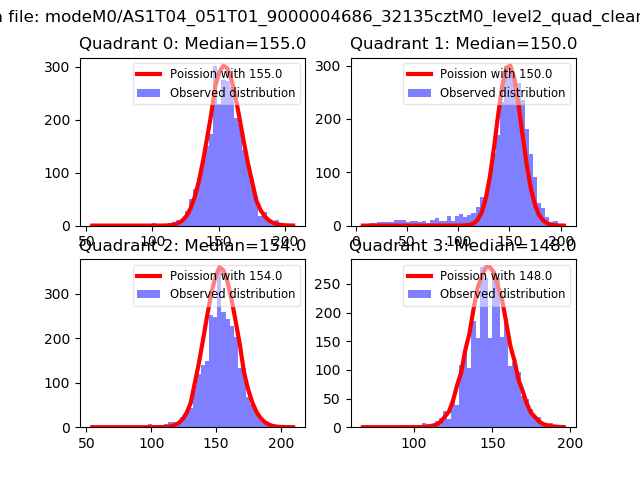 |
 |
| Quadrant-wise count rates Data is divided into 100 sec bins |
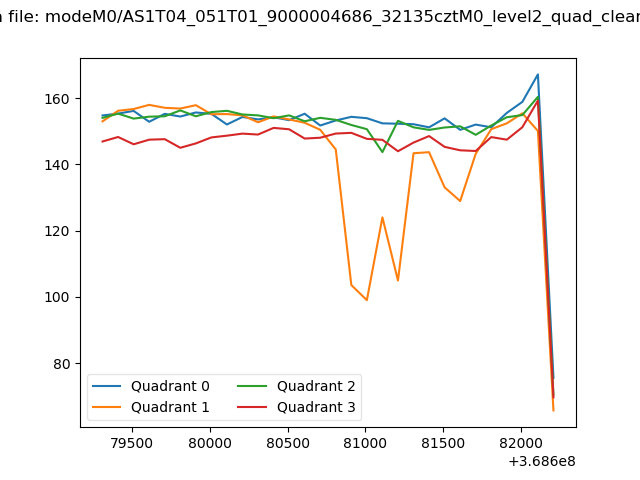 |
|
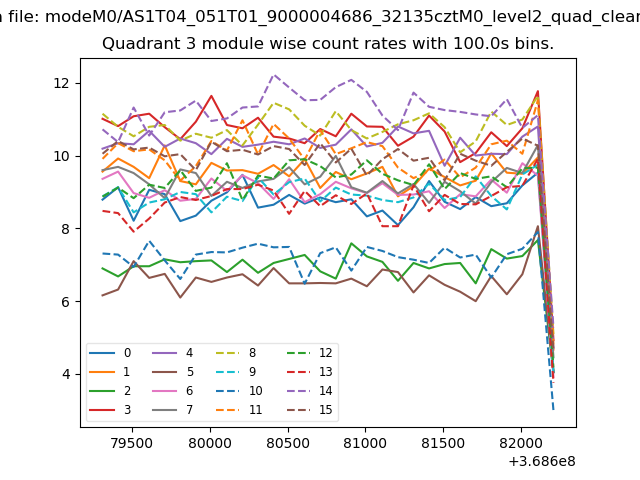
| Module-wise count rates for Quadrant A Data is divided into 100 sec bins |
 |
 |
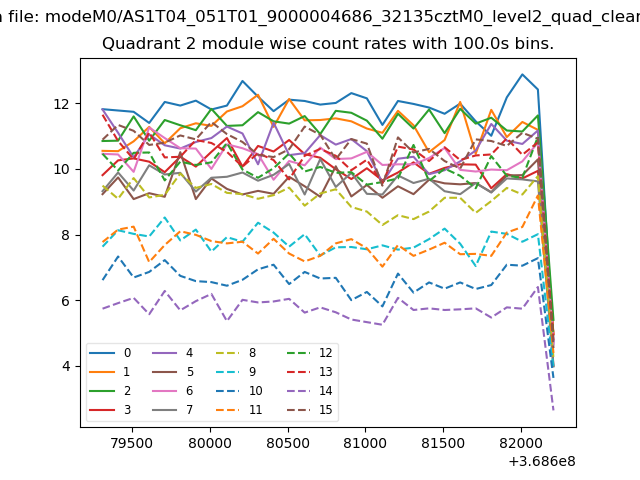
| Module-wise count rates for Quadrant B Data is divided into 100 sec bins |
 |
 |
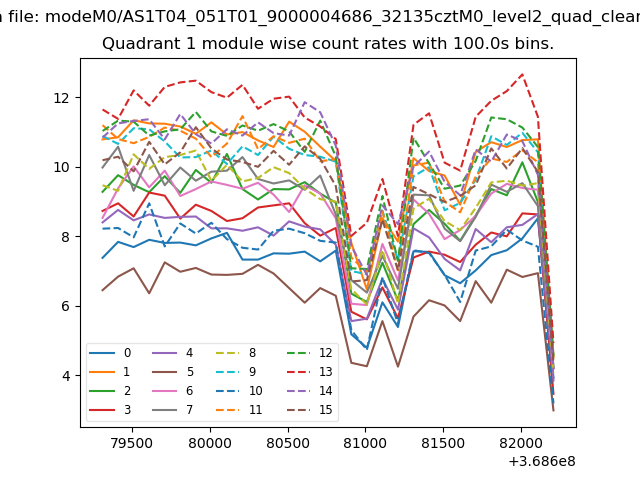
| Module-wise count rates for Quadrant C Data is divided into 100 sec bins |
 |
 |
| Module-wise count rates for Quadrant D Data is divided into 100 sec bins |
 |
 |
| Parameter | Plot |
|---|---|
| CZT HV Monitor | 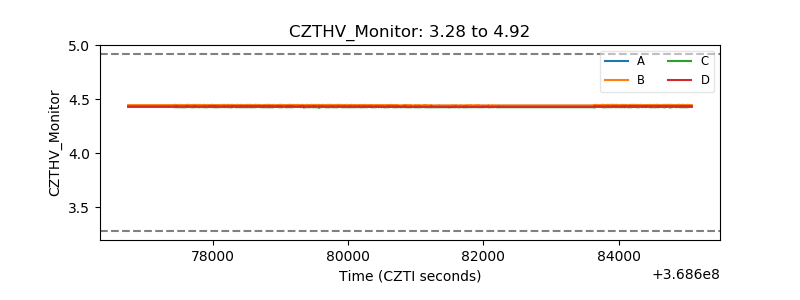 |
| D_VDD | 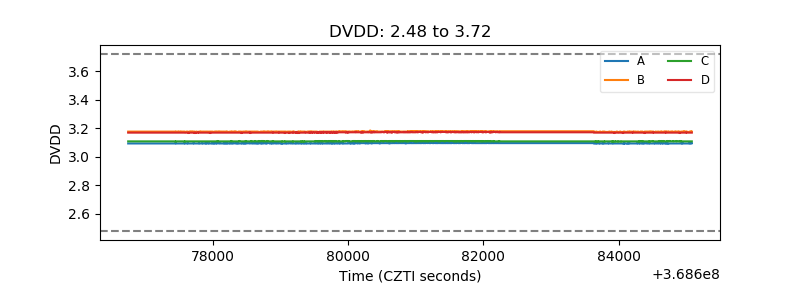 |
| Temperature 1 | 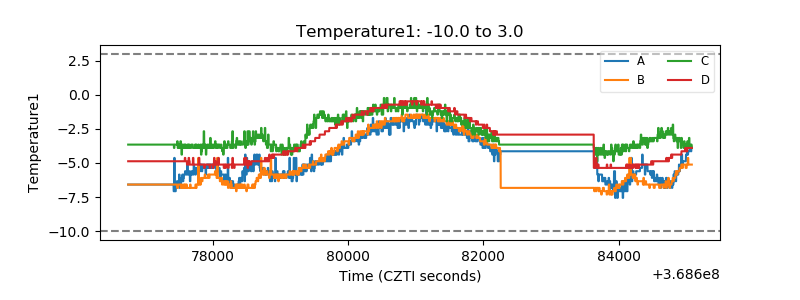 |
| Veto HV Monitor | 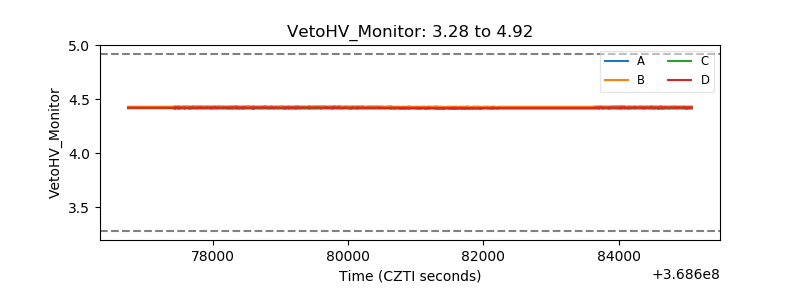 |
| Veto LLD |  |
| Alpha Counter | 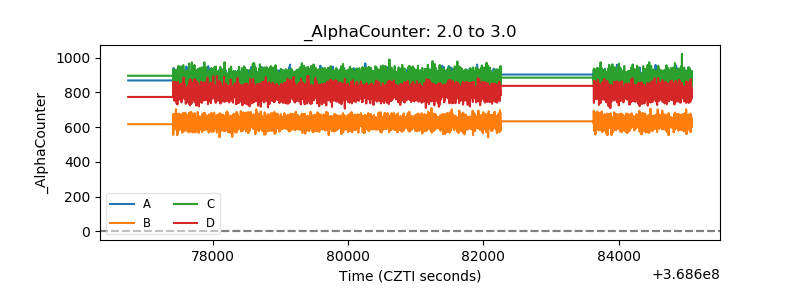 |
| _CPM_Rate | 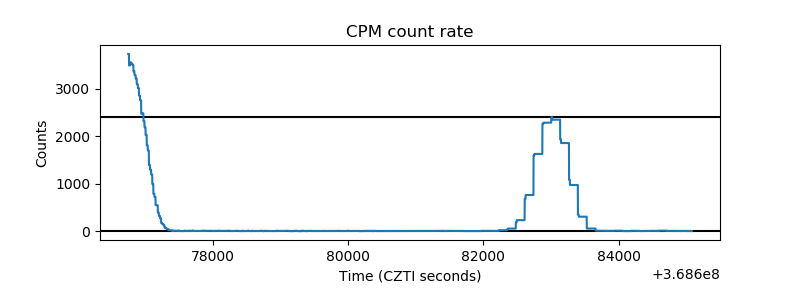 |
| CZT Counter | 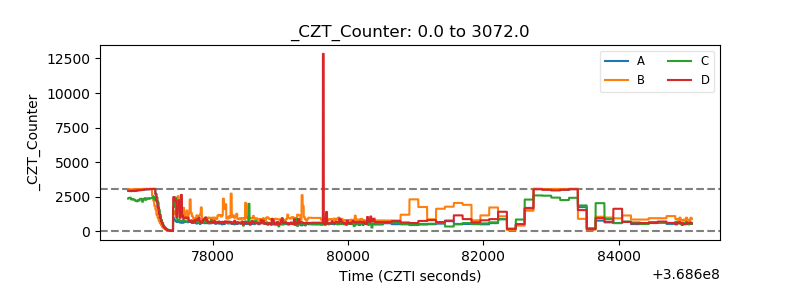 |
| +2.5 Volts monitor |  |
| +5 Volts monitor |  |
| _ROLL_ROT |  |
| _Roll_DEC | 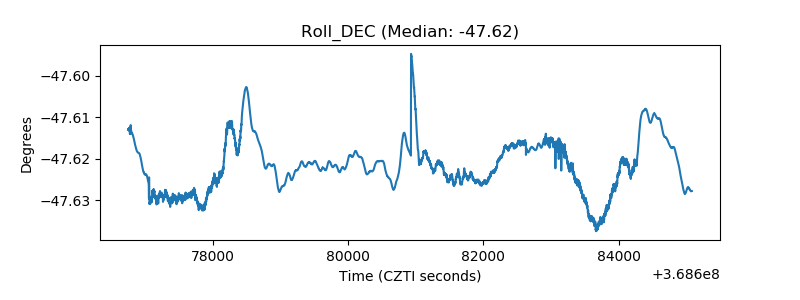 |
| _Roll_RA | 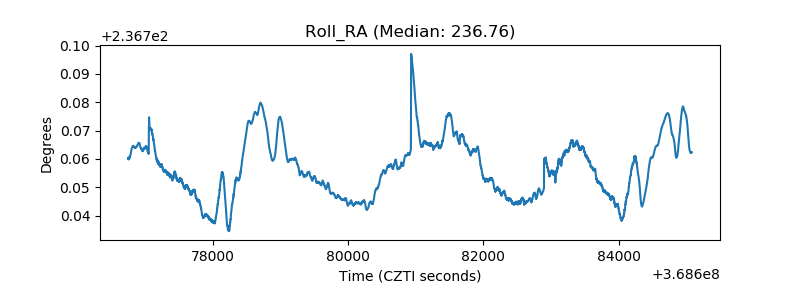 |
| Veto Counter |  |