| Param | Original file | Final file |
|---|---|---|
| Filename | modeM0/AS1T04_051T01_9000004686_32139cztM0_level2.evt | modeM0/AS1T04_051T01_9000004686_32139cztM0_level2_quad_clean.evt |
| Size (bytes) | 1,408,642,560 | 217,664,640 |
| Size | 1.3 GB | 207.6 MB |
| Events in quadrant A | 7,251,974 | 1,449,642 |
| Events in quadrant B | 15,574,175 | 1,360,290 |
| Events in quadrant C | 8,184,161 | 1,423,374 |
| Events in quadrant D | 10,687,080 | 1,370,469 |
| Mode M9 | |||
|---|---|---|---|
| Quadrant | BADHDUFLAG | Total packets | Discarded packets |
| A | 0 | 10 | 0 |
| B | 0 | 10 | 0 |
| C | 0 | 10 | 0 |
| D | 0 | 10 | 0 |
| Mode M0 | |||
|---|---|---|---|
| Quadrant | BADHDUFLAG | Total packets | Discarded packets |
| A | 0 | 29939 | 1 |
| B | 0 | 56134 | 1 |
| C | 0 | 32964 | 1 |
| D | 0 | 42248 | 1 |
| Mode SS | |||
|---|---|---|---|
| Quadrant | BADHDUFLAG | Total packets | Discarded packets |
| A | 0 | 288 | 0 |
| B | 0 | 288 | 0 |
| C | 0 | 288 | 0 |
| D | 0 | 288 | 0 |
| Quadrant | Total seconds | Saturated seconds | Saturation percentage |
|---|---|---|---|
| A | 14315 | 289 | 2.018861% |
| B | 14316 | 1916 | 13.383627% |
| C | 14316 | 670 | 4.680078% |
| D | 14316 | 521 | 3.639285% |
Noise dominated data is calculated using 1-second bins in cleaned event files. If a bin has >2000 counts, and if more than 50% of those come from <1% of pixels, then it is considered to be noise-dominated and hence unusable.
| Quadrant | # 1 sec bins | Bins with >0 counts | Bins with >2000 counts | High rate bins dominated by noise | Noise dominated (total time) | Noise dominated (detector-on time) | Marked lightcurve |
|---|---|---|---|---|---|---|---|
| A | 19921 | 14317 | 1 | 1 | 0.01% | 0.01% | 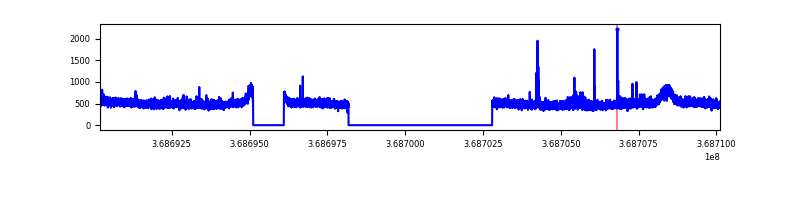 |
| B | 19922 | 14318 | 1030 | 1030 | 5.17% | 7.19% | 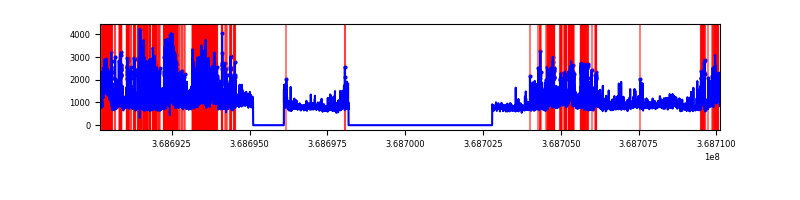 |
| C | 19922 | 14318 | 123 | 123 | 0.62% | 0.86% | 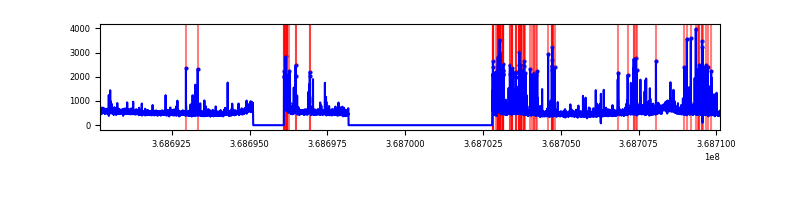 |
| D | 19922 | 14318 | 286 | 286 | 1.44% | 2.00% | 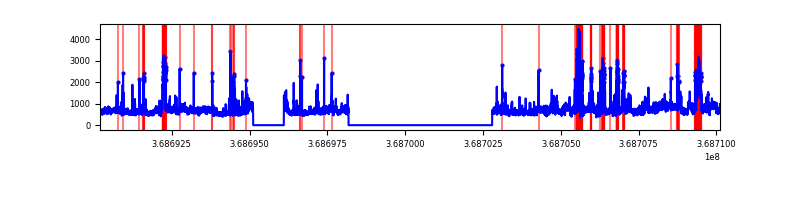 |
Top three noisy pixels from each quadrant. If the there are fewer than three noisy pixels in the level2.evt file, extra rows are filled as -1
| Pixel properties | Quadrant properties | ||||||
|---|---|---|---|---|---|---|---|
| Quadrant | DetID | PixID | Counts | Sigma | Mean | Median | Sigma |
| A | 12 | 189 | 60197 | 159.3 | 1844 | 1808 | 366.5 |
| A | 0 | 6 | 38193 | 99.27 | 1844 | 1808 | 366.5 |
| A | 13 | 6 | 37890 | 98.44 | 1844 | 1808 | 366.5 |
| B | 10 | 245 | 4056389 | 12396.6 | 1740 | 1698 | 327.1 |
| B | 6 | 159 | 3778337 | 11546.5 | 1740 | 1698 | 327.1 |
| B | 5 | 172 | 385952 | 1174.8 | 1740 | 1698 | 327.1 |
| C | 0 | 10 | 892779 | 2179.03 | 1762 | 1775 | 408.9 |
| C | 14 | 238 | 302720 | 735.99 | 1762 | 1775 | 408.9 |
| C | 4 | 175 | 50745 | 119.76 | 1762 | 1775 | 408.9 |
| D | 8 | 195 | 2743204 | 6502.4 | 1785 | 1736 | 421.6 |
| D | 12 | 233 | 606105 | 1433.48 | 1785 | 1736 | 421.6 |
| D | 14 | 52 | 184700 | 433.97 | 1785 | 1736 | 421.6 |
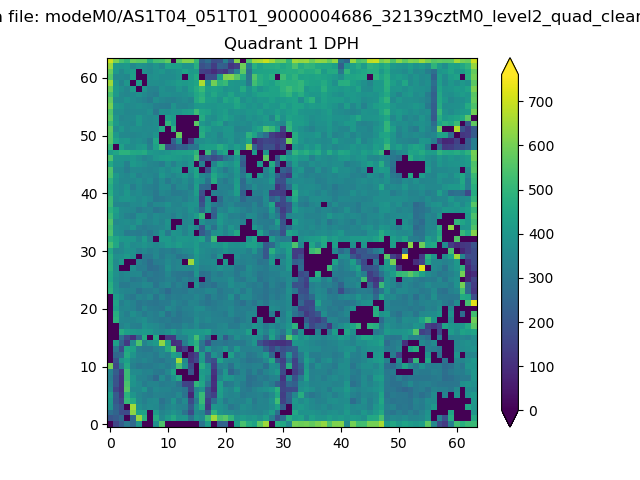
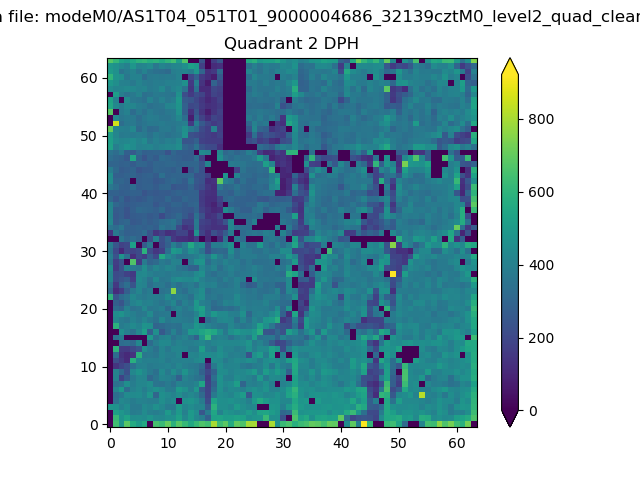
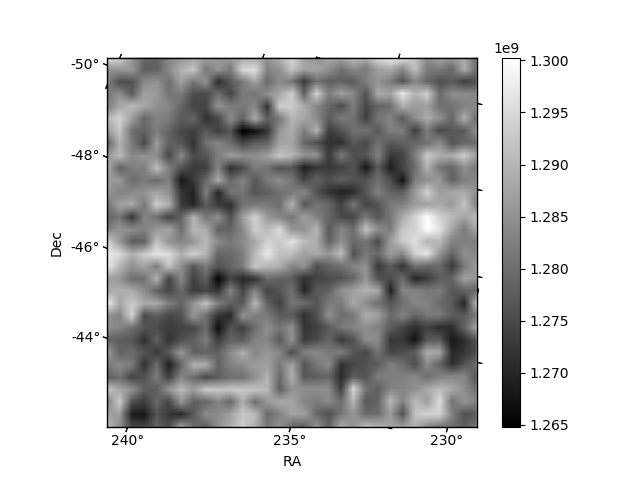
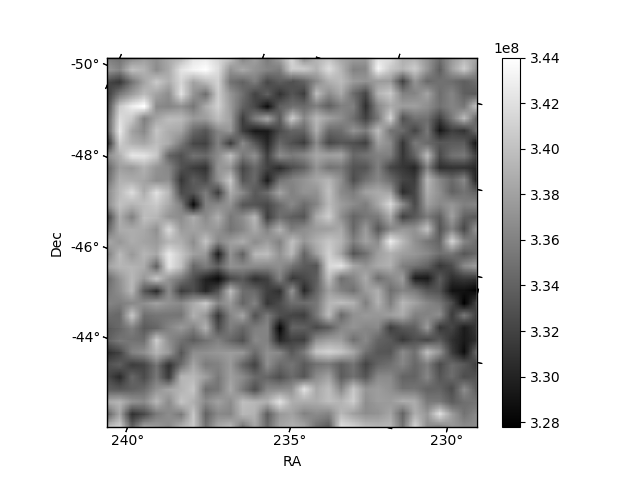
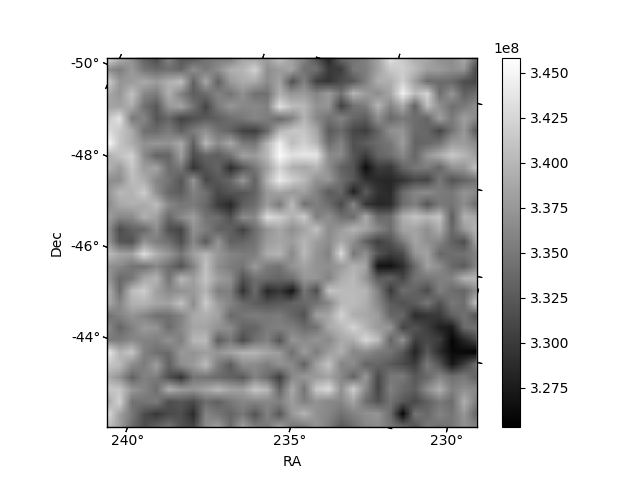
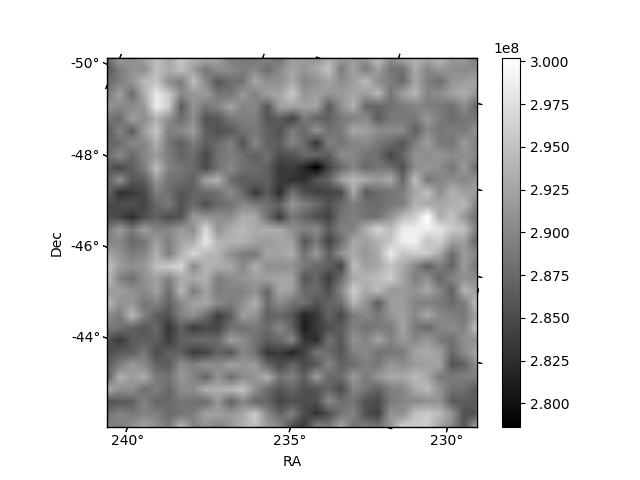
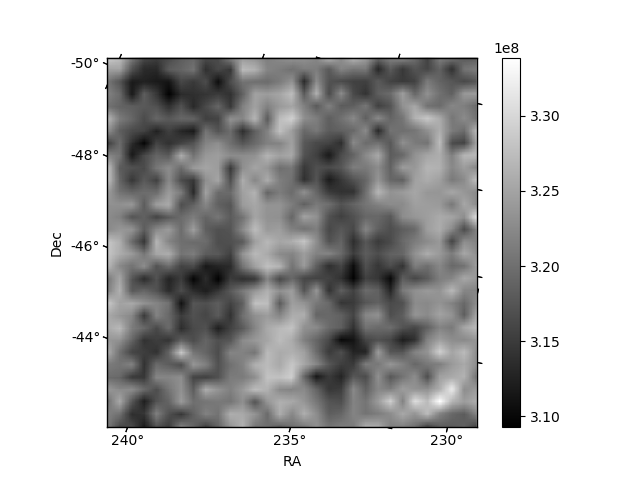
Histogram calculated using DETX and DETY for each event in the final _common_clean file
| Quadrant A |  |
 |
Quadrant B |
|---|---|---|---|
| Quadrant D | 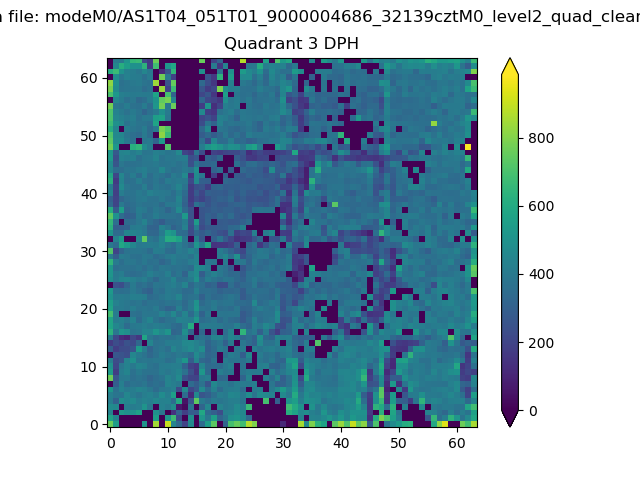 |
 |
Quadrant C |
| Plot type | Count rate plots | Images |
|---|---|---|
| Comparison with Poisson distribution Blue bars denote a histogram of data divided into 1 sec bins. Red curve is a Poisson curve with rate = median count rate of data. |
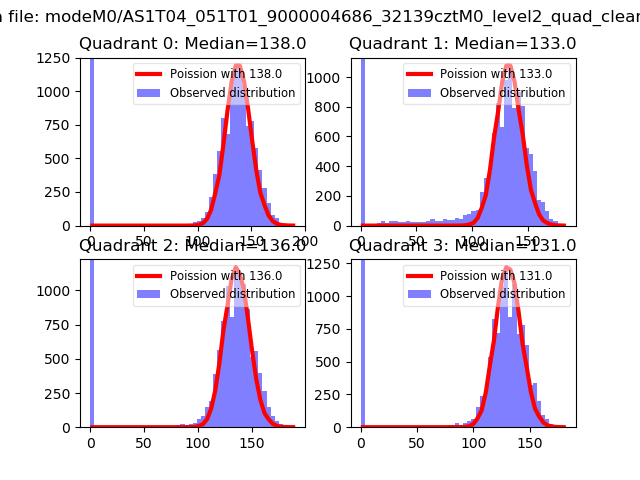 |
 |
| Quadrant-wise count rates Data is divided into 100 sec bins |
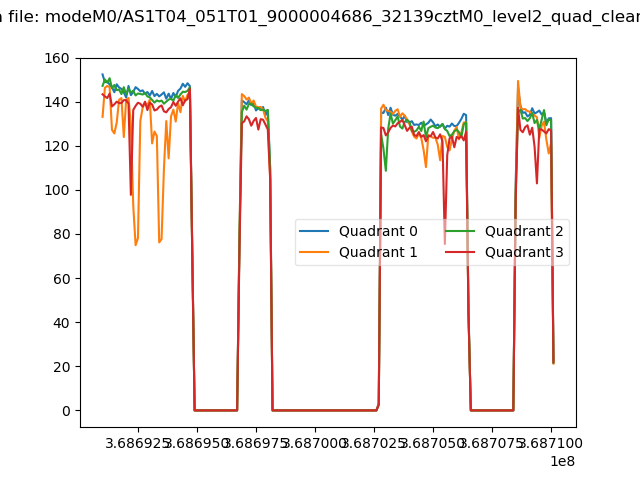 |
|
| Module-wise count rates for Quadrant A Data is divided into 100 sec bins |
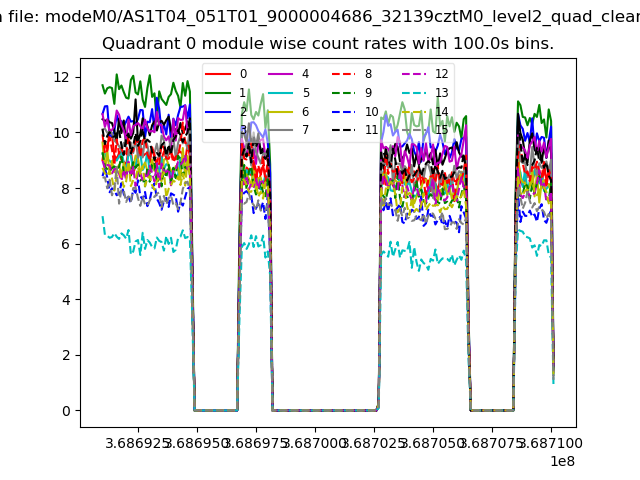 |
 |
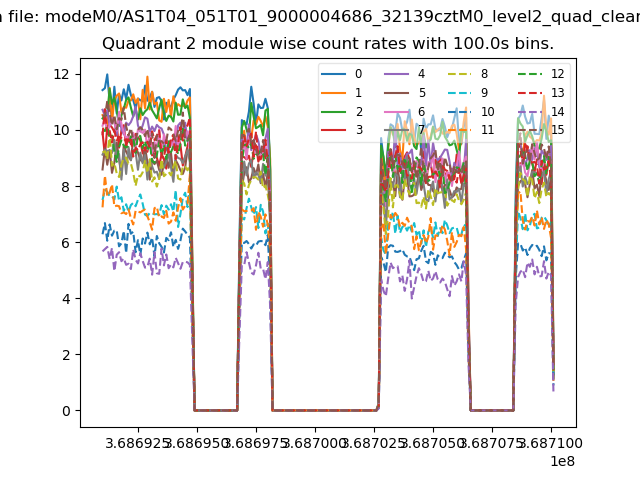
| Module-wise count rates for Quadrant B Data is divided into 100 sec bins |
 |
 |
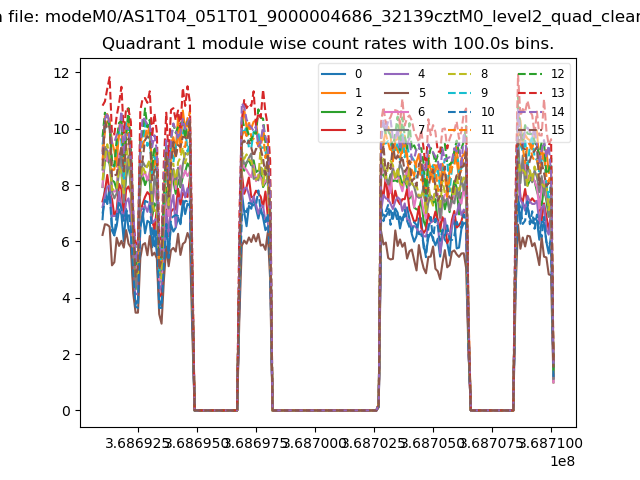
| Module-wise count rates for Quadrant C Data is divided into 100 sec bins |
 |
 |
| Module-wise count rates for Quadrant D Data is divided into 100 sec bins |
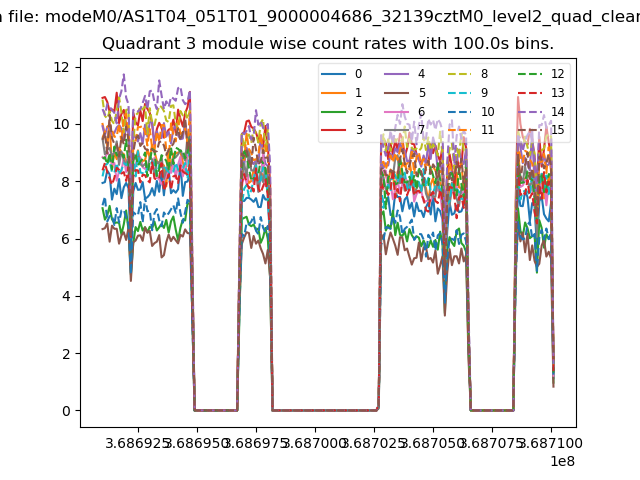 |
 |
| Parameter | Plot |
|---|---|
| CZT HV Monitor | 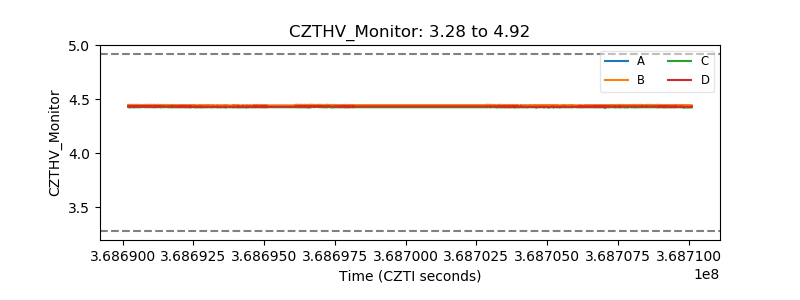 |
| D_VDD | 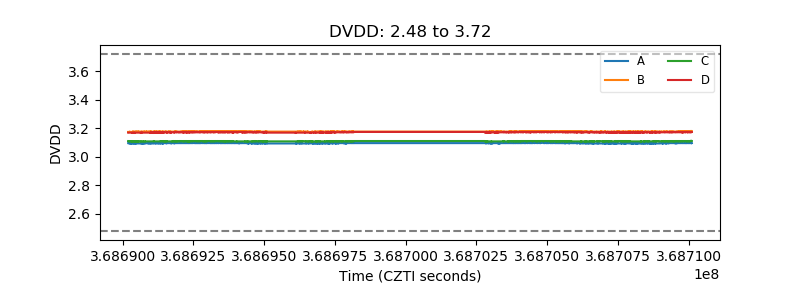 |
| Temperature 1 | 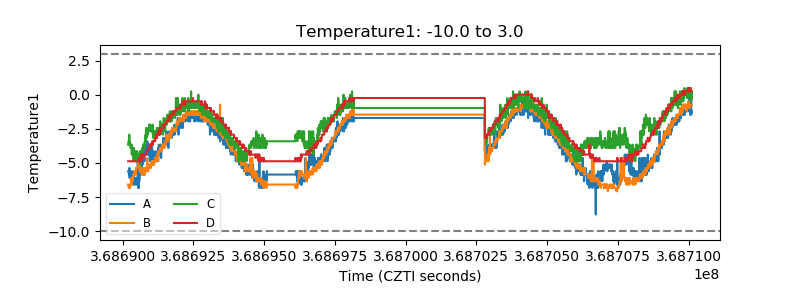 |
| Veto HV Monitor | 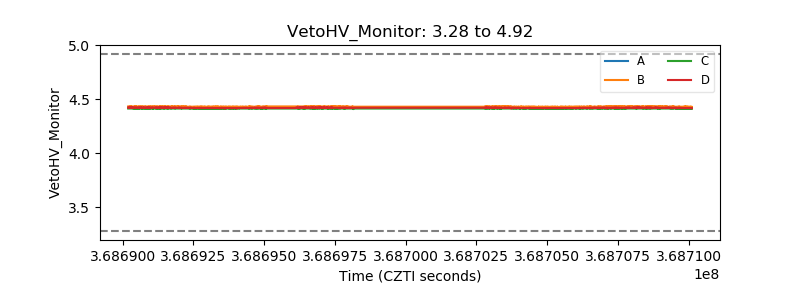 |
| Veto LLD | 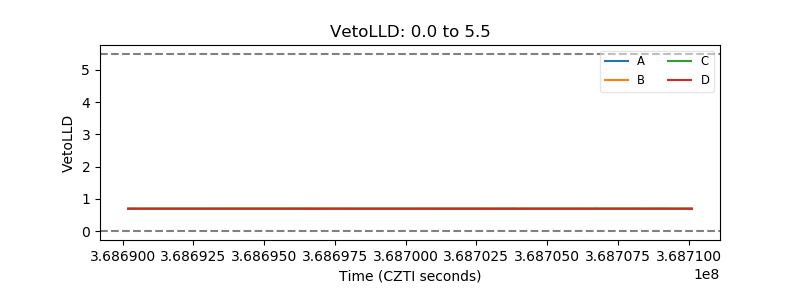 |
| Alpha Counter | 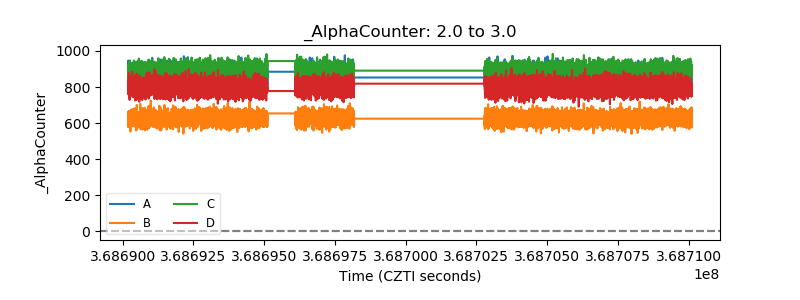 |
| _CPM_Rate |  |
| CZT Counter | 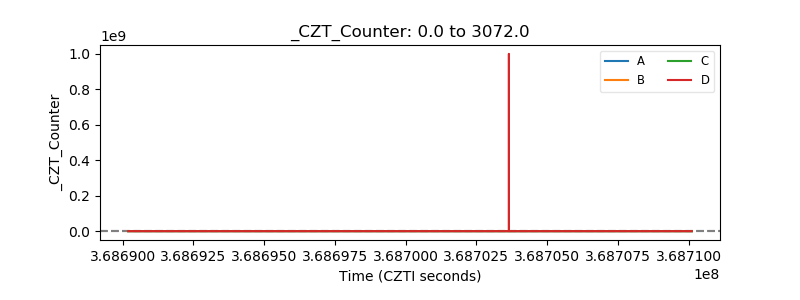 |
| +2.5 Volts monitor |  |
| +5 Volts monitor |  |
| _ROLL_ROT | 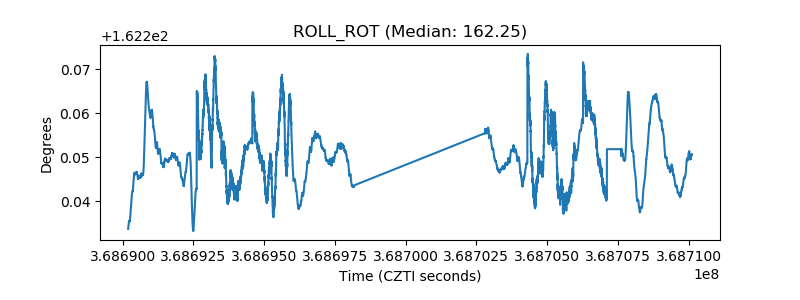 |
| _Roll_DEC |  |
| _Roll_RA |  |
| Veto Counter | 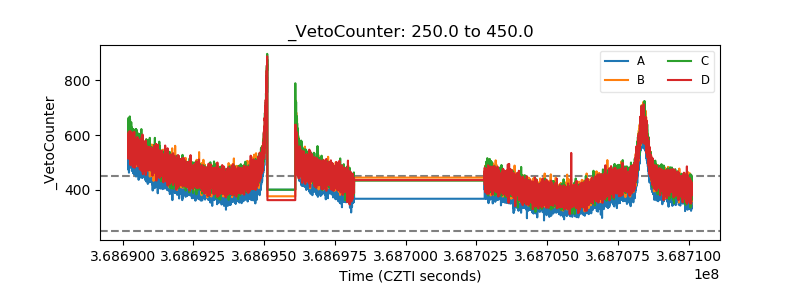 |