| Param | Original file | Final file |
|---|---|---|
| Filename | modeM0/AS1T04_051T01_9000004686_32140cztM0_level2.evt | modeM0/AS1T04_051T01_9000004686_32140cztM0_level2_quad_clean.evt |
| Size (bytes) | 685,031,040 | 100,313,280 |
| Size | 653.3 MB | 95.7 MB |
| Events in quadrant A | 3,426,434 | 660,535 |
| Events in quadrant B | 6,786,289 | 634,154 |
| Events in quadrant C | 3,665,153 | 645,250 |
| Events in quadrant D | 6,396,257 | 610,475 |
| Mode M9 | |||
|---|---|---|---|
| Quadrant | BADHDUFLAG | Total packets | Discarded packets |
| A | 0 | 1 | 0 |
| B | 0 | 1 | 0 |
| C | 0 | 1 | 0 |
| D | 0 | 1 | 0 |
| Mode M0 | |||
|---|---|---|---|
| Quadrant | BADHDUFLAG | Total packets | Discarded packets |
| A | 0 | 14522 | 2 |
| B | 0 | 25050 | 2 |
| C | 0 | 15295 | 2 |
| D | 0 | 24105 | 9 |
| Mode SS | |||
|---|---|---|---|
| Quadrant | BADHDUFLAG | Total packets | Discarded packets |
| A | 0 | 142 | 0 |
| B | 0 | 142 | 0 |
| C | 0 | 142 | 0 |
| D | 0 | 142 | 0 |
| Quadrant | Total seconds | Saturated seconds | Saturation percentage |
|---|---|---|---|
| A | 6989 | 161 | 2.303620% |
| B | 6990 | 556 | 7.954220% |
| C | 6990 | 288 | 4.120172% |
| D | 6989 | 327 | 4.678781% |
Noise dominated data is calculated using 1-second bins in cleaned event files. If a bin has >2000 counts, and if more than 50% of those come from <1% of pixels, then it is considered to be noise-dominated and hence unusable.
| Quadrant | # 1 sec bins | Bins with >0 counts | Bins with >2000 counts | High rate bins dominated by noise | Noise dominated (total time) | Noise dominated (detector-on time) | Marked lightcurve |
|---|---|---|---|---|---|---|---|
| A | 7069 | 6991 | 0 | 0 | 0.00% | 0.00% | 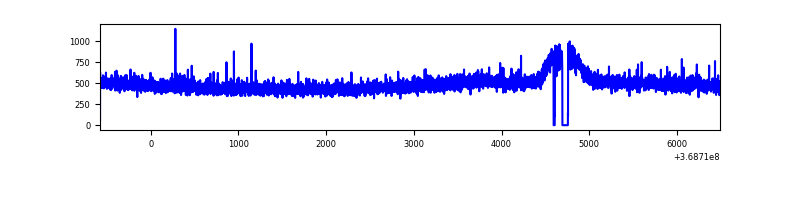 |
| B | 7070 | 6992 | 184 | 184 | 2.60% | 2.63% | 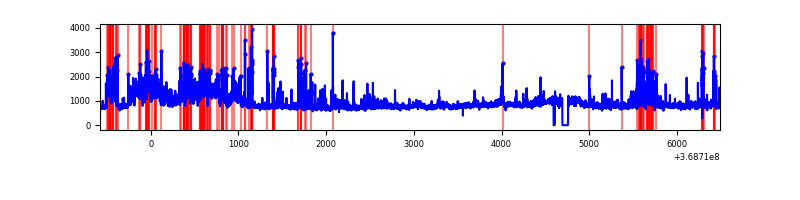 |
| C | 7070 | 6992 | 22 | 22 | 0.31% | 0.31% | 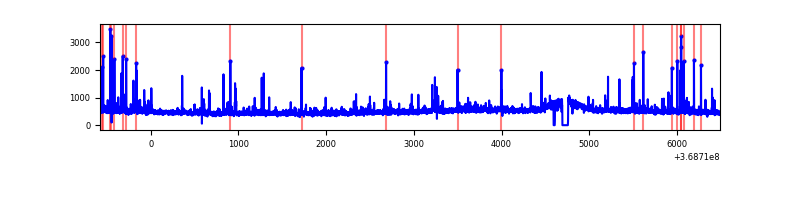 |
| D | 7069 | 6991 | 213 | 213 | 3.01% | 3.05% | 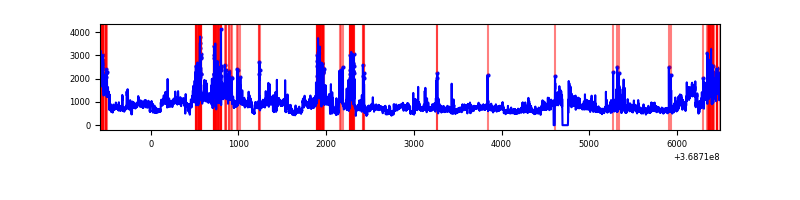 |
Top three noisy pixels from each quadrant. If the there are fewer than three noisy pixels in the level2.evt file, extra rows are filled as -1
| Pixel properties | Quadrant properties | ||||||
|---|---|---|---|---|---|---|---|
| Quadrant | DetID | PixID | Counts | Sigma | Mean | Median | Sigma |
| A | 13 | 6 | 21227 | 115.2 | 877 | 859 | 176.8 |
| A | 12 | 189 | 19160 | 103.51 | 877 | 859 | 176.8 |
| A | 13 | 254 | 13213 | 69.87 | 877 | 859 | 176.8 |
| B | 6 | 159 | 1906337 | 11759.53 | 848 | 827 | 162.0 |
| B | 10 | 245 | 1090163 | 6722.65 | 848 | 827 | 162.0 |
| B | 5 | 172 | 284169 | 1748.6 | 848 | 827 | 162.0 |
| C | 14 | 238 | 165391 | 842.3 | 833 | 839 | 195.4 |
| C | 0 | 10 | 158516 | 807.11 | 833 | 839 | 195.4 |
| C | 14 | 254 | 47937 | 241.08 | 833 | 839 | 195.4 |
| D | 8 | 195 | 2426348 | 12142.44 | 837 | 815 | 199.8 |
| D | 12 | 233 | 328544 | 1640.64 | 837 | 815 | 199.8 |
| D | 12 | 218 | 190807 | 951.12 | 837 | 815 | 199.8 |
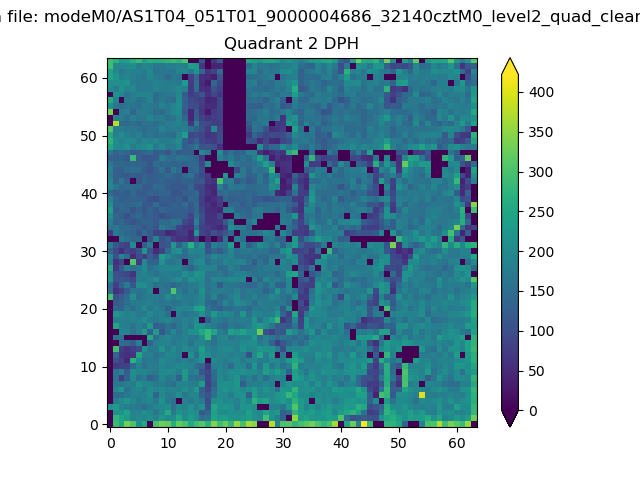
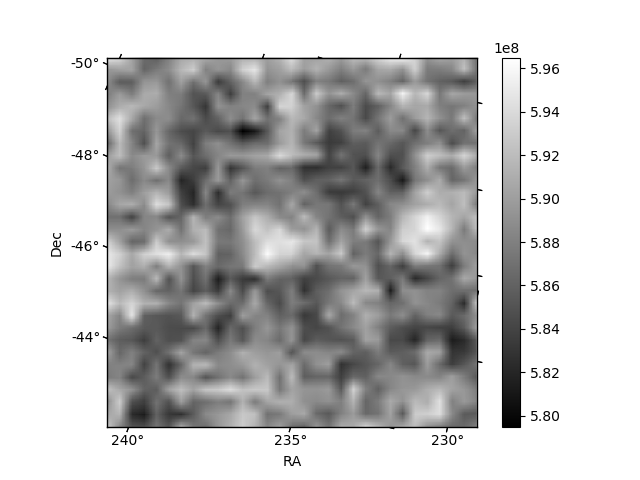
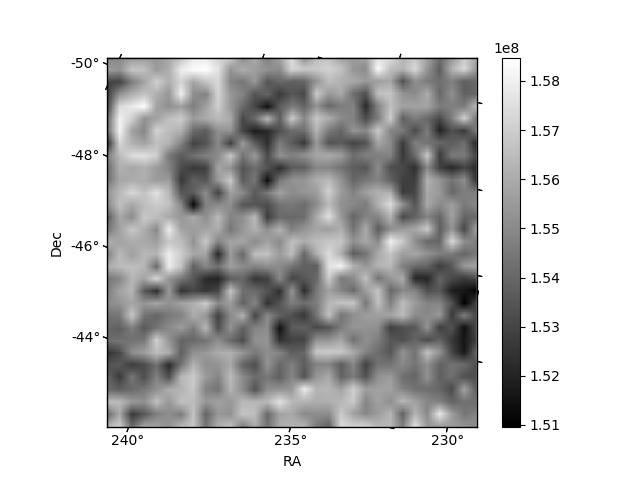
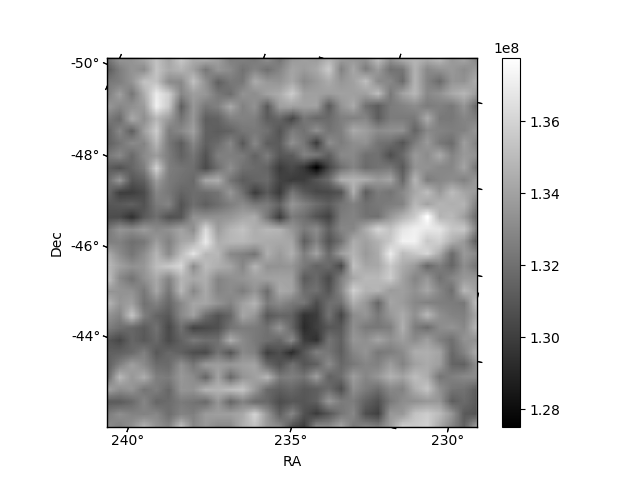
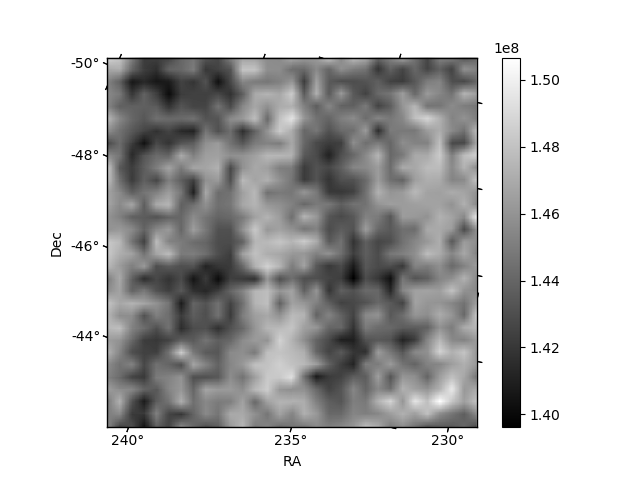
Histogram calculated using DETX and DETY for each event in the final _common_clean file
| Quadrant A | 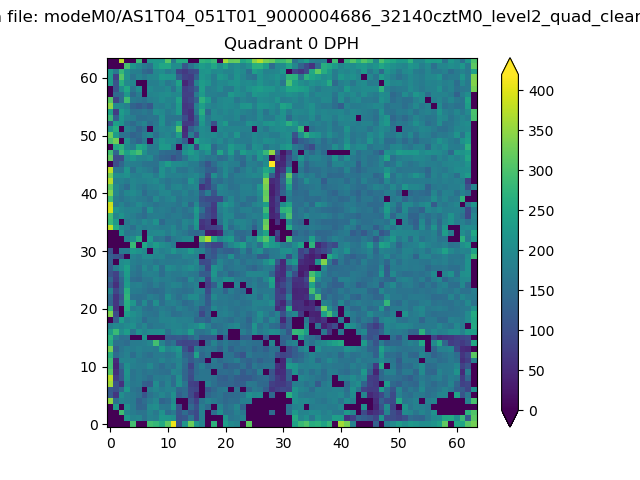 |
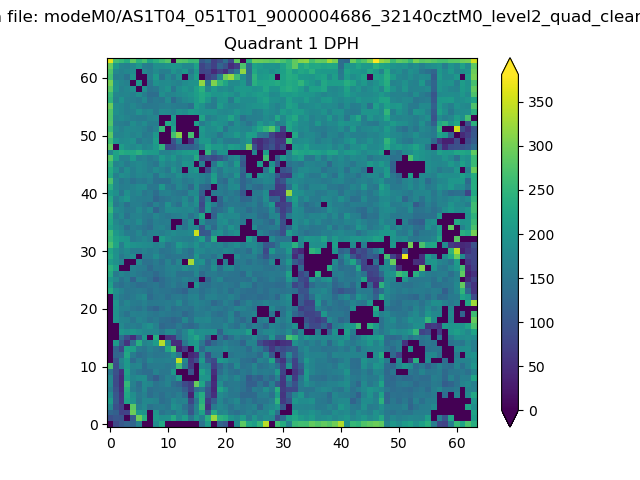 |
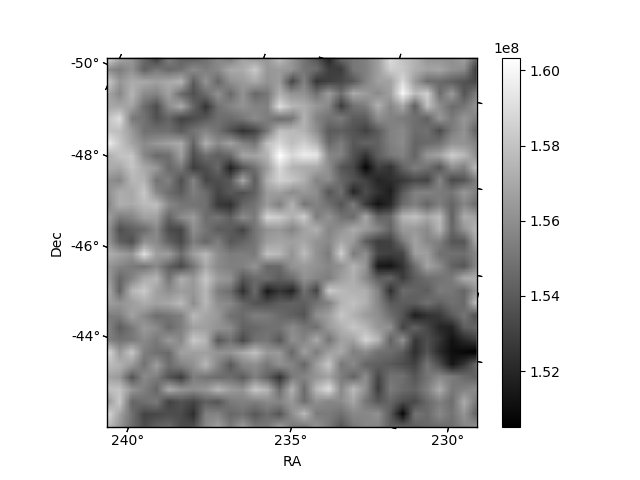
Quadrant B |
|---|---|---|---|
| Quadrant D | 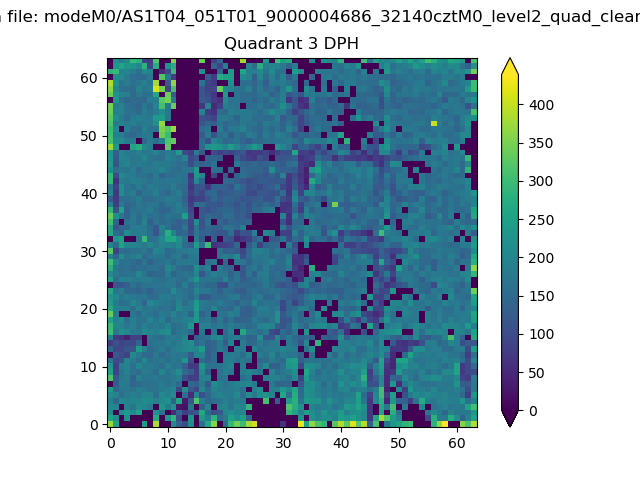 |
 |
Quadrant C |
| Plot type | Count rate plots | Images |
|---|---|---|
| Comparison with Poisson distribution Blue bars denote a histogram of data divided into 1 sec bins. Red curve is a Poisson curve with rate = median count rate of data. |
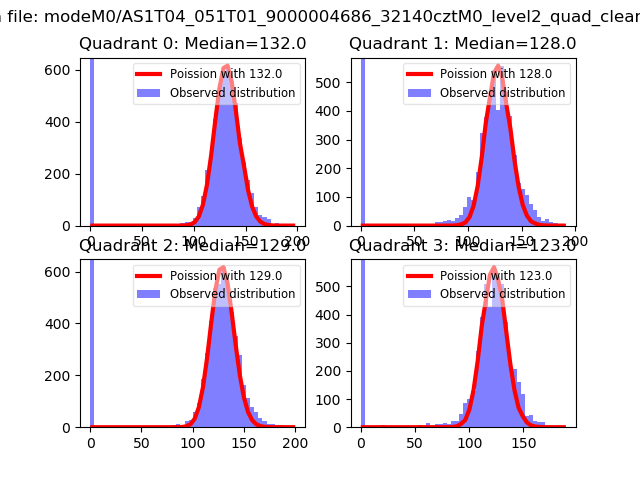 |
 |
| Quadrant-wise count rates Data is divided into 100 sec bins |
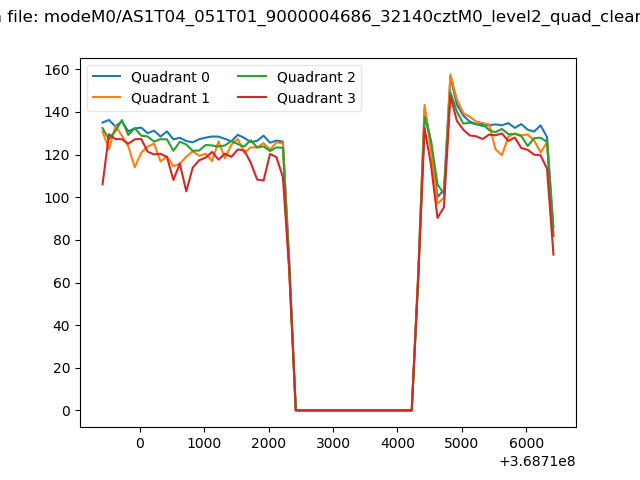 |
|
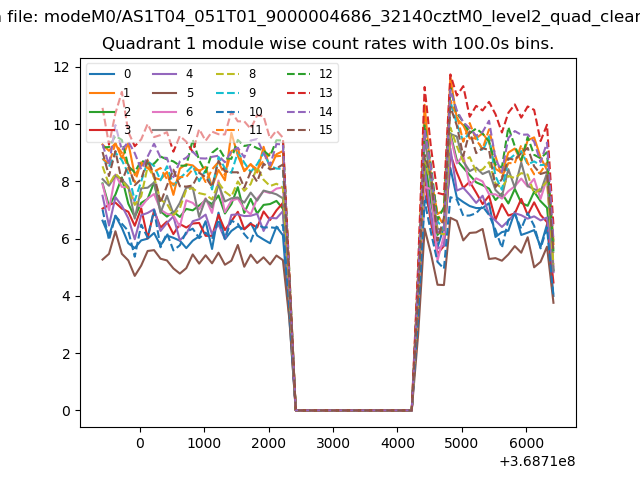
| Module-wise count rates for Quadrant A Data is divided into 100 sec bins |
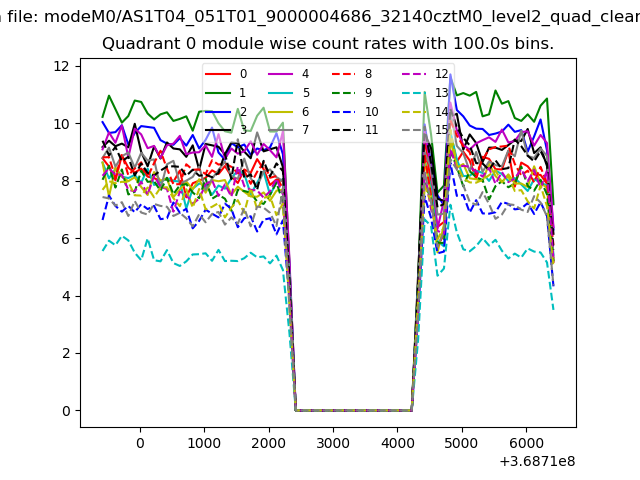 |
 |
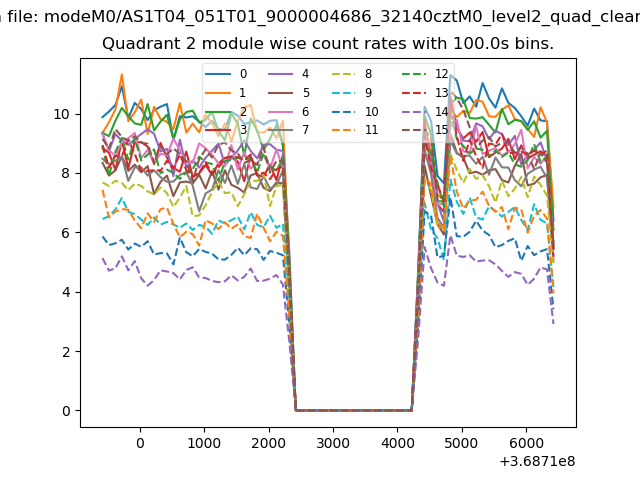
| Module-wise count rates for Quadrant B Data is divided into 100 sec bins |
 |
 |
| Module-wise count rates for Quadrant C Data is divided into 100 sec bins |
 |
 |
| Module-wise count rates for Quadrant D Data is divided into 100 sec bins |
 |
 |
| Parameter | Plot |
|---|---|
| CZT HV Monitor | 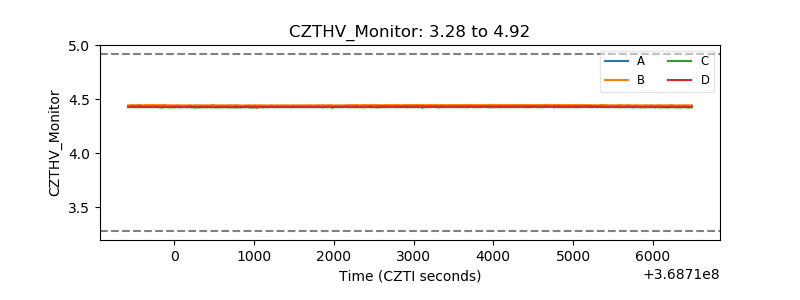 |
| D_VDD | 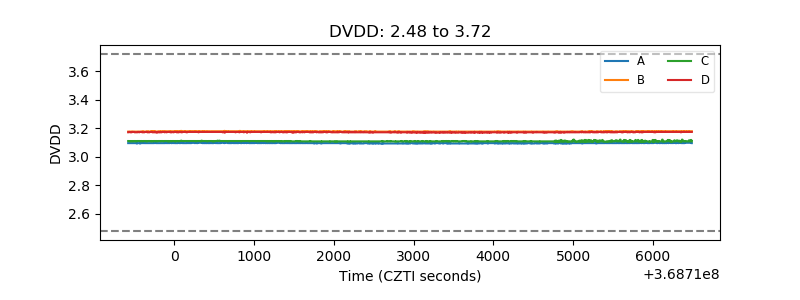 |
| Temperature 1 | 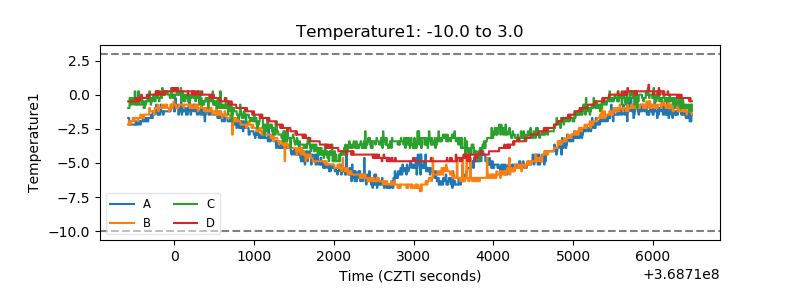 |
| Veto HV Monitor | 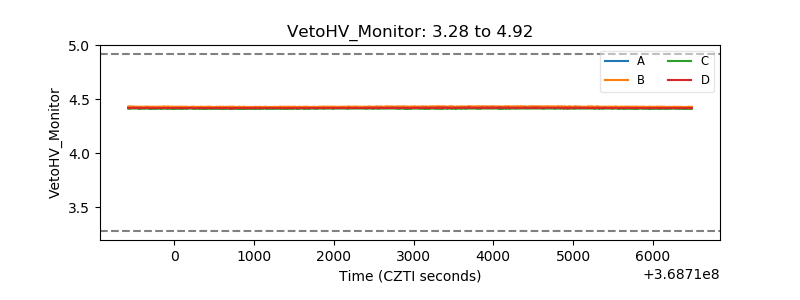 |
| Veto LLD |  |
| Alpha Counter | 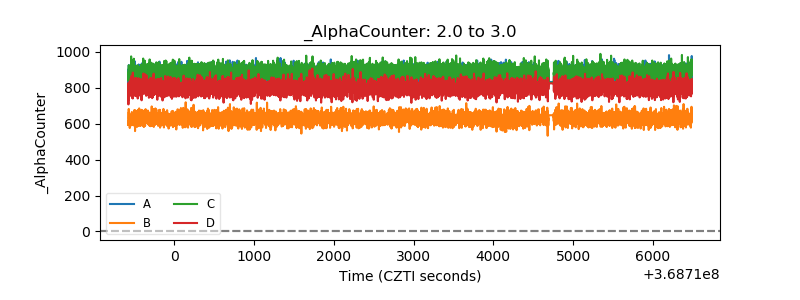 |
| _CPM_Rate | 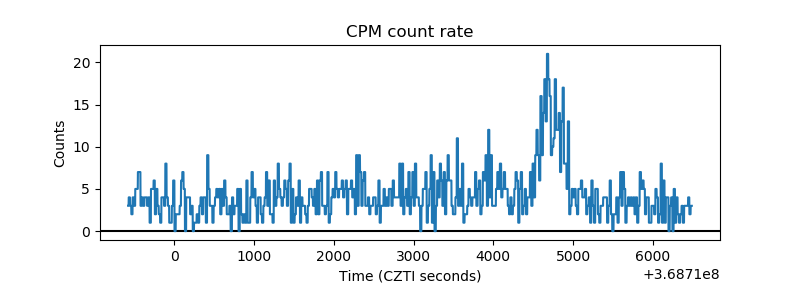 |
| CZT Counter | 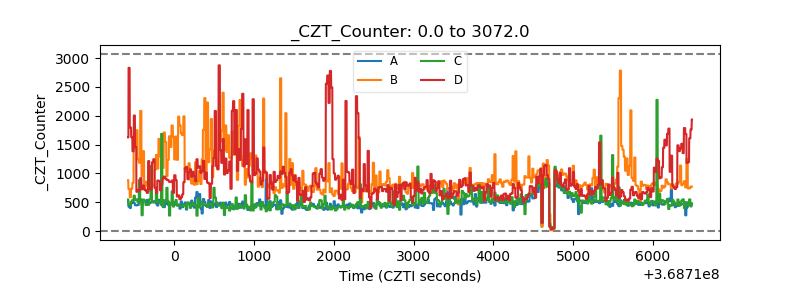 |
| +2.5 Volts monitor |  |
| +5 Volts monitor |  |
| _ROLL_ROT | 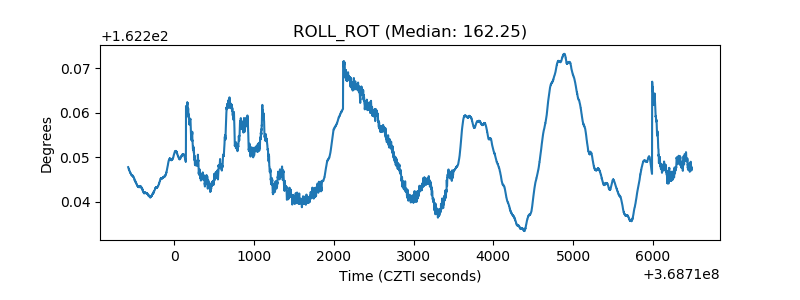 |
| _Roll_DEC | 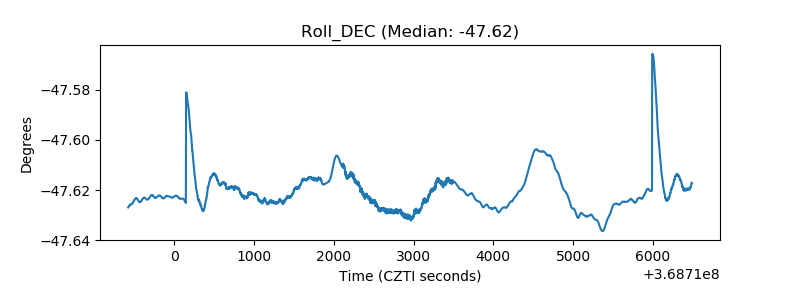 |
| _Roll_RA | 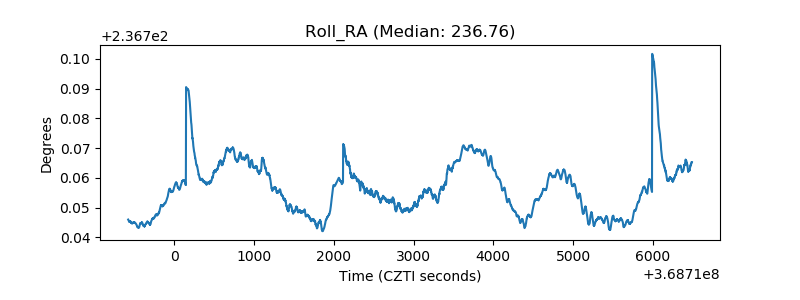 |
| Veto Counter | 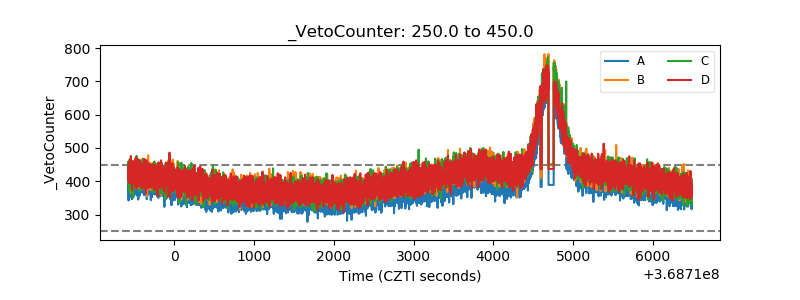 |