| Param | Original file | Final file |
|---|---|---|
| Filename | modeM0/AS1T04_051T01_9000004686_32143cztM0_level2.evt | modeM0/AS1T04_051T01_9000004686_32143cztM0_level2_quad_clean.evt |
| Size (bytes) | 1,810,572,480 | 239,437,440 |
| Size | 1.7 GB | 228.3 MB |
| Events in quadrant A | 8,522,701 | 1,576,939 |
| Events in quadrant B | 19,325,787 | 1,462,324 |
| Events in quadrant C | 9,202,313 | 1,535,985 |
| Events in quadrant D | 16,571,724 | 1,433,386 |
| Mode M9 | |||
|---|---|---|---|
| Quadrant | BADHDUFLAG | Total packets | Discarded packets |
| A | 0 | 18 | 0 |
| B | 0 | 18 | 0 |
| C | 0 | 18 | 0 |
| D | 0 | 18 | 0 |
| Mode M0 | |||
|---|---|---|---|
| Quadrant | BADHDUFLAG | Total packets | Discarded packets |
| A | 0 | 36881 | 3 |
| B | 0 | 69715 | 3 |
| C | 0 | 38586 | 3 |
| D | 0 | 62503 | 3 |
| Mode SS | |||
|---|---|---|---|
| Quadrant | BADHDUFLAG | Total packets | Discarded packets |
| A | 0 | 366 | 0 |
| B | 0 | 366 | 0 |
| C | 0 | 366 | 0 |
| D | 0 | 366 | 0 |
| Quadrant | Total seconds | Saturated seconds | Saturation percentage |
|---|---|---|---|
| A | 18021 | 130 | 0.721381% |
| B | 18020 | 2164 | 12.008879% |
| C | 18020 | 413 | 2.291898% |
| D | 18021 | 1082 | 6.004106% |
Noise dominated data is calculated using 1-second bins in cleaned event files. If a bin has >2000 counts, and if more than 50% of those come from <1% of pixels, then it is considered to be noise-dominated and hence unusable.
| Quadrant | # 1 sec bins | Bins with >0 counts | Bins with >2000 counts | High rate bins dominated by noise | Noise dominated (total time) | Noise dominated (detector-on time) | Marked lightcurve |
|---|---|---|---|---|---|---|---|
| A | 19791 | 18024 | 0 | 0 | 0.00% | 0.00% | 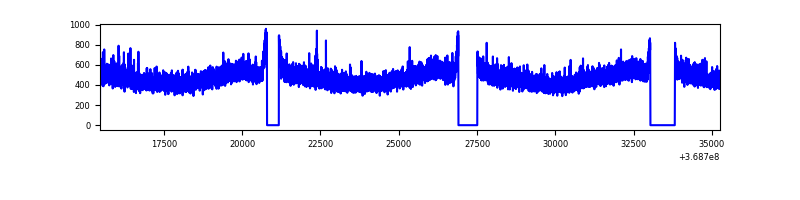 |
| B | 19790 | 18023 | 1345 | 1345 | 6.80% | 7.46% | 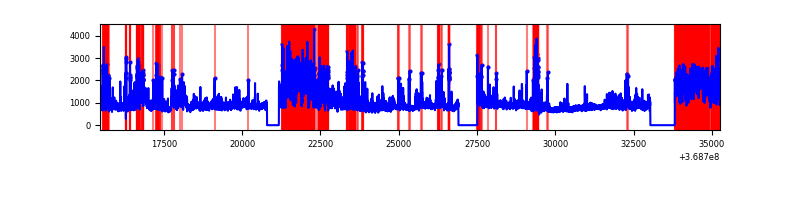 |
| C | 19790 | 18023 | 55 | 55 | 0.28% | 0.31% | 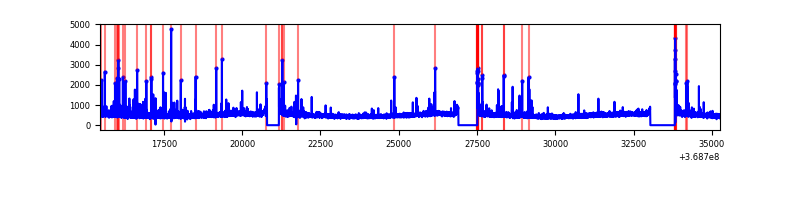 |
| D | 19791 | 18024 | 965 | 965 | 4.88% | 5.35% | 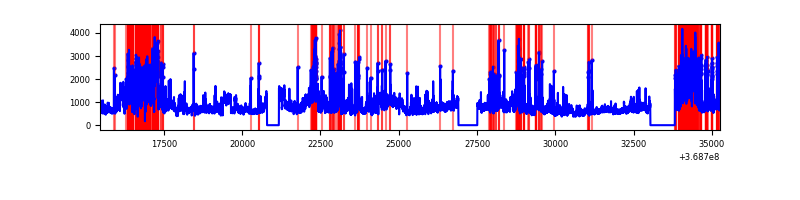 |
Top three noisy pixels from each quadrant. If the there are fewer than three noisy pixels in the level2.evt file, extra rows are filled as -1
| Pixel properties | Quadrant properties | ||||||
|---|---|---|---|---|---|---|---|
| Quadrant | DetID | PixID | Counts | Sigma | Mean | Median | Sigma |
| A | 13 | 6 | 46569 | 100.83 | 2191 | 2141 | 440.6 |
| A | 13 | 254 | 36203 | 77.3 | 2191 | 2141 | 440.6 |
| A | 3 | 137 | 22199 | 45.52 | 2191 | 2141 | 440.6 |
| B | 6 | 159 | 5222820 | 13135.28 | 2100 | 2048 | 397.5 |
| B | 10 | 245 | 4633175 | 11651.76 | 2100 | 2048 | 397.5 |
| B | 5 | 172 | 668483 | 1676.73 | 2100 | 2048 | 397.5 |
| C | 0 | 10 | 402579 | 817.03 | 2086 | 2100 | 490.2 |
| C | 14 | 238 | 382490 | 776.05 | 2086 | 2100 | 490.2 |
| C | 3 | 233 | 74421 | 147.54 | 2086 | 2100 | 490.2 |
| D | 8 | 195 | 5627409 | 11310.73 | 2069 | 2012 | 497.4 |
| D | 12 | 218 | 1420575 | 2852.24 | 2069 | 2012 | 497.4 |
| D | 12 | 233 | 1109001 | 2225.77 | 2069 | 2012 | 497.4 |
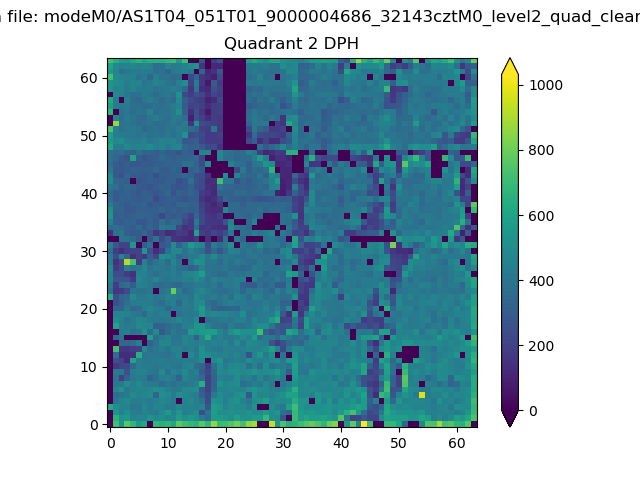
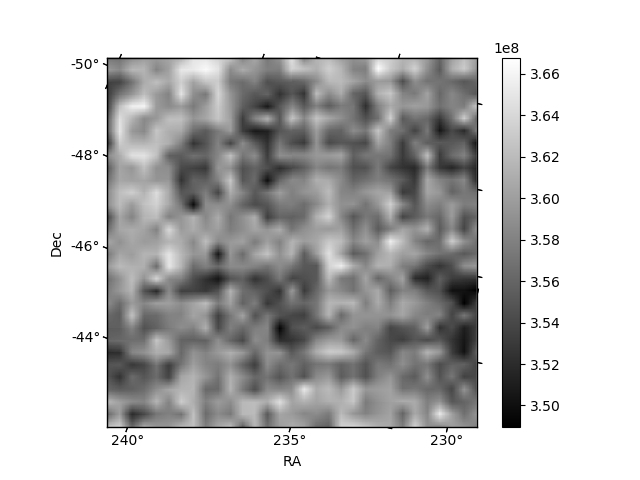
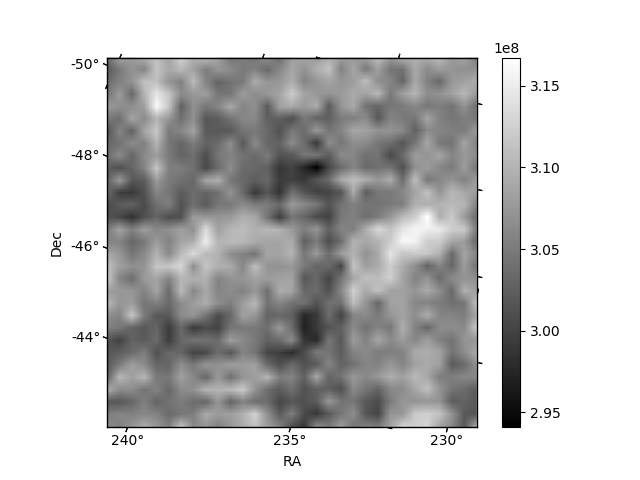
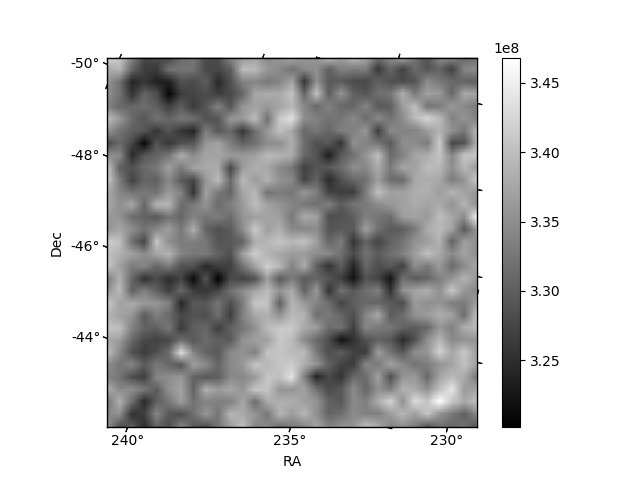
Histogram calculated using DETX and DETY for each event in the final _common_clean file
| Quadrant A |  |
 |
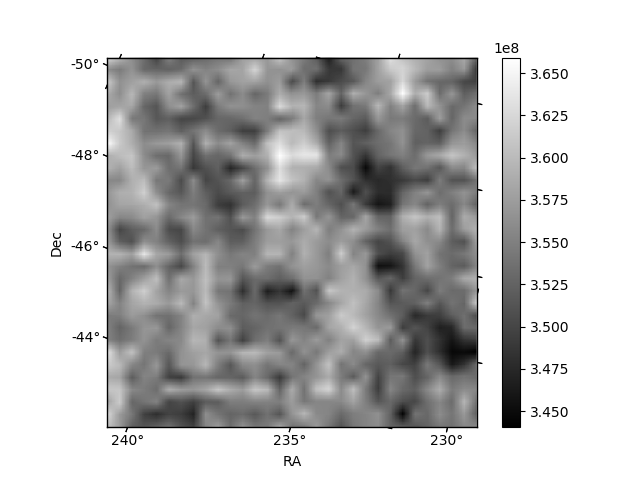
Quadrant B |
|---|---|---|---|
| Quadrant D |  |
 |
Quadrant C |
| Plot type | Count rate plots | Images |
|---|---|---|
| Comparison with Poisson distribution Blue bars denote a histogram of data divided into 1 sec bins. Red curve is a Poisson curve with rate = median count rate of data. |
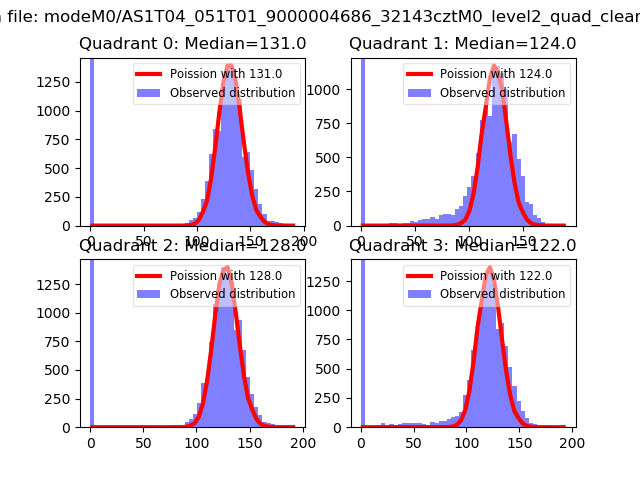 |
 |
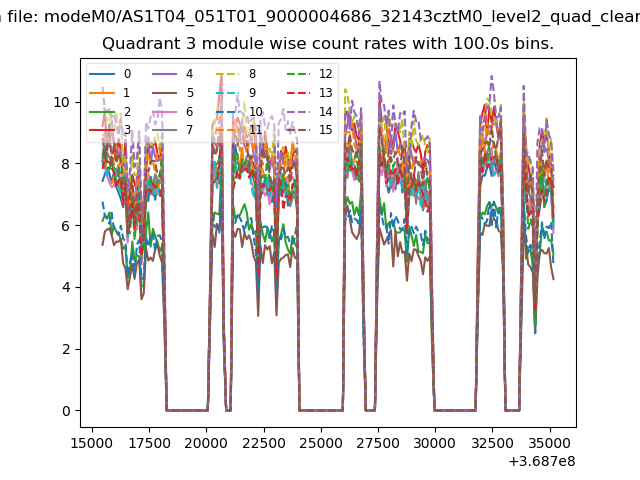
| Quadrant-wise count rates Data is divided into 100 sec bins |
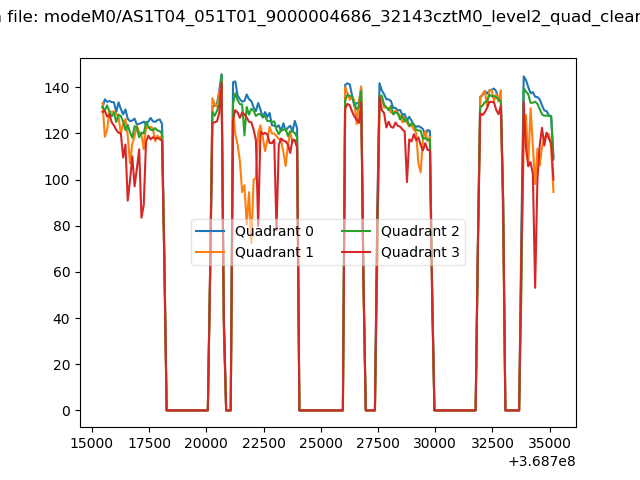 |
|
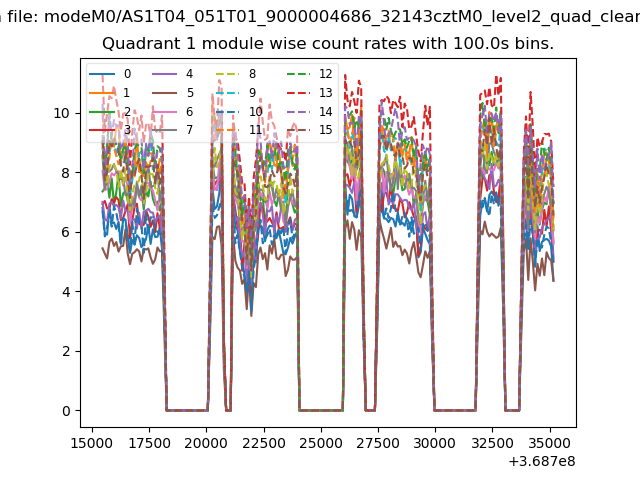
| Module-wise count rates for Quadrant A Data is divided into 100 sec bins |
 |
 |
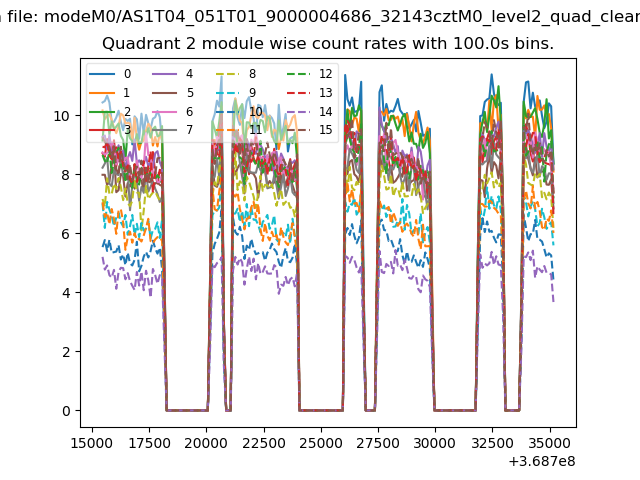
| Module-wise count rates for Quadrant B Data is divided into 100 sec bins |
 |
 |
| Module-wise count rates for Quadrant C Data is divided into 100 sec bins |
 |
 |
| Module-wise count rates for Quadrant D Data is divided into 100 sec bins |
 |
 |
| Parameter | Plot |
|---|---|
| CZT HV Monitor | 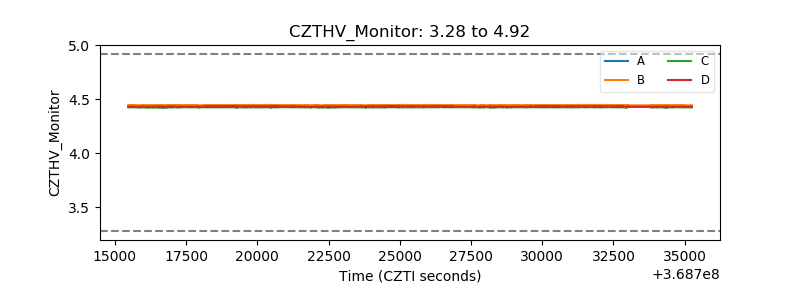 |
| D_VDD | 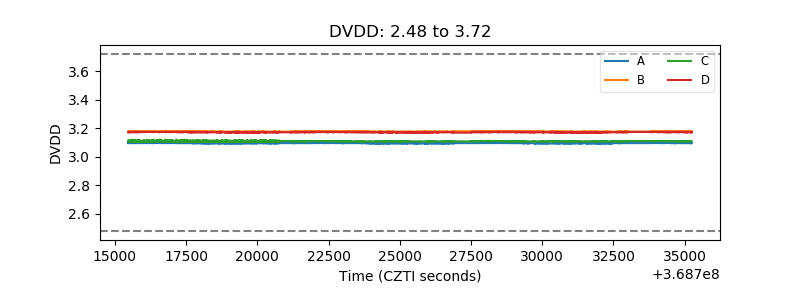 |
| Temperature 1 | 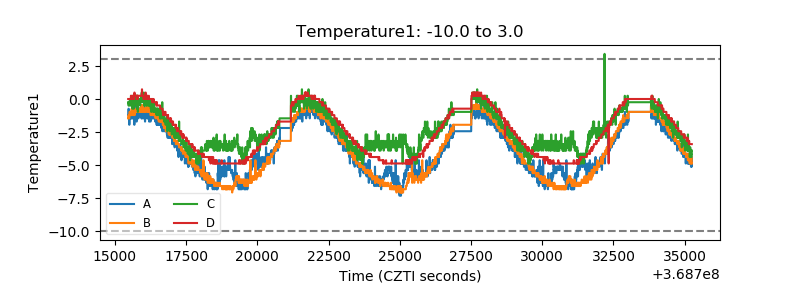 |
| Veto HV Monitor | 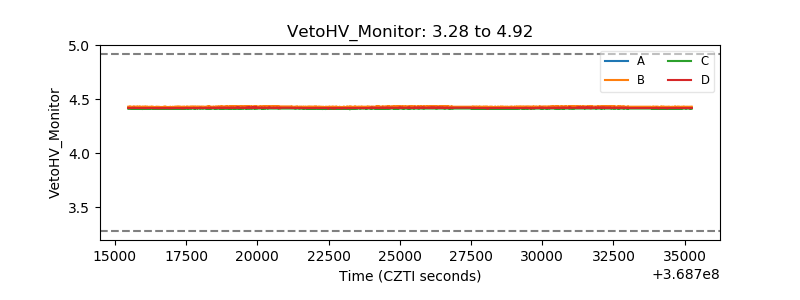 |
| Veto LLD | 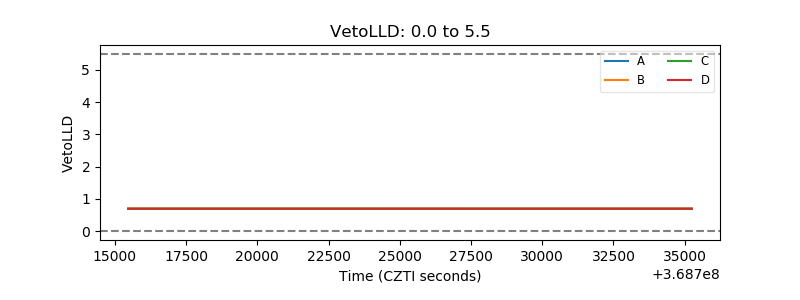 |
| Alpha Counter | 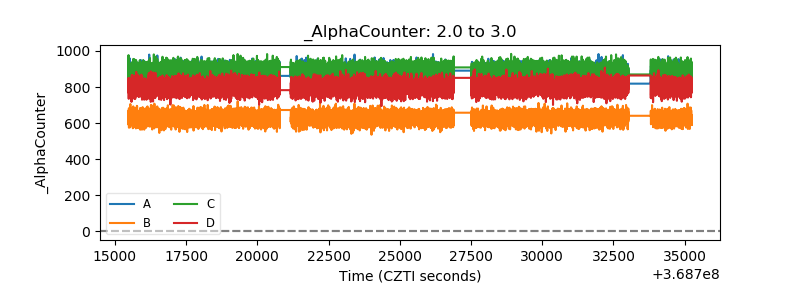 |
| _CPM_Rate | 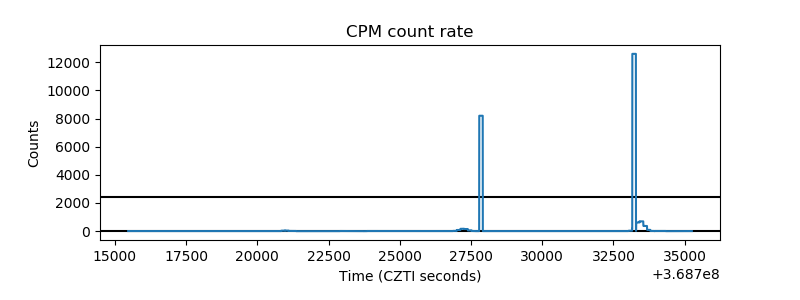 |
| CZT Counter | 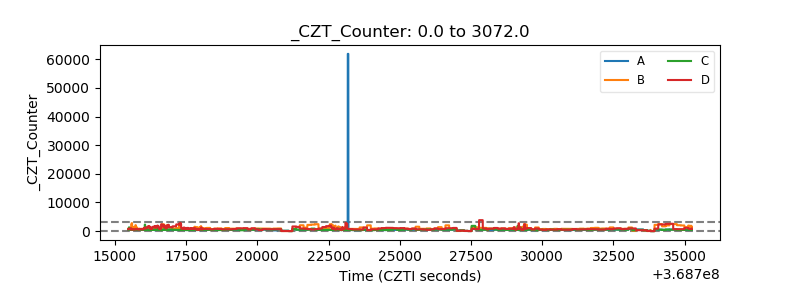 |
| +2.5 Volts monitor |  |
| +5 Volts monitor | 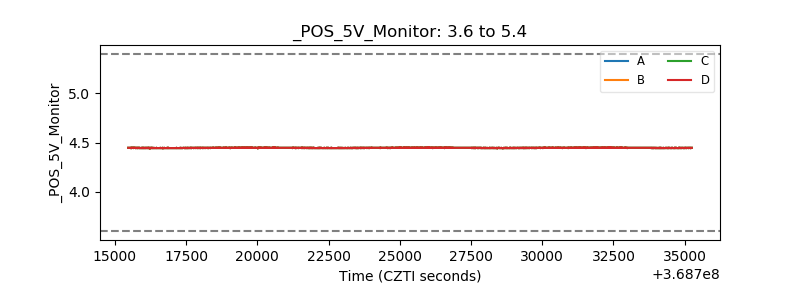 |
| _ROLL_ROT | 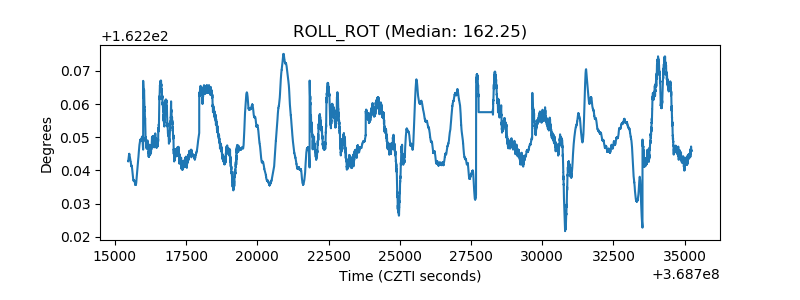 |
| _Roll_DEC | 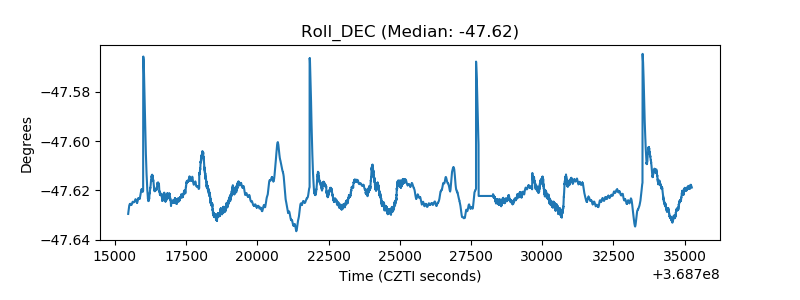 |
| _Roll_RA | 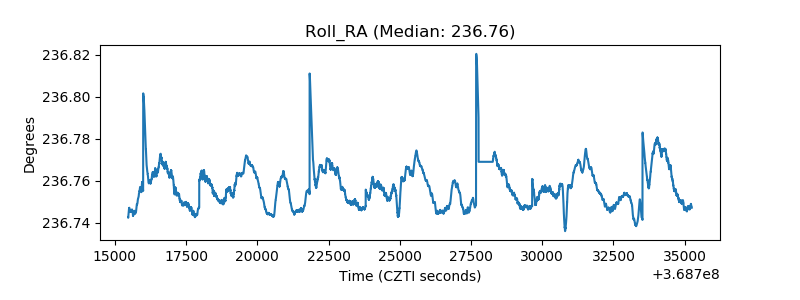 |
| Veto Counter | 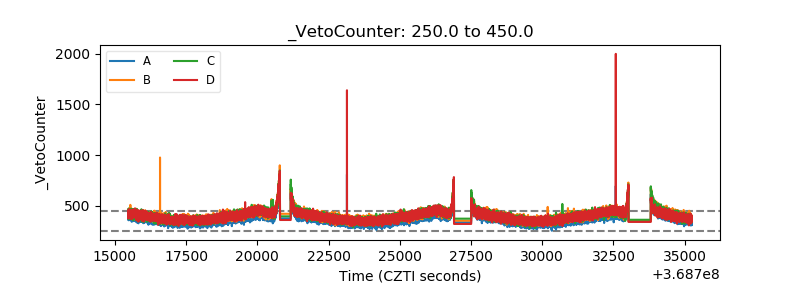 |