| Param | Original file | Final file |
|---|---|---|
| Filename | modeM0/AS1T04_051T01_9000004686_32146cztM0_level2.evt | modeM0/AS1T04_051T01_9000004686_32146cztM0_level2_quad_clean.evt |
| Size (bytes) | 550,500,480 | 75,389,760 |
| Size | 525.0 MB | 71.9 MB |
| Events in quadrant A | 2,653,266 | 494,399 |
| Events in quadrant B | 5,679,873 | 476,619 |
| Events in quadrant C | 2,889,159 | 478,355 |
| Events in quadrant D | 5,080,651 | 451,133 |
| Mode M9 | |||
|---|---|---|---|
| Quadrant | BADHDUFLAG | Total packets | Discarded packets |
| A | 0 | 11 | 0 |
| B | 0 | 11 | 0 |
| C | 0 | 11 | 0 |
| D | 0 | 11 | 0 |
| Mode M0 | |||
|---|---|---|---|
| Quadrant | BADHDUFLAG | Total packets | Discarded packets |
| A | 0 | 11316 | 1 |
| B | 0 | 20870 | 1 |
| C | 0 | 11980 | 1 |
| D | 0 | 19107 | 1 |
| Mode SS | |||
|---|---|---|---|
| Quadrant | BADHDUFLAG | Total packets | Discarded packets |
| A | 0 | 112 | 0 |
| B | 0 | 112 | 0 |
| C | 0 | 112 | 0 |
| D | 0 | 112 | 0 |
| Quadrant | Total seconds | Saturated seconds | Saturation percentage |
|---|---|---|---|
| A | 5455 | 22 | 0.403300% |
| B | 5456 | 432 | 7.917889% |
| C | 5456 | 113 | 2.071114% |
| D | 5456 | 222 | 4.068915% |
Noise dominated data is calculated using 1-second bins in cleaned event files. If a bin has >2000 counts, and if more than 50% of those come from <1% of pixels, then it is considered to be noise-dominated and hence unusable.
| Quadrant | # 1 sec bins | Bins with >0 counts | Bins with >2000 counts | High rate bins dominated by noise | Noise dominated (total time) | Noise dominated (detector-on time) | Marked lightcurve |
|---|---|---|---|---|---|---|---|
| A | 6560 | 5456 | 0 | 0 | 0.00% | 0.00% | 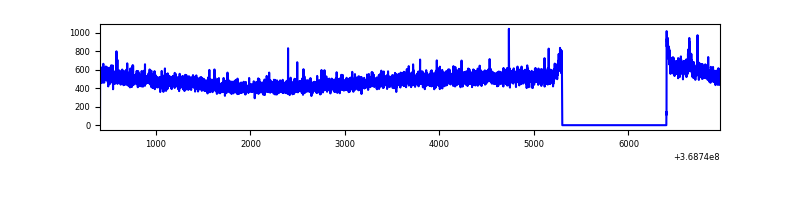 |
| B | 6561 | 5457 | 199 | 199 | 3.03% | 3.65% | 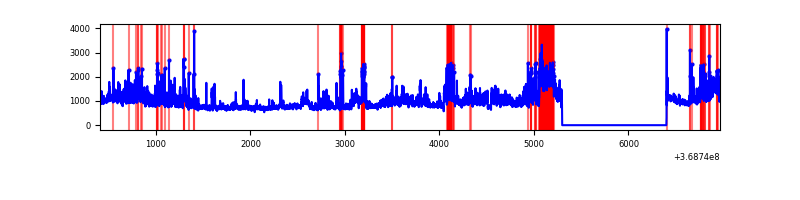 |
| C | 6561 | 5457 | 34 | 34 | 0.52% | 0.62% | 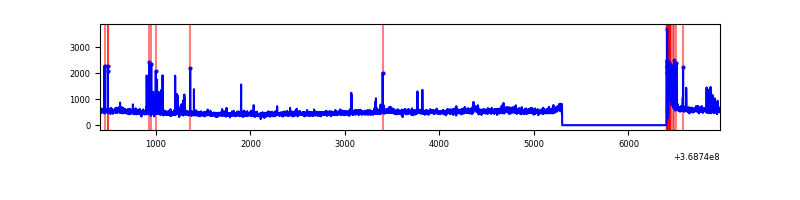 |
| D | 6561 | 5457 | 205 | 205 | 3.12% | 3.76% | 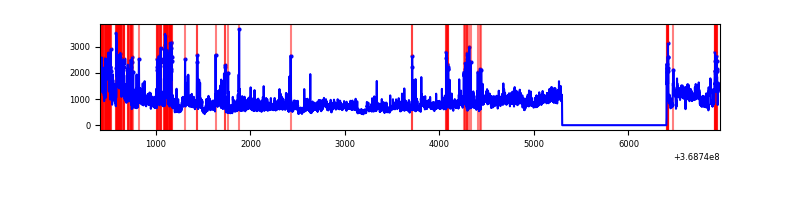 |
Top three noisy pixels from each quadrant. If the there are fewer than three noisy pixels in the level2.evt file, extra rows are filled as -1
| Pixel properties | Quadrant properties | ||||||
|---|---|---|---|---|---|---|---|
| Quadrant | DetID | PixID | Counts | Sigma | Mean | Median | Sigma |
| A | 13 | 6 | 21505 | 152.83 | 677 | 667 | 136.3 |
| A | 12 | 189 | 14372 | 100.52 | 677 | 667 | 136.3 |
| A | 13 | 254 | 11124 | 76.69 | 677 | 667 | 136.3 |
| B | 6 | 159 | 1575581 | 12635.92 | 659 | 643 | 124.6 |
| B | 10 | 245 | 1116226 | 8950.46 | 659 | 643 | 124.6 |
| B | 5 | 172 | 169680 | 1356.2 | 659 | 643 | 124.6 |
| C | 0 | 10 | 181818 | 1197.11 | 643 | 648 | 151.3 |
| C | 14 | 238 | 110194 | 723.84 | 643 | 648 | 151.3 |
| C | 3 | 233 | 57469 | 375.45 | 643 | 648 | 151.3 |
| D | 8 | 195 | 1932622 | 12589.11 | 640 | 623 | 153.5 |
| D | 12 | 233 | 467737 | 3043.76 | 640 | 623 | 153.5 |
| D | 12 | 218 | 99094 | 641.65 | 640 | 623 | 153.5 |
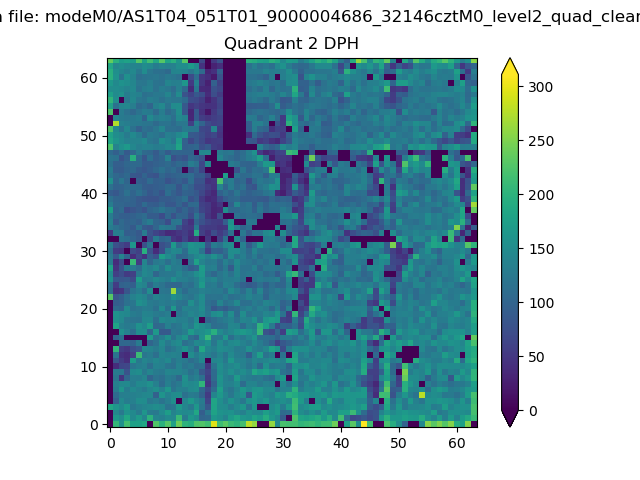
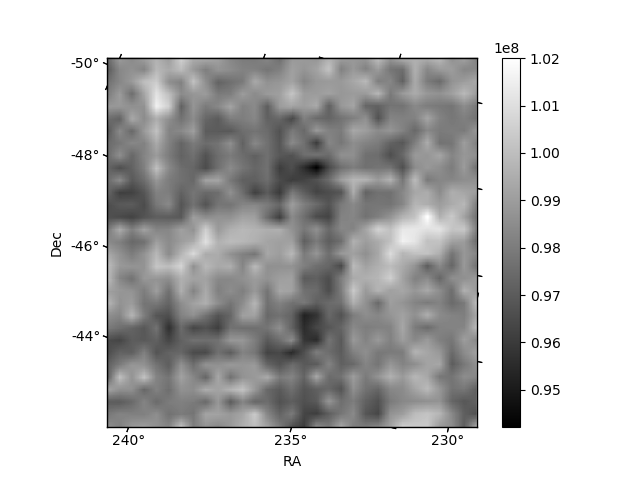
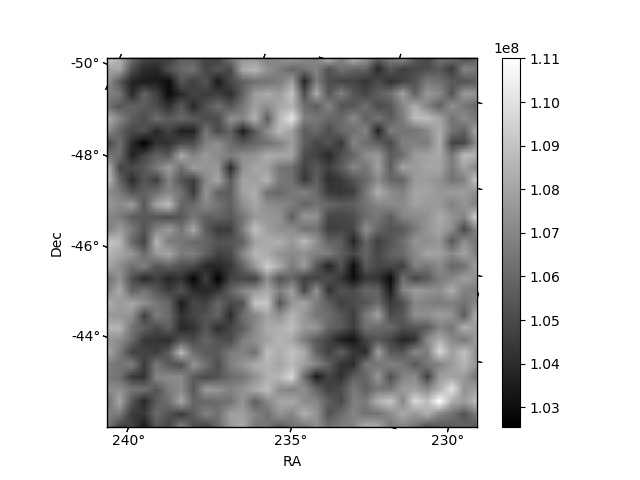
Histogram calculated using DETX and DETY for each event in the final _common_clean file
| Quadrant A |  |
 |
Quadrant B |
|---|---|---|---|
| Quadrant D | 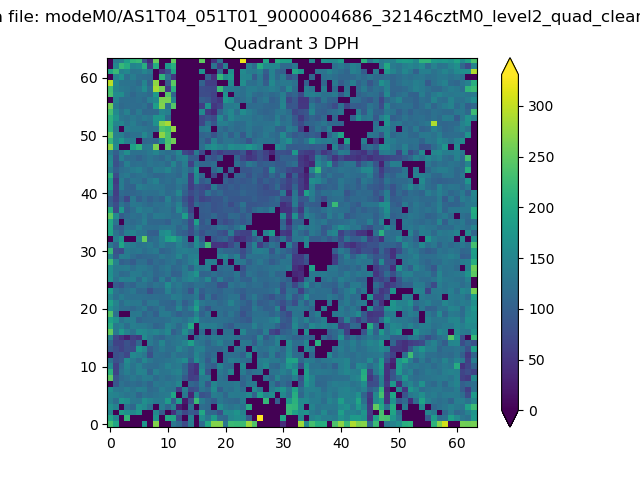 |
 |
Quadrant C |
| Plot type | Count rate plots | Images |
|---|---|---|
| Comparison with Poisson distribution Blue bars denote a histogram of data divided into 1 sec bins. Red curve is a Poisson curve with rate = median count rate of data. |
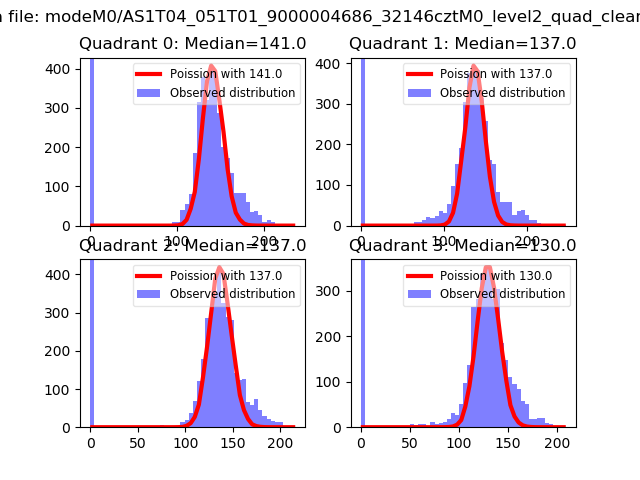 |
 |
| Quadrant-wise count rates Data is divided into 100 sec bins |
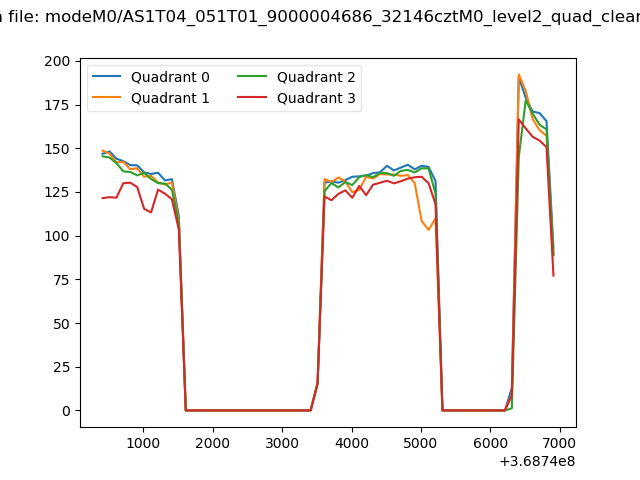 |
|
| Module-wise count rates for Quadrant A Data is divided into 100 sec bins |
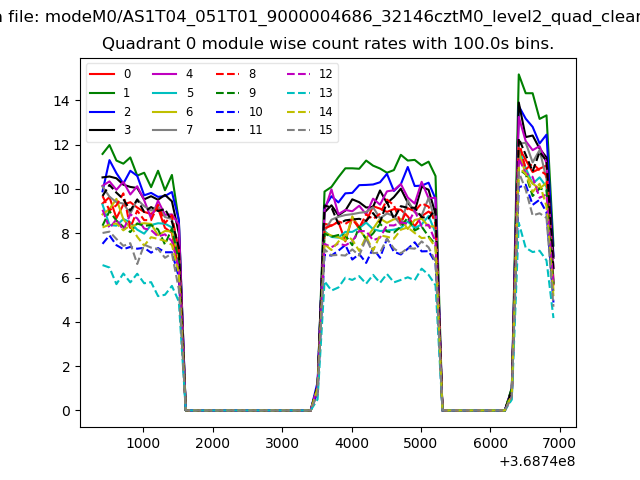 |
 |
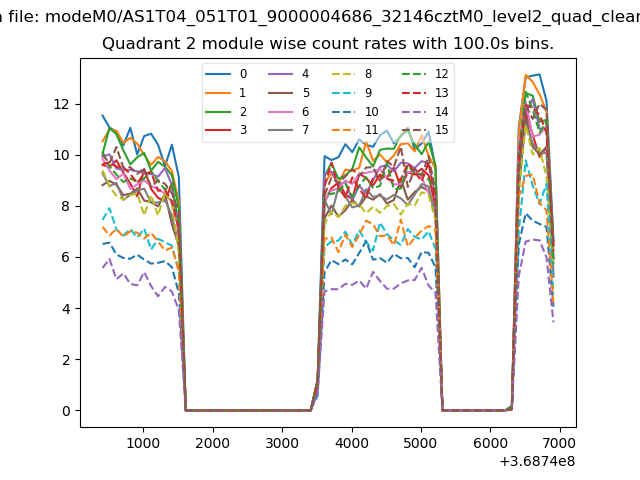
| Module-wise count rates for Quadrant B Data is divided into 100 sec bins |
 |
 |
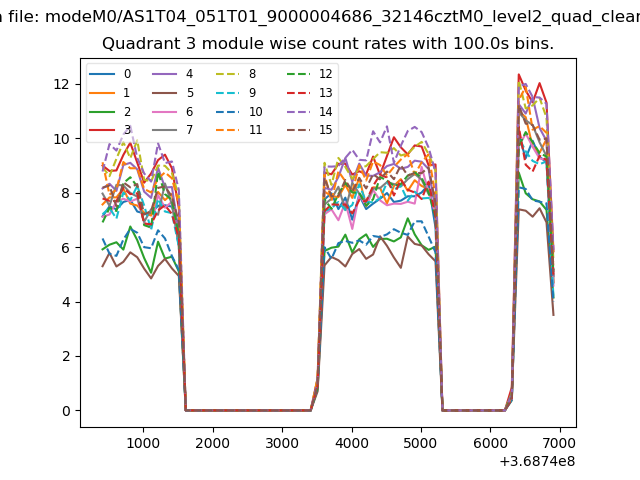
| Module-wise count rates for Quadrant C Data is divided into 100 sec bins |
 |
 |
| Module-wise count rates for Quadrant D Data is divided into 100 sec bins |
 |
 |
| Parameter | Plot |
|---|---|
| CZT HV Monitor |  |
| D_VDD | 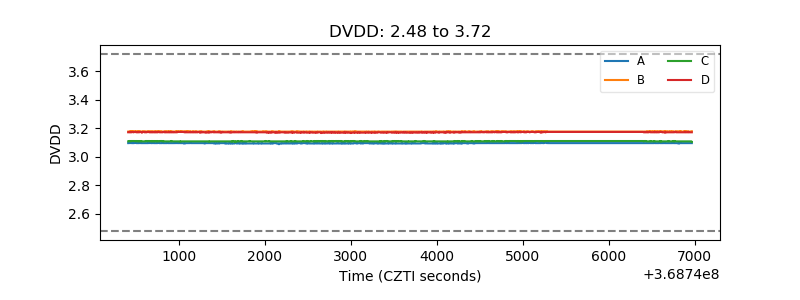 |
| Temperature 1 | 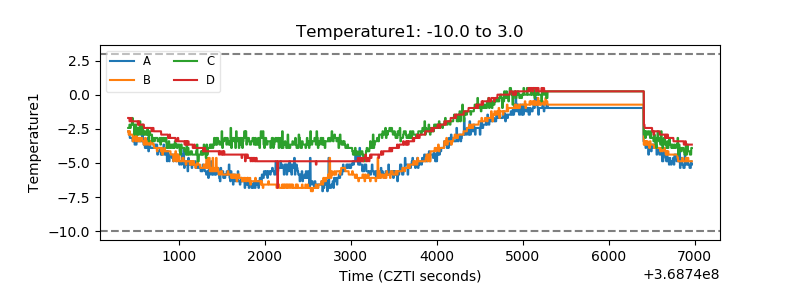 |
| Veto HV Monitor | 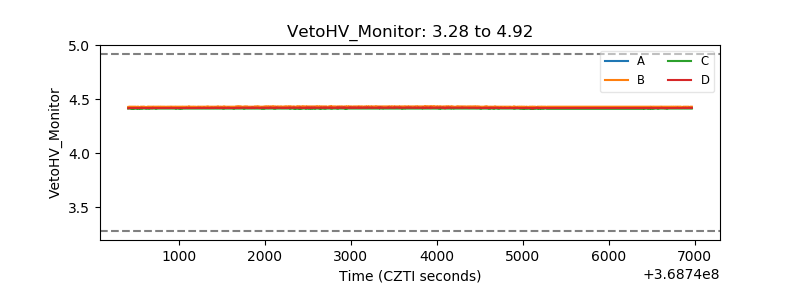 |
| Veto LLD | 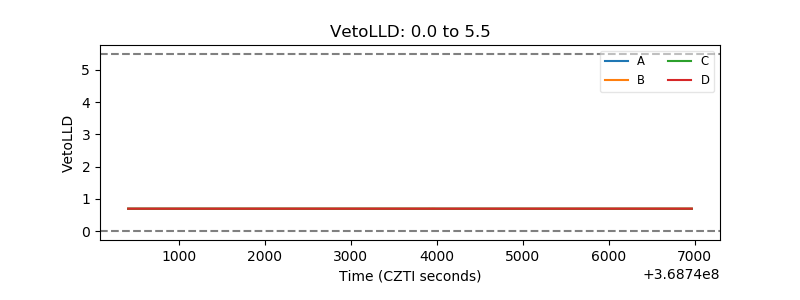 |
| Alpha Counter | 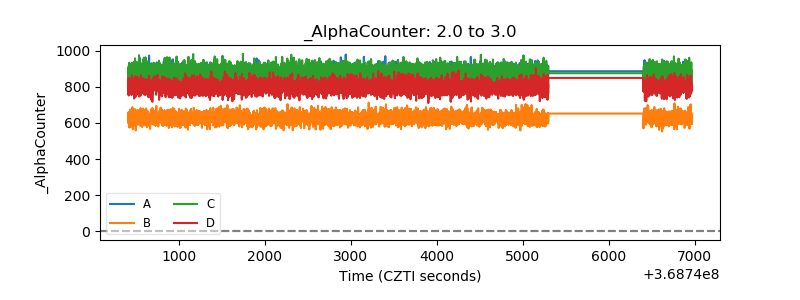 |
| _CPM_Rate | 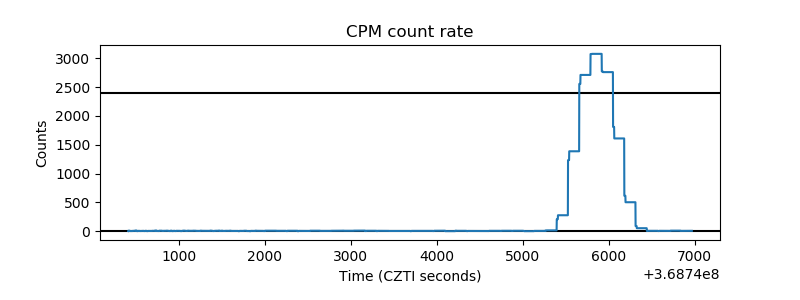 |
| CZT Counter | 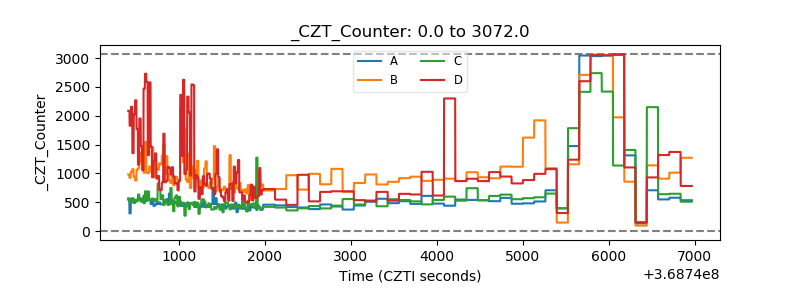 |
| +2.5 Volts monitor |  |
| +5 Volts monitor |  |
| _ROLL_ROT | 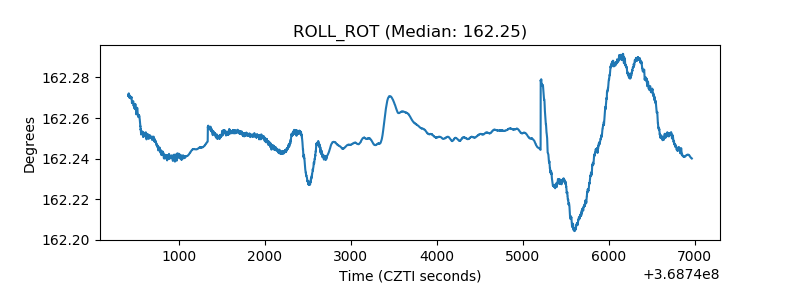 |
| _Roll_DEC | 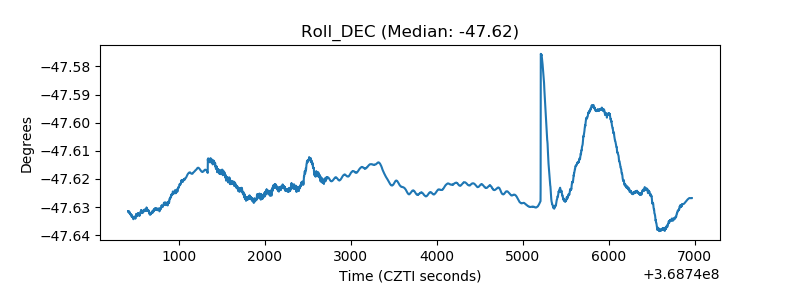 |
| _Roll_RA | 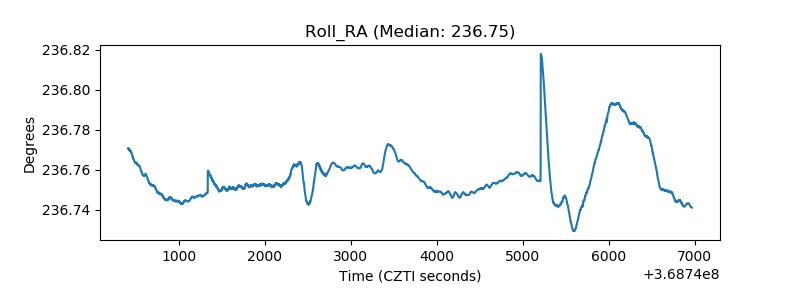 |
| Veto Counter | 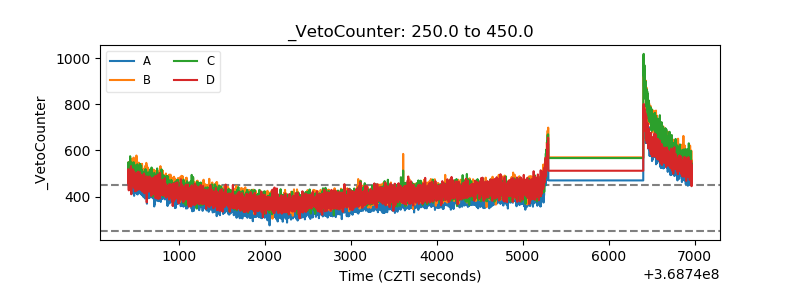 |