| Param | Original file | Final file |
|---|---|---|
| Filename | modeM0/AS1A10_053T11_9000004688cztM0_level2.fits | modeM0/AS1A10_053T11_9000004688cztM0_level2_quad_clean.evt |
| Size (bytes) | 293,313,600 | 112,550,400 |
| Size | 279.7 MB | 107.3 MB |
| Events in quadrant A | 1,886,882 | 426,558 |
| Events in quadrant B | 1,712,034 | 409,967 |
| Events in quadrant C | 1,809,828 | 367,652 |
| Events in quadrant D | 1,622,480 | 350,642 |
| Mode M0 | |||
|---|---|---|---|
| Quadrant | BADHDUFLAG | Total packets | Discarded packets |
| A | 0 | 57072 | 0 |
| B | 0 | 96498 | 0 |
| C | 0 | 75007 | 0 |
| D | 0 | 77679 | 0 |
| Mode SS | |||
|---|---|---|---|
| Quadrant | BADHDUFLAG | Total packets | Discarded packets |
| A | 0 | 546 | 0 |
| B | 0 | 548 | 0 |
| C | 0 | 550 | 0 |
| D | 0 | 544 | 0 |
| Mode M9 | |||
|---|---|---|---|
| Quadrant | BADHDUFLAG | Total packets | Discarded packets |
| A | 0 | 65 | 0 |
| B | 0 | 65 | 0 |
| C | 0 | 65 | 0 |
| D | 0 | 65 | 0 |
| Quadrant | Total seconds | Saturated seconds | Saturation percentage |
|---|---|---|---|
| A | 26960 | 197 | 0.730712% |
| B | 26888 | 2301 | 8.557721% |
| C | 26861 | 2013 | 7.494136% |
| D | 26951 | 883 | 3.276316% |
Noise dominated data is calculated using 1-second bins in cleaned event files. If a bin has >2000 counts, and if more than 50% of those come from <1% of pixels, then it is considered to be noise-dominated and hence unusable.
| Quadrant | # 1 sec bins | Bins with >0 counts | Bins with >2000 counts | High rate bins dominated by noise | Noise dominated (total time) | Noise dominated (detector-on time) | Marked lightcurve |
|---|---|---|---|---|---|---|---|
| A | 34407 | 27047 | 0 | 0 | 0.00% | 0.00% |  |
| B | 34407 | 26984 | 0 | 0 | 0.00% | 0.00% |  |
| C | 34406 | 26939 | 0 | 0 | 0.00% | 0.00% |  |
| D | 34407 | 27054 | 0 | 0 | 0.00% | 0.00% |  |
Top three noisy pixels from each quadrant. If the there are fewer than three noisy pixels in the level2.evt file, extra rows are filled as -1
| Pixel properties | Quadrant properties | ||||||
|---|---|---|---|---|---|---|---|
| Quadrant | DetID | PixID | Counts | Sigma | Mean | Median | Sigma |
| A | 0 | 29 | 1826 | 11.34 | 492 | 466 | 120.0 |
| A | 9 | 19 | 1460 | 8.29 | 492 | 466 | 120.0 |
| A | 0 | 30 | 1442 | 8.14 | 492 | 466 | 120.0 |
| B | 2 | 9 | 1343 | 10.09 | 454 | 437 | 89.8 |
| B | 3 | 17 | 1142 | 7.85 | 454 | 437 | 89.8 |
| B | 3 | 80 | 1118 | 7.58 | 454 | 437 | 89.8 |
| C | 3 | 202 | 1401 | 7.9 | 478 | 454 | 119.8 |
| C | 1 | 81 | 1390 | 7.81 | 478 | 454 | 119.8 |
| C | 1 | 80 | 1376 | 7.69 | 478 | 454 | 119.8 |
| D | 10 | 189 | 1205 | 6.36 | 463 | 425 | 122.7 |
| D | 6 | 62 | 1129 | 5.74 | 463 | 425 | 122.7 |
| D | 6 | 67 | 1122 | 5.68 | 463 | 425 | 122.7 |
Histogram calculated using DETX and DETY for each event in the final _common_clean file
| Quadrant A |  |
 |
Quadrant B |
|---|---|---|---|
| Quadrant D |  |
 |
Quadrant C |
| Plot type | Count rate plots | Images |
|---|---|---|
| Comparison with Poisson distribution Blue bars denote a histogram of data divided into 1 sec bins. Red curve is a Poisson curve with rate = median count rate of data. |
 |
 |
| Quadrant-wise count rates Data is divided into 100 sec bins |
 |
|
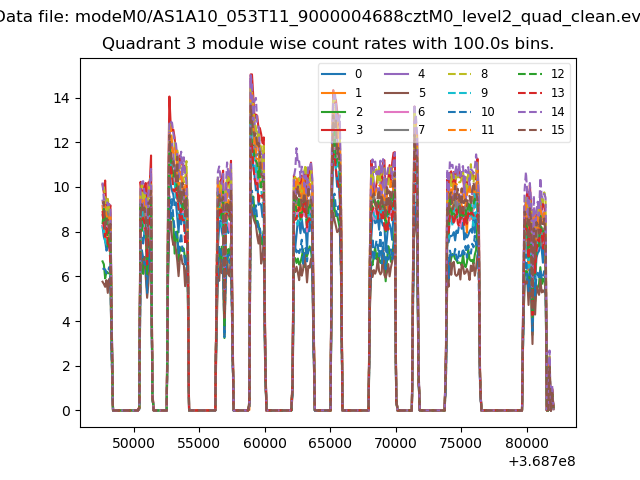
| Module-wise count rates for Quadrant A Data is divided into 100 sec bins |
 |
 |
| Module-wise count rates for Quadrant B Data is divided into 100 sec bins |
 |
 |
| Module-wise count rates for Quadrant C Data is divided into 100 sec bins |
 |
 |
| Module-wise count rates for Quadrant D Data is divided into 100 sec bins |
 |
 |
| Parameter | Plot |
|---|---|
| CZT HV Monitor |  |
| D_VDD |  |
| Temperature 1 |  |
| Veto HV Monitor |  |
| Veto LLD |  |
| Alpha Counter |  |
| _CPM_Rate | 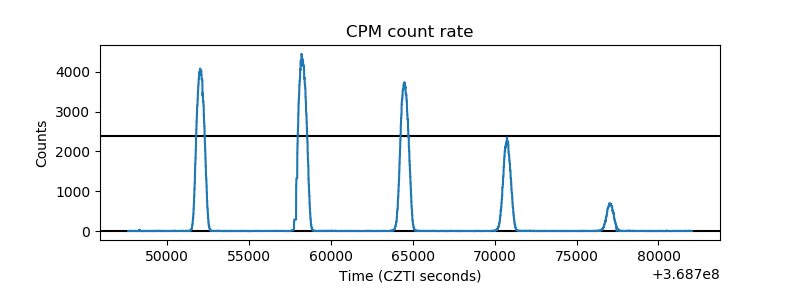 |
| CZT Counter |  |
| +2.5 Volts monitor |  |
| +5 Volts monitor | 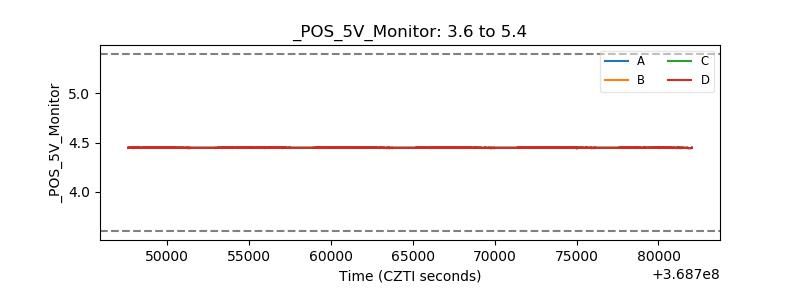 |
| _ROLL_ROT |  |
| _Roll_DEC | 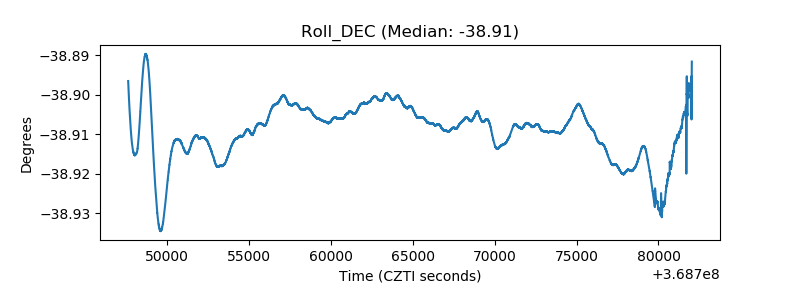 |
| _Roll_RA | 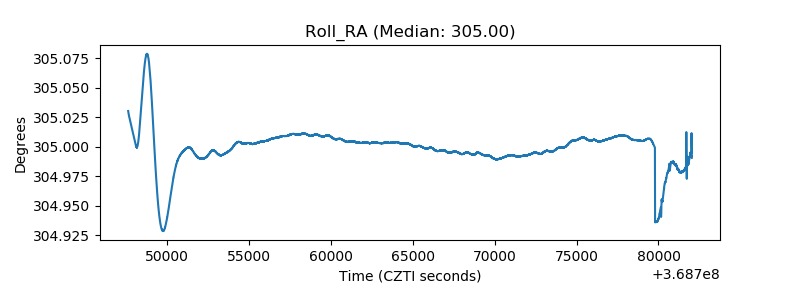 |
| Veto Counter |  |