| Param | Original file | Final file |
|---|---|---|
| Filename | modeM0/AS1A10_053T11_9000004688_32150cztM0_level2.evt | modeM0/AS1A10_053T11_9000004688_32150cztM0_level2_quad_clean.evt |
| Size (bytes) | 657,400,320 | 79,669,440 |
| Size | 626.9 MB | 76.0 MB |
| Events in quadrant A | 3,401,155 | 508,766 |
| Events in quadrant B | 6,178,675 | 493,366 |
| Events in quadrant C | 5,220,783 | 480,578 |
| Events in quadrant D | 4,683,877 | 489,723 |
| Mode M0 | |||
|---|---|---|---|
| Quadrant | BADHDUFLAG | Total packets | Discarded packets |
| A | 0 | 13655 | 2 |
| B | 0 | 22449 | 2 |
| C | 0 | 19857 | 2 |
| D | 0 | 18551 | 2 |
| Mode SS | |||
|---|---|---|---|
| Quadrant | BADHDUFLAG | Total packets | Discarded packets |
| A | 0 | 126 | 0 |
| B | 0 | 126 | 0 |
| C | 0 | 126 | 0 |
| D | 0 | 126 | 0 |
| Mode M9 | |||
|---|---|---|---|
| Quadrant | BADHDUFLAG | Total packets | Discarded packets |
| A | 0 | 20 | 0 |
| B | 0 | 21 | 0 |
| C | 0 | 21 | 0 |
| D | 0 | 21 | 0 |
| Quadrant | Total seconds | Saturated seconds | Saturation percentage |
|---|---|---|---|
| A | 6308 | 53 | 0.840203% |
| B | 6308 | 464 | 7.355739% |
| C | 6308 | 467 | 7.403297% |
| D | 6308 | 90 | 1.426760% |
Noise dominated data is calculated using 1-second bins in cleaned event files. If a bin has >2000 counts, and if more than 50% of those come from <1% of pixels, then it is considered to be noise-dominated and hence unusable.
| Quadrant | # 1 sec bins | Bins with >0 counts | Bins with >2000 counts | High rate bins dominated by noise | Noise dominated (total time) | Noise dominated (detector-on time) | Marked lightcurve |
|---|---|---|---|---|---|---|---|
| A | 7648 | 6309 | 0 | 0 | 0.00% | 0.00% | 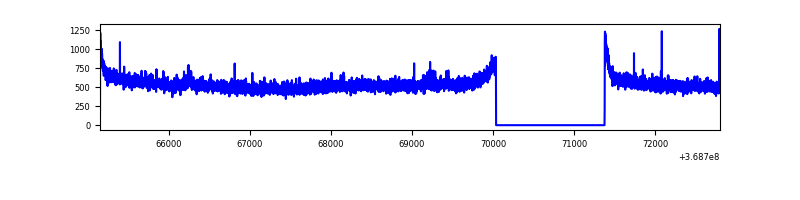 |
| B | 7648 | 6309 | 193 | 193 | 2.52% | 3.06% | 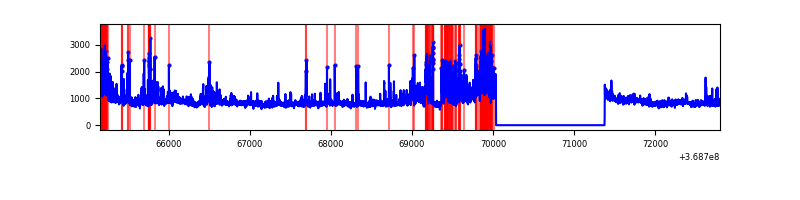 |
| C | 7648 | 6309 | 209 | 209 | 2.73% | 3.31% | 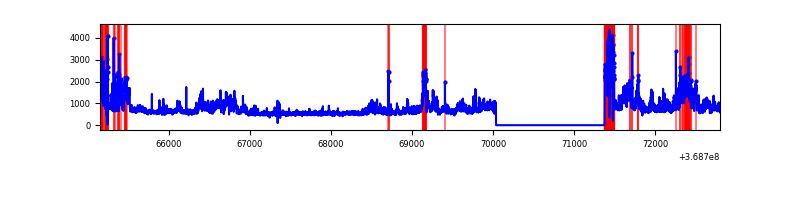 |
| D | 7648 | 6309 | 35 | 35 | 0.46% | 0.55% | 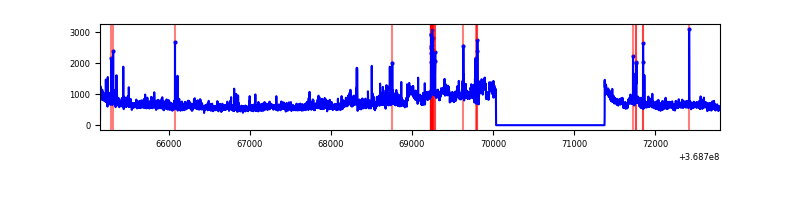 |
Top three noisy pixels from each quadrant. If the there are fewer than three noisy pixels in the level2.evt file, extra rows are filled as -1
| Pixel properties | Quadrant properties | ||||||
|---|---|---|---|---|---|---|---|
| Quadrant | DetID | PixID | Counts | Sigma | Mean | Median | Sigma |
| A | 12 | 189 | 31170 | 177.04 | 871 | 858 | 171.2 |
| A | 13 | 254 | 11542 | 62.4 | 871 | 858 | 171.2 |
| A | 13 | 6 | 8941 | 47.21 | 871 | 858 | 171.2 |
| B | 6 | 159 | 1638116 | 10385.49 | 853 | 834 | 157.7 |
| B | 10 | 245 | 1099813 | 6970.96 | 853 | 834 | 157.7 |
| B | 0 | 190 | 69399 | 434.92 | 853 | 834 | 157.7 |
| C | 3 | 233 | 1264679 | 6606.1 | 833 | 844 | 191.3 |
| C | 0 | 10 | 499150 | 2604.66 | 833 | 844 | 191.3 |
| C | 14 | 238 | 149988 | 779.58 | 833 | 844 | 191.3 |
| D | 8 | 195 | 1283740 | 6377.82 | 856 | 837 | 201.2 |
| D | 12 | 233 | 75863 | 372.98 | 856 | 837 | 201.2 |
| D | 12 | 218 | 45508 | 222.08 | 856 | 837 | 201.2 |
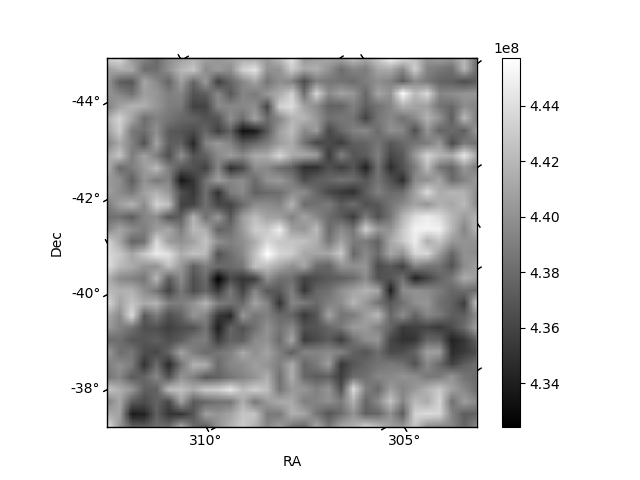
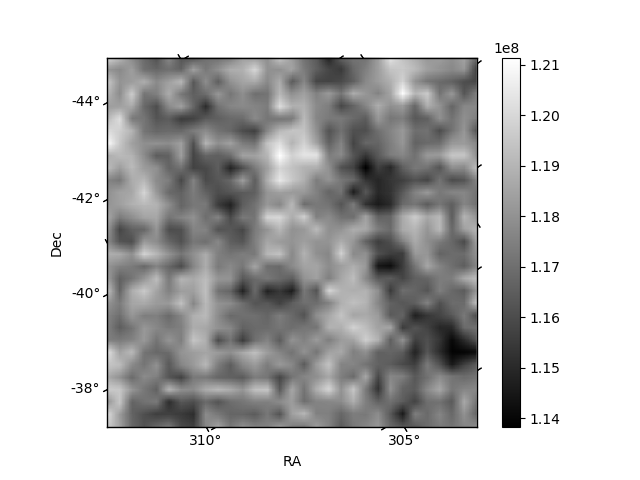
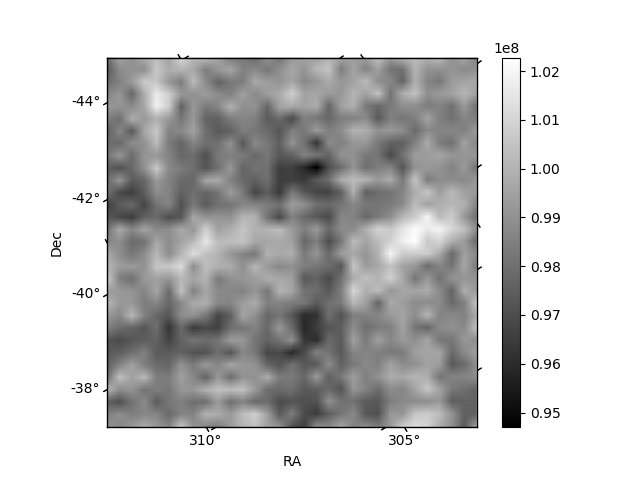
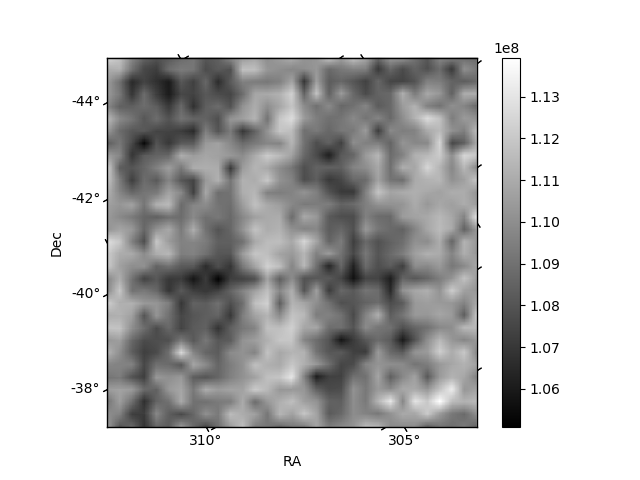
Histogram calculated using DETX and DETY for each event in the final _common_clean file
| Quadrant A | 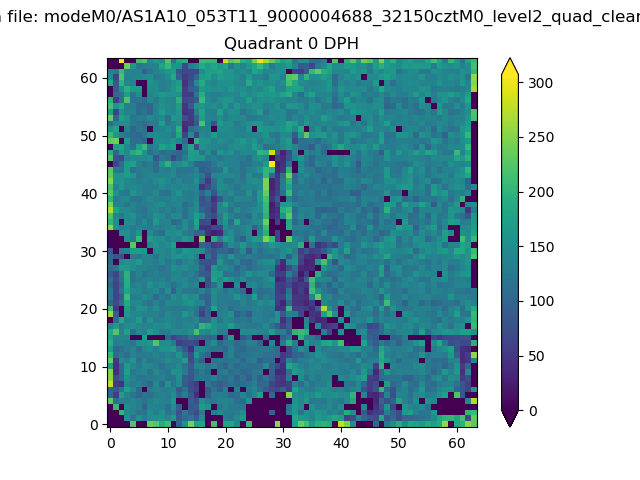 |
 |
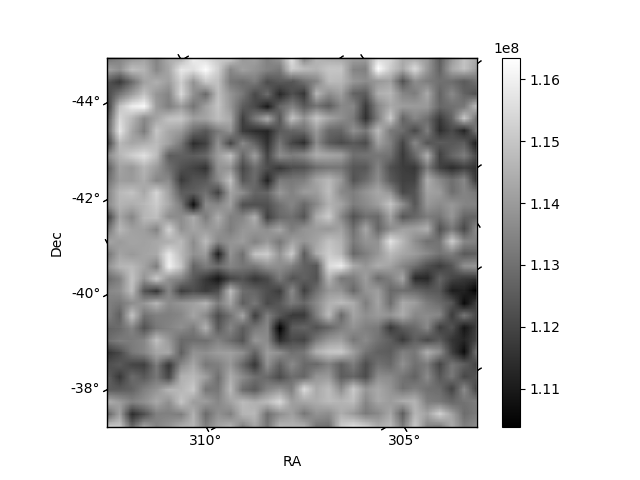
Quadrant B |
|---|---|---|---|
| Quadrant D | 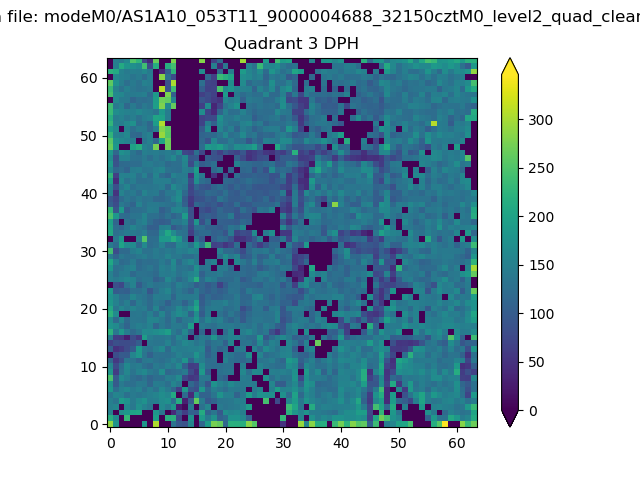 |
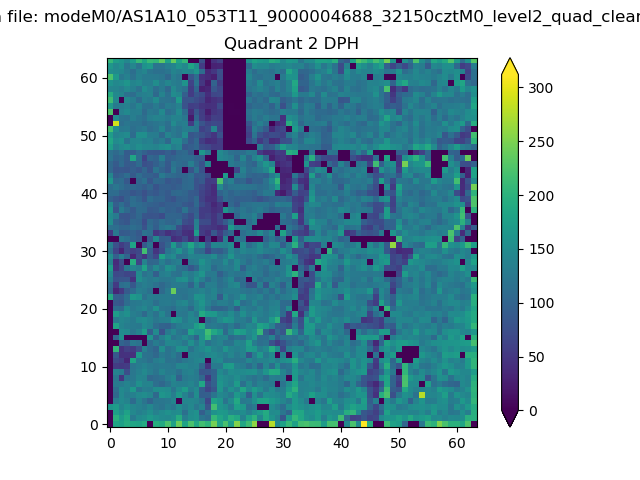 |
Quadrant C |
| Plot type | Count rate plots | Images |
|---|---|---|
| Comparison with Poisson distribution Blue bars denote a histogram of data divided into 1 sec bins. Red curve is a Poisson curve with rate = median count rate of data. |
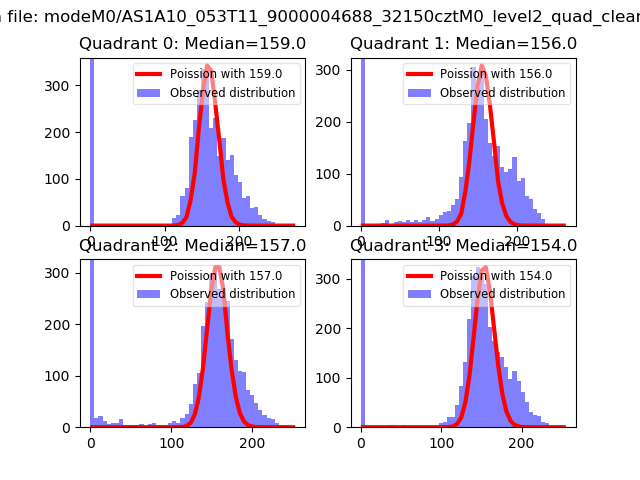 |
 |
| Quadrant-wise count rates Data is divided into 100 sec bins |
 |
|
| Module-wise count rates for Quadrant A Data is divided into 100 sec bins |
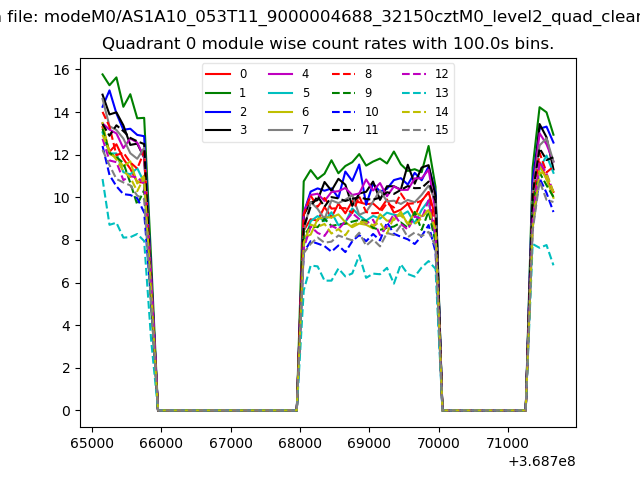 |
 |
| Module-wise count rates for Quadrant B Data is divided into 100 sec bins |
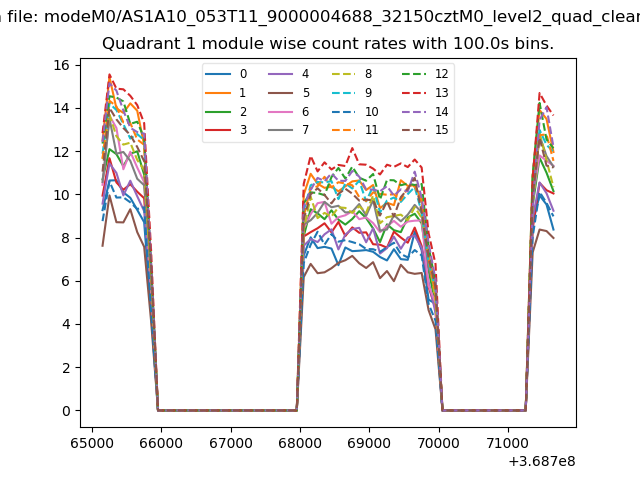 |
 |
| Module-wise count rates for Quadrant C Data is divided into 100 sec bins |
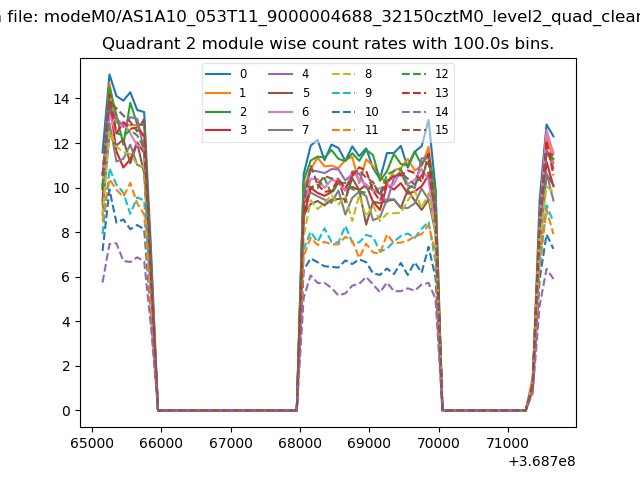 |
 |
| Module-wise count rates for Quadrant D Data is divided into 100 sec bins |
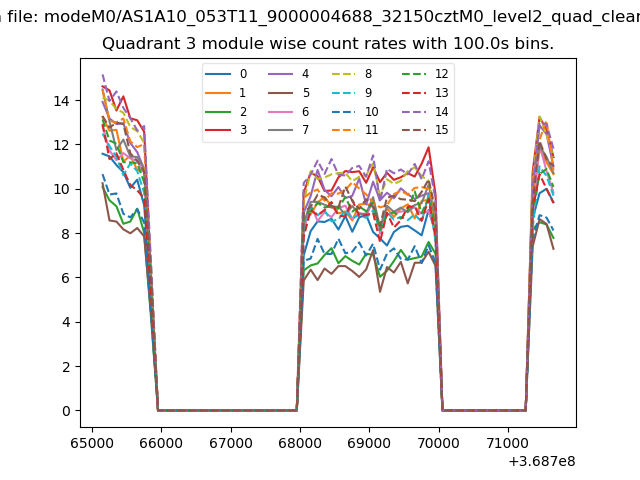 |
 |
| Parameter | Plot |
|---|---|
| CZT HV Monitor | 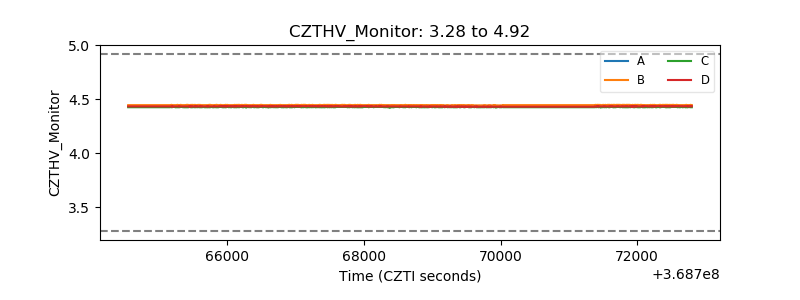 |
| D_VDD | 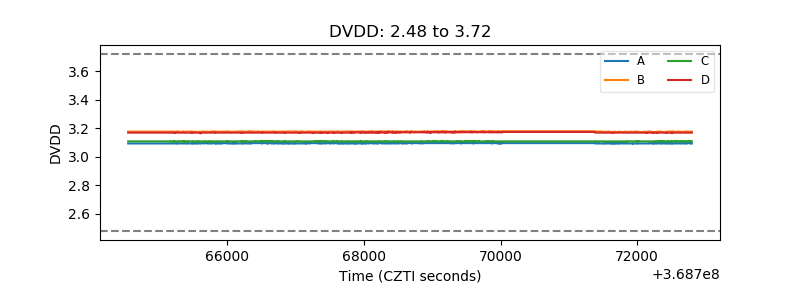 |
| Temperature 1 | 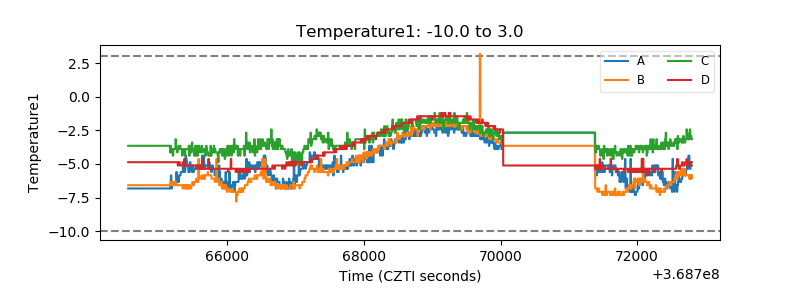 |
| Veto HV Monitor | 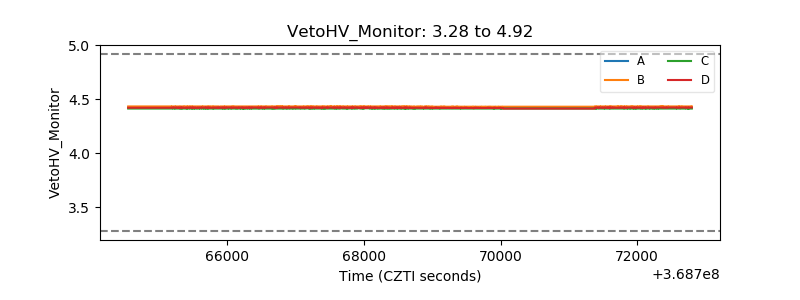 |
| Veto LLD | 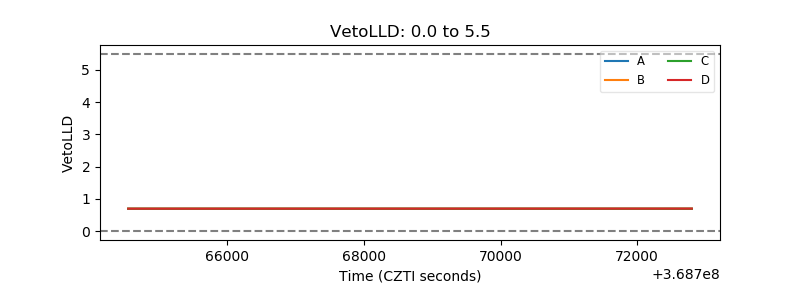 |
| Alpha Counter |  |
| _CPM_Rate | 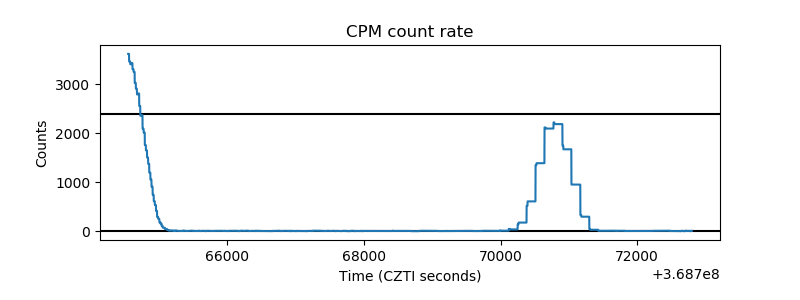 |
| CZT Counter | 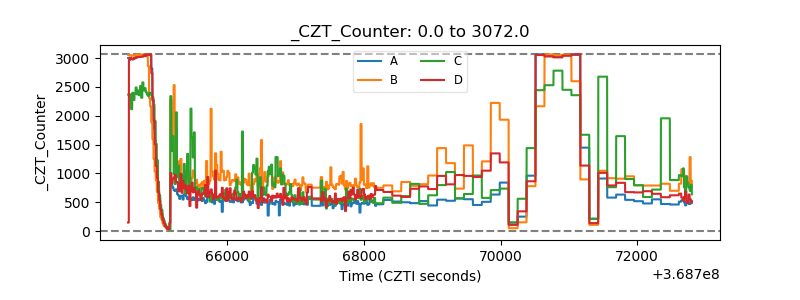 |
| +2.5 Volts monitor |  |
| +5 Volts monitor |  |
| _ROLL_ROT | 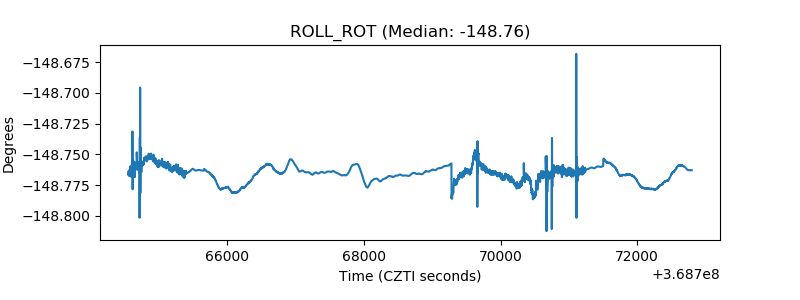 |
| _Roll_DEC | 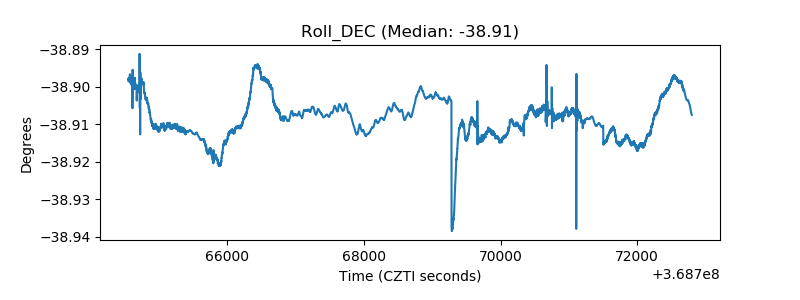 |
| _Roll_RA | 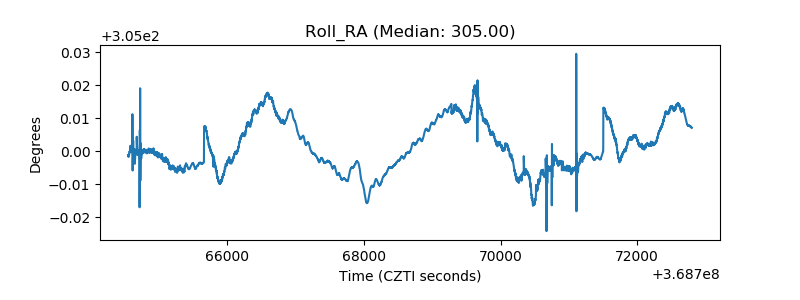 |
| Veto Counter | 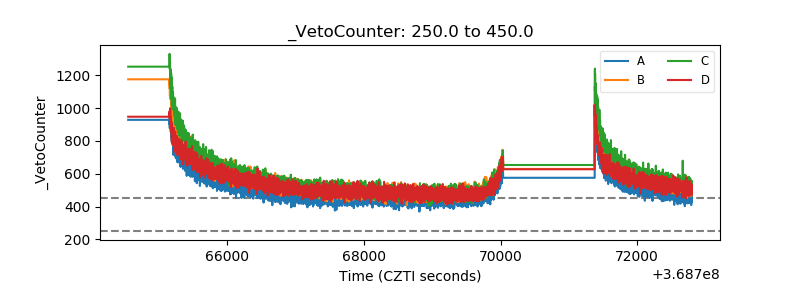 |