| Param | Original file | Final file |
|---|---|---|
| Filename | modeM0/AS1A10_053T11_9000004688_32151cztM0_level2.evt | modeM0/AS1A10_053T11_9000004688_32151cztM0_level2_quad_clean.evt |
| Size (bytes) | 604,946,880 | 71,691,840 |
| Size | 576.9 MB | 68.4 MB |
| Events in quadrant A | 3,368,535 | 438,602 |
| Events in quadrant B | 5,312,869 | 441,421 |
| Events in quadrant C | 4,818,682 | 419,169 |
| Events in quadrant D | 4,390,010 | 426,860 |
| Mode M0 | |||
|---|---|---|---|
| Quadrant | BADHDUFLAG | Total packets | Discarded packets |
| A | 0 | 13575 | 4 |
| B | 0 | 20031 | 3 |
| C | 0 | 18539 | 3 |
| D | 0 | 17526 | 3 |
| Mode SS | |||
|---|---|---|---|
| Quadrant | BADHDUFLAG | Total packets | Discarded packets |
| A | 0 | 130 | 0 |
| B | 0 | 130 | 0 |
| C | 0 | 130 | 0 |
| D | 0 | 130 | 0 |
| Mode M9 | |||
|---|---|---|---|
| Quadrant | BADHDUFLAG | Total packets | Discarded packets |
| A | 0 | 19 | 0 |
| B | 0 | 19 | 0 |
| C | 0 | 19 | 0 |
| D | 0 | 20 | 0 |
| Quadrant | Total seconds | Saturated seconds | Saturation percentage |
|---|---|---|---|
| A | 6371 | 95 | 1.491132% |
| B | 6371 | 205 | 3.217705% |
| C | 6371 | 453 | 7.110344% |
| D | 6371 | 147 | 2.307330% |
Noise dominated data is calculated using 1-second bins in cleaned event files. If a bin has >2000 counts, and if more than 50% of those come from <1% of pixels, then it is considered to be noise-dominated and hence unusable.
| Quadrant | # 1 sec bins | Bins with >0 counts | Bins with >2000 counts | High rate bins dominated by noise | Noise dominated (total time) | Noise dominated (detector-on time) | Marked lightcurve |
|---|---|---|---|---|---|---|---|
| A | 7531 | 6373 | 0 | 0 | 0.00% | 0.00% | 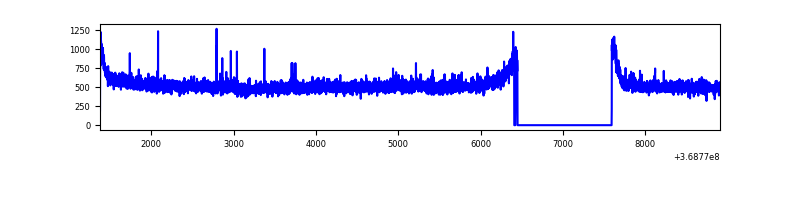 |
| B | 7531 | 6373 | 20 | 20 | 0.27% | 0.31% |  |
| C | 7531 | 6373 | 179 | 179 | 2.38% | 2.81% |  |
| D | 7531 | 6373 | 36 | 36 | 0.48% | 0.56% |  |
Top three noisy pixels from each quadrant. If the there are fewer than three noisy pixels in the level2.evt file, extra rows are filled as -1
| Pixel properties | Quadrant properties | ||||||
|---|---|---|---|---|---|---|---|
| Quadrant | DetID | PixID | Counts | Sigma | Mean | Median | Sigma |
| A | 12 | 189 | 42956 | 246.71 | 860 | 846 | 170.7 |
| A | 13 | 6 | 11059 | 59.83 | 860 | 846 | 170.7 |
| A | 13 | 254 | 10327 | 55.55 | 860 | 846 | 170.7 |
| B | 6 | 159 | 1654614 | 10323.14 | 854 | 834 | 160.2 |
| B | 10 | 245 | 241410 | 1501.71 | 854 | 834 | 160.2 |
| B | 0 | 190 | 25427 | 153.51 | 854 | 834 | 160.2 |
| C | 3 | 233 | 1043099 | 5580.37 | 810 | 819 | 186.8 |
| C | 0 | 10 | 435119 | 2325.24 | 810 | 819 | 186.8 |
| C | 14 | 238 | 141599 | 753.74 | 810 | 819 | 186.8 |
| D | 8 | 195 | 1008940 | 5123.82 | 843 | 826 | 196.8 |
| D | 12 | 233 | 129463 | 653.81 | 843 | 826 | 196.8 |
| D | 12 | 218 | 33162 | 164.35 | 843 | 826 | 196.8 |
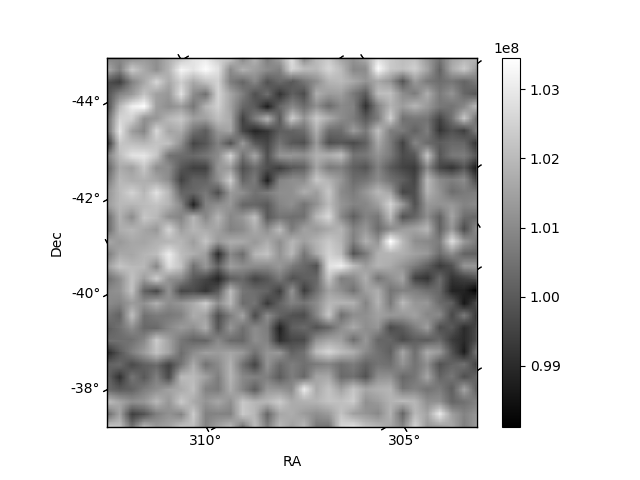
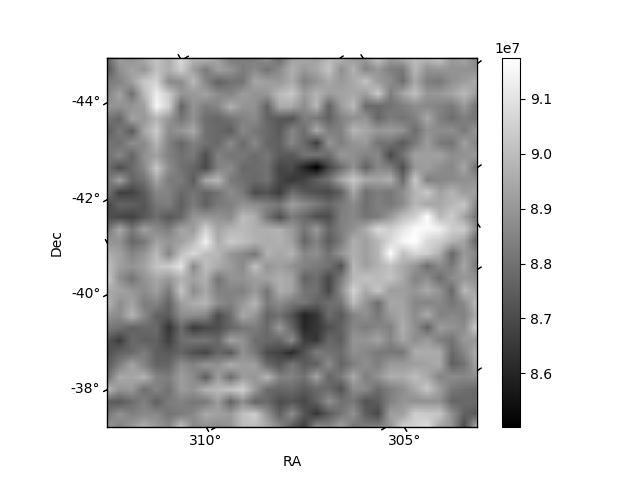
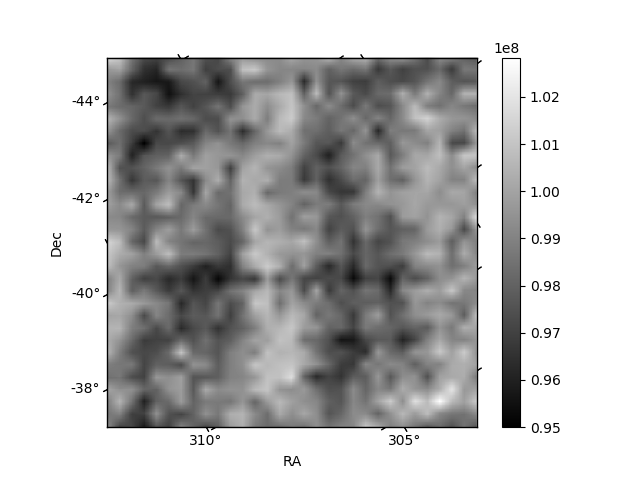
Histogram calculated using DETX and DETY for each event in the final _common_clean file
| Quadrant A | 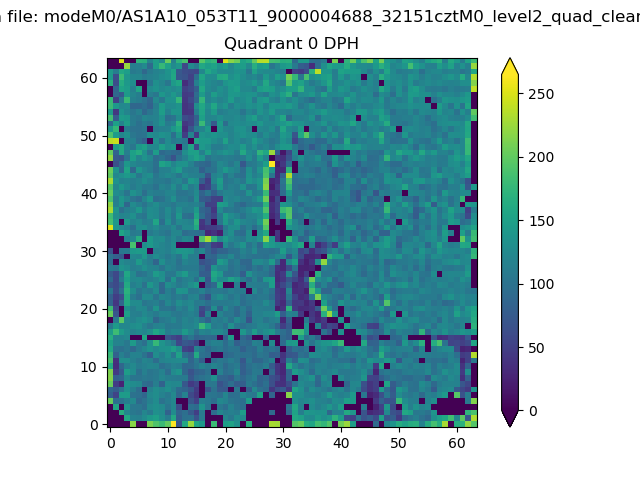 |
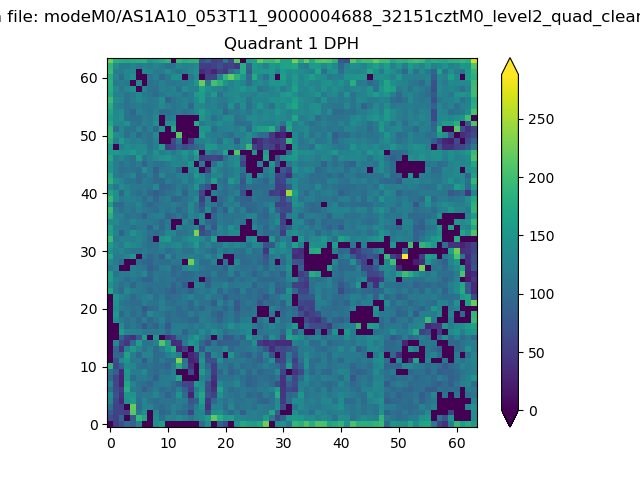 |
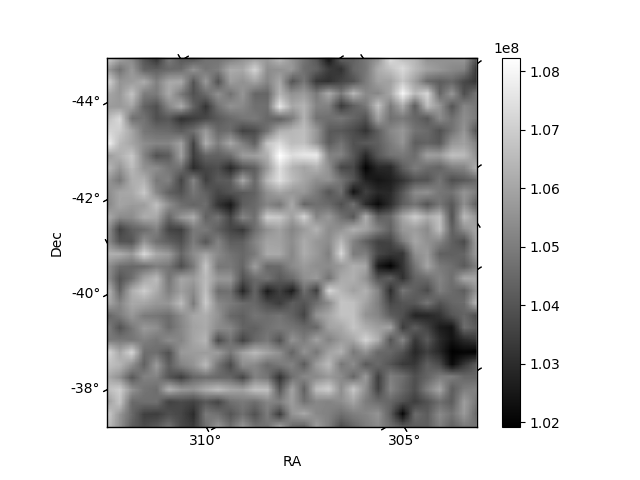
Quadrant B |
|---|---|---|---|
| Quadrant D | 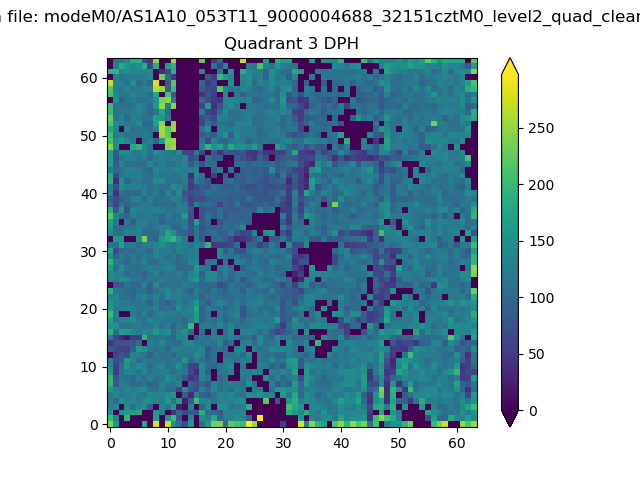 |
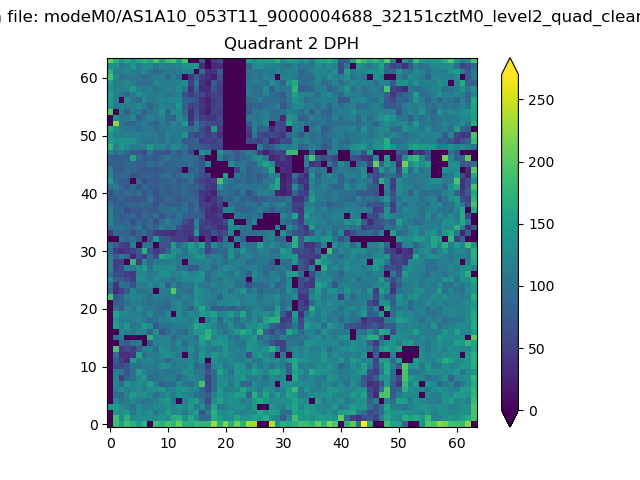 |
Quadrant C |
| Plot type | Count rate plots | Images |
|---|---|---|
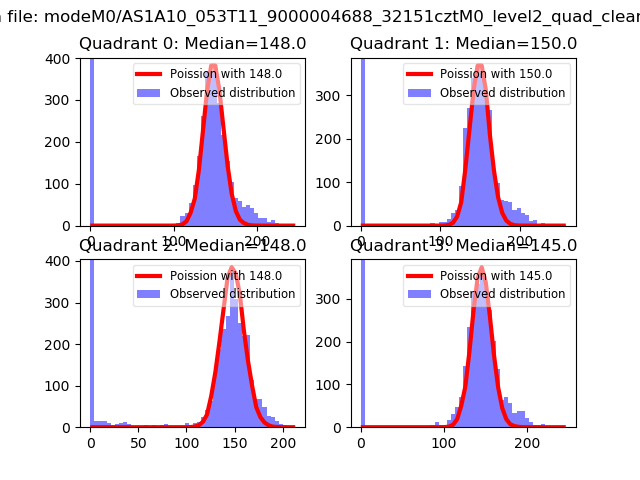
| Comparison with Poisson distribution Blue bars denote a histogram of data divided into 1 sec bins. Red curve is a Poisson curve with rate = median count rate of data. |
 |
 |
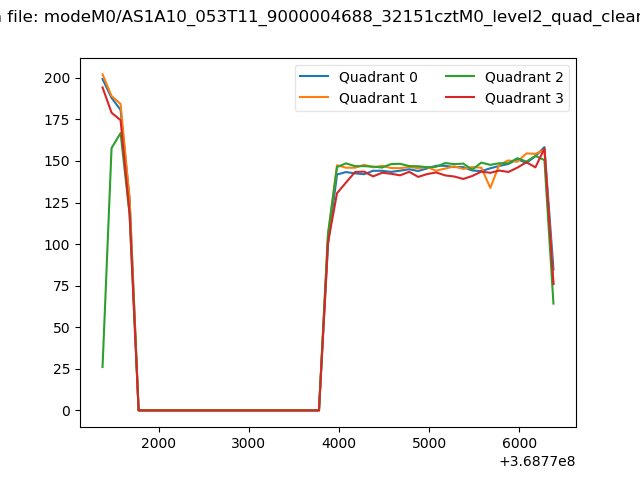
| Quadrant-wise count rates Data is divided into 100 sec bins |
 |
|
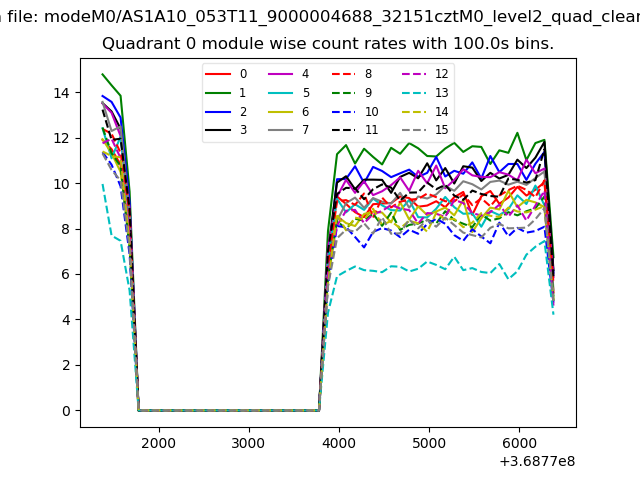
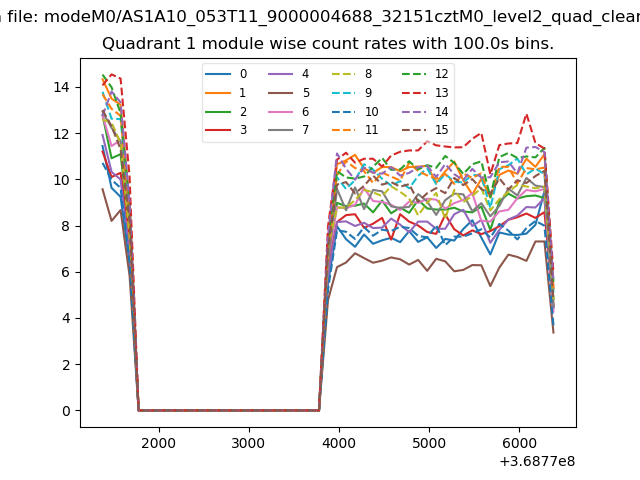
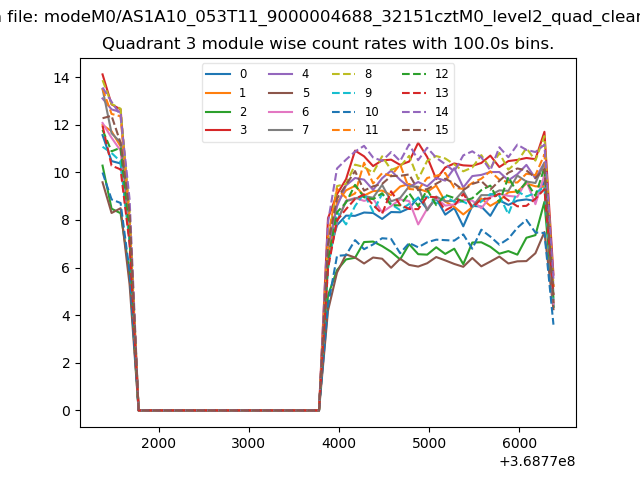
| Module-wise count rates for Quadrant A Data is divided into 100 sec bins |
 |
 |
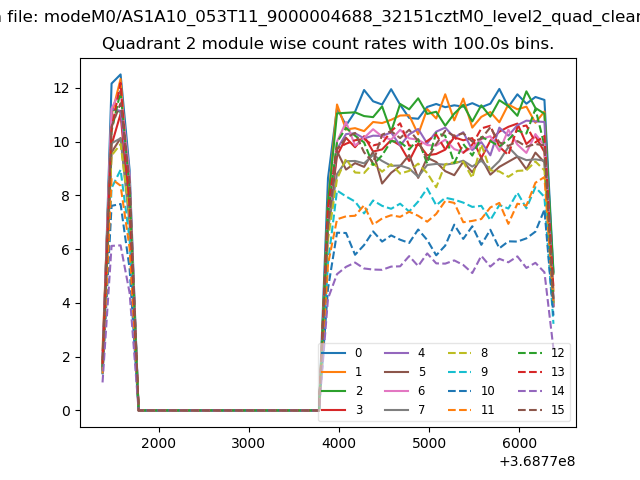
| Module-wise count rates for Quadrant B Data is divided into 100 sec bins |
 |
 |
| Module-wise count rates for Quadrant C Data is divided into 100 sec bins |
 |
 |
| Module-wise count rates for Quadrant D Data is divided into 100 sec bins |
 |
 |
| Parameter | Plot |
|---|---|
| CZT HV Monitor | 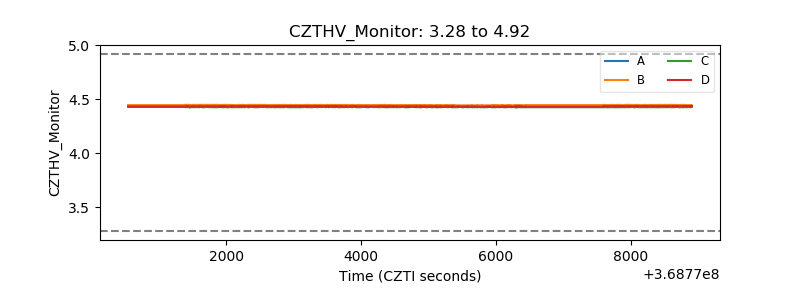 |
| D_VDD | 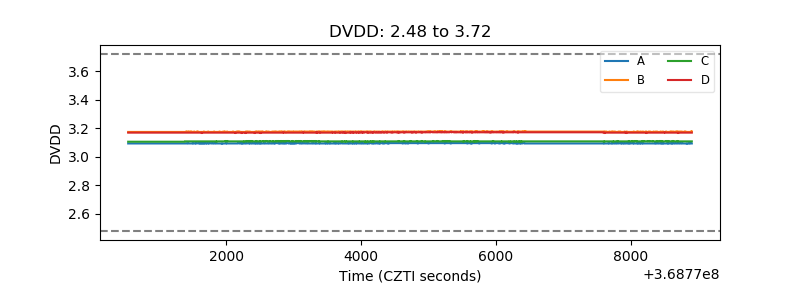 |
| Temperature 1 | 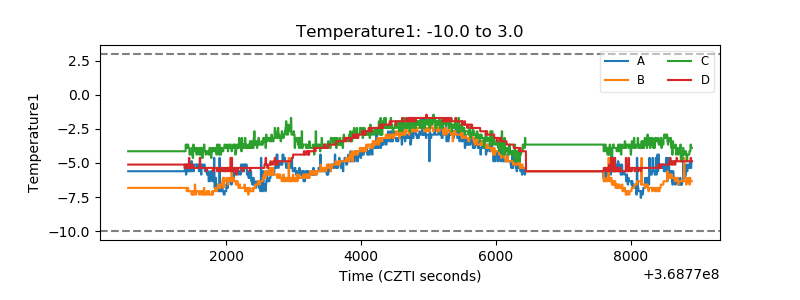 |
| Veto HV Monitor | 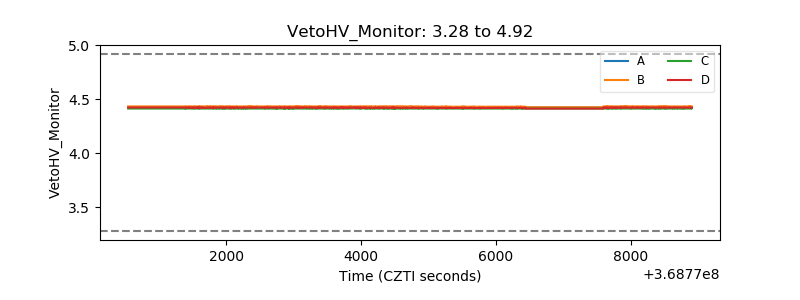 |
| Veto LLD | 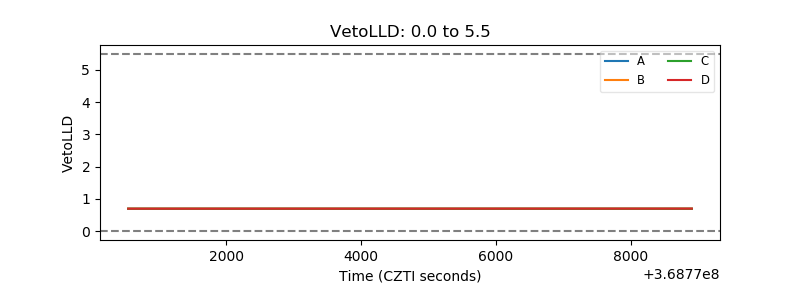 |
| Alpha Counter | 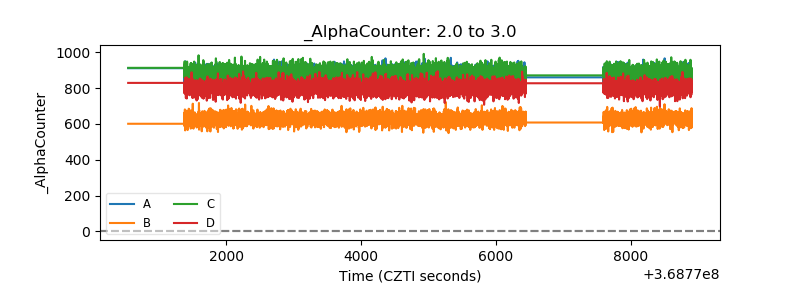 |
| _CPM_Rate | 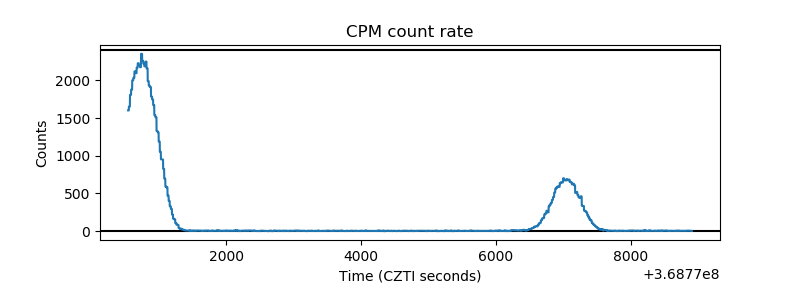 |
| CZT Counter | 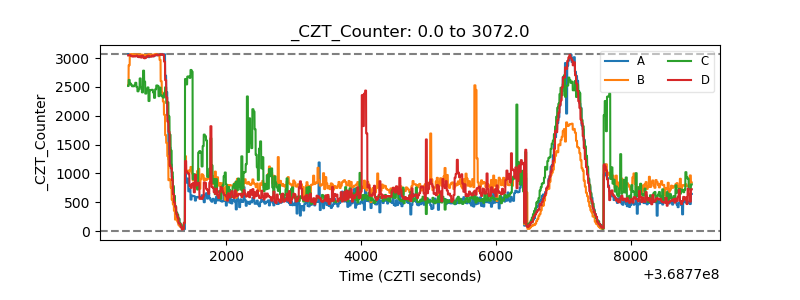 |
| +2.5 Volts monitor |  |
| +5 Volts monitor |  |
| _ROLL_ROT | 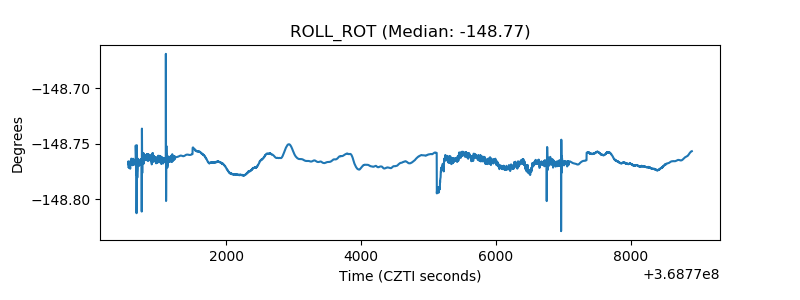 |
| _Roll_DEC | 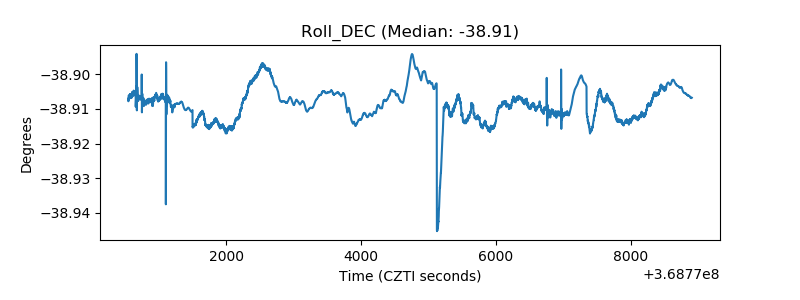 |
| _Roll_RA | 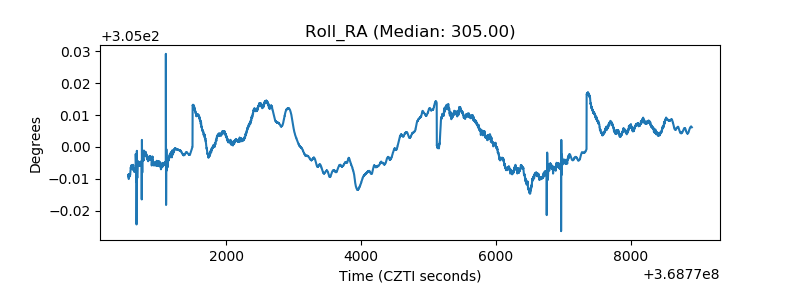 |
| Veto Counter | 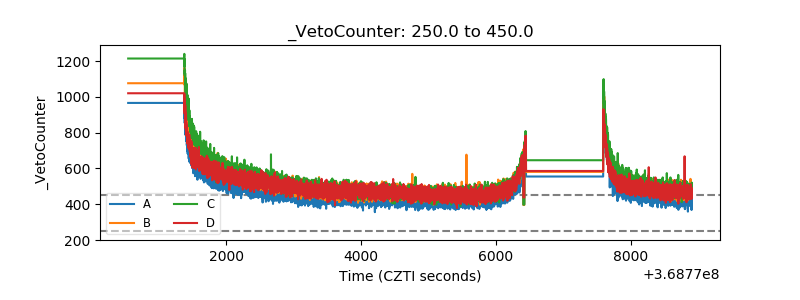 |