| Param | Original file | Final file |
|---|---|---|
| Filename | modeM0/AS1A10_053T11_9000004688_32154cztM0_level2.evt | modeM0/AS1A10_053T11_9000004688_32154cztM0_level2_quad_clean.evt |
| Size (bytes) | 326,877,120 | 35,585,280 |
| Size | 311.7 MB | 33.9 MB |
| Events in quadrant A | 1,265,751 | 242,086 |
| Events in quadrant B | 2,142,554 | 239,447 |
| Events in quadrant C | 3,725,028 | 191,482 |
| Events in quadrant D | 2,589,357 | 217,911 |
| Mode M0 | |||
|---|---|---|---|
| Quadrant | BADHDUFLAG | Total packets | Discarded packets |
| A | 0 | 7142 | 1841 |
| B | 0 | 11326 | 3210 |
| C | 0 | 16662 | 3819 |
| D | 0 | 11664 | 2236 |
| Mode SS | |||
|---|---|---|---|
| Quadrant | BADHDUFLAG | Total packets | Discarded packets |
| A | 0 | 73 | 23 |
| B | 0 | 73 | 21 |
| C | 0 | 72 | 18 |
| D | 0 | 71 | 23 |
| Mode M9 | |||
|---|---|---|---|
| Quadrant | BADHDUFLAG | Total packets | Discarded packets |
| A | 1 | 140448861330216 | 46 |
| B | 1 | -1 | -1 |
| C | 1 | -1 | -1 |
| D | 1 | -1 | -1 |
| Quadrant | Total seconds | Saturated seconds | Saturation percentage |
|---|---|---|---|
| A | 2637 | 1 | 0.037922% |
| B | 2555 | 16 | 0.626223% |
| C | 2535 | 940 | 37.080868% |
| D | 2640 | 317 | 12.007576% |
Noise dominated data is calculated using 1-second bins in cleaned event files. If a bin has >2000 counts, and if more than 50% of those come from <1% of pixels, then it is considered to be noise-dominated and hence unusable.
| Quadrant | # 1 sec bins | Bins with >0 counts | Bins with >2000 counts | High rate bins dominated by noise | Noise dominated (total time) | Noise dominated (detector-on time) | Marked lightcurve |
|---|---|---|---|---|---|---|---|
| A | 3979 | 2781 | 0 | 0 | 0.00% | 0.00% | 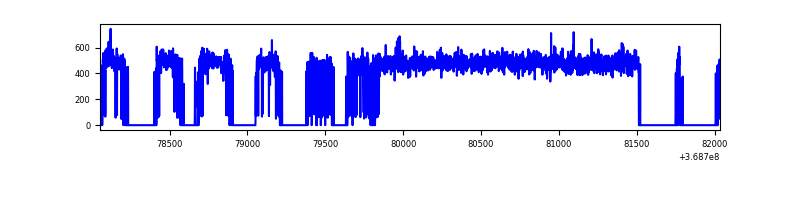 |
| B | 3970 | 2709 | 2 | 2 | 0.05% | 0.07% | 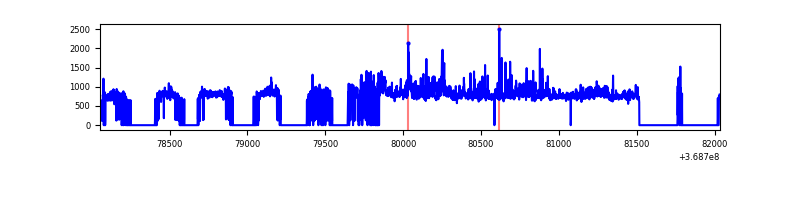 |
| C | 3975 | 2683 | 804 | 804 | 20.23% | 29.97% | 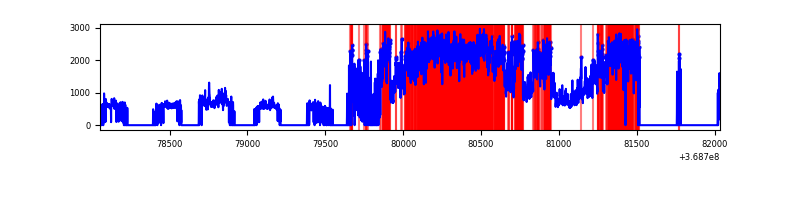 |
| D | 3982 | 2802 | 309 | 309 | 7.76% | 11.03% | 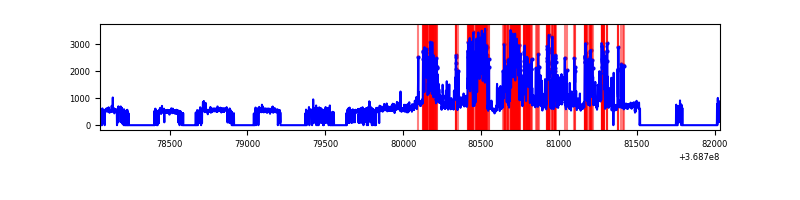 |
Top three noisy pixels from each quadrant. If the there are fewer than three noisy pixels in the level2.evt file, extra rows are filled as -1
| Pixel properties | Quadrant properties | ||||||
|---|---|---|---|---|---|---|---|
| Quadrant | DetID | PixID | Counts | Sigma | Mean | Median | Sigma |
| A | 12 | 189 | 9608 | 139.1 | 325 | 319 | 66.8 |
| A | 13 | 254 | 4229 | 58.55 | 325 | 319 | 66.8 |
| A | 3 | 137 | 3176 | 42.78 | 325 | 319 | 66.8 |
| B | 6 | 159 | 654268 | 10859.35 | 309 | 302 | 60.2 |
| B | 10 | 245 | 176838 | 2931.45 | 309 | 302 | 60.2 |
| B | 0 | 229 | 50315 | 830.48 | 309 | 302 | 60.2 |
| C | 3 | 233 | 2587095 | 39846.84 | 273 | 275 | 64.9 |
| C | 14 | 238 | 43972 | 673.1 | 273 | 275 | 64.9 |
| C | 0 | 10 | 12239 | 184.29 | 273 | 275 | 64.9 |
| D | 12 | 233 | 1012554 | 13940.22 | 303 | 295 | 72.6 |
| D | 8 | 195 | 410498 | 5649.07 | 303 | 295 | 72.6 |
| D | 2 | 234 | 12202 | 163.98 | 303 | 295 | 72.6 |
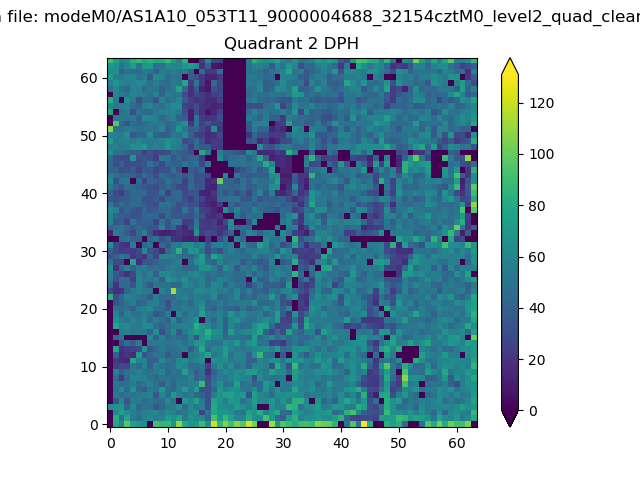
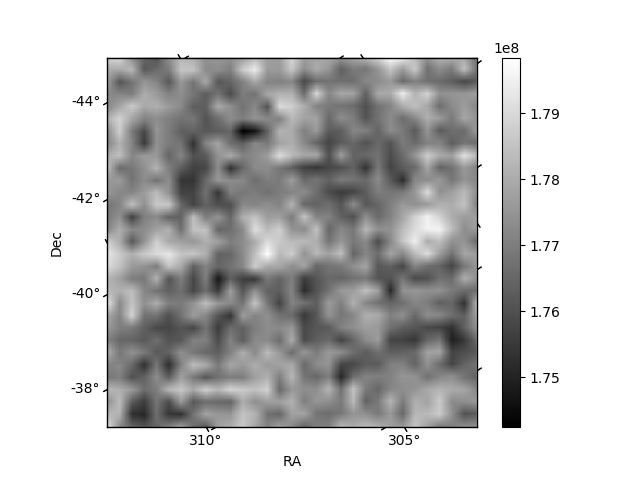
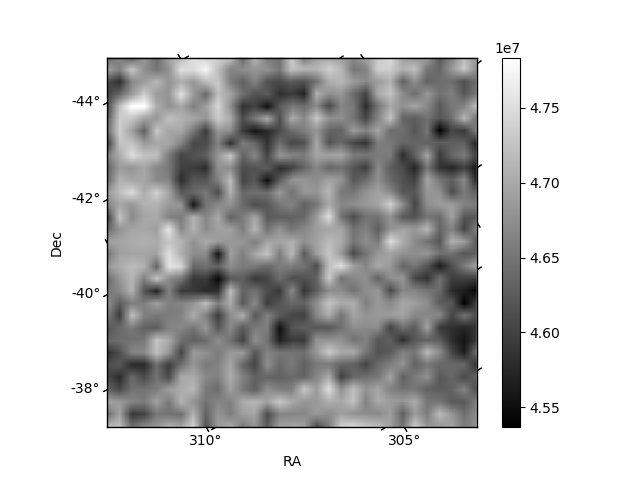
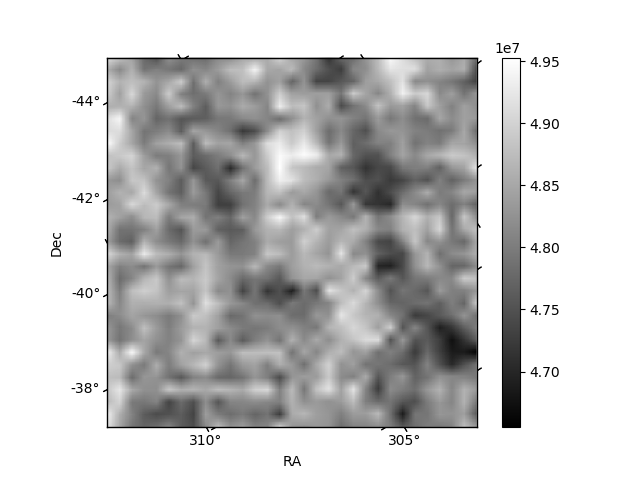
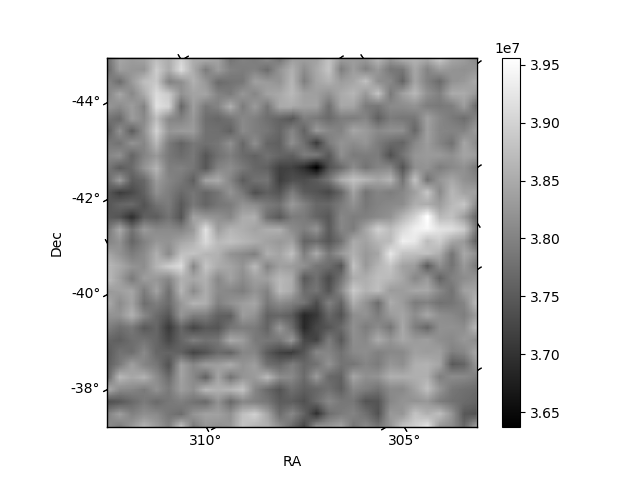
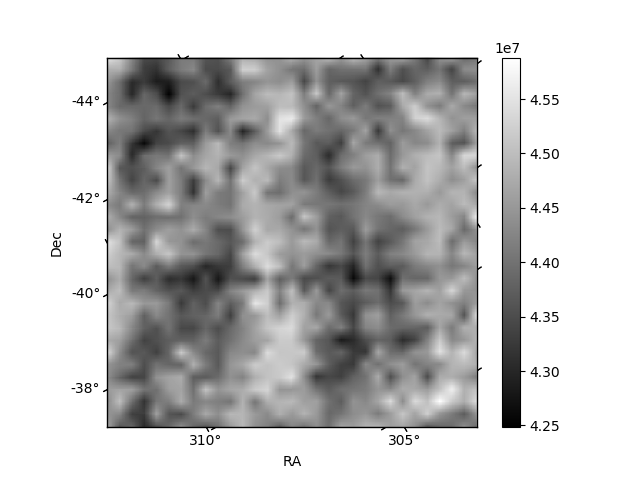
Histogram calculated using DETX and DETY for each event in the final _common_clean file
| Quadrant A | 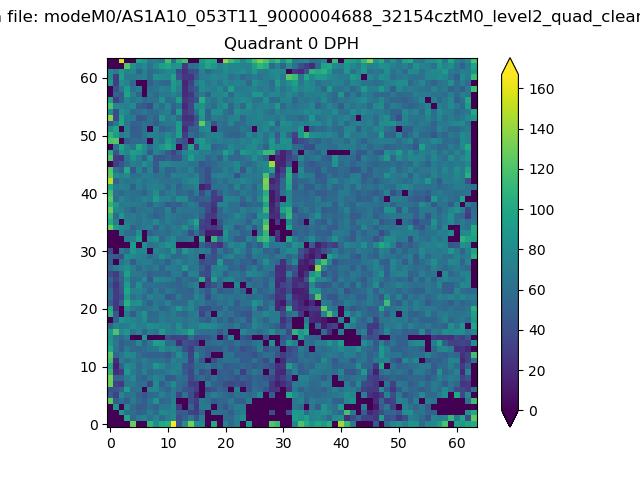 |
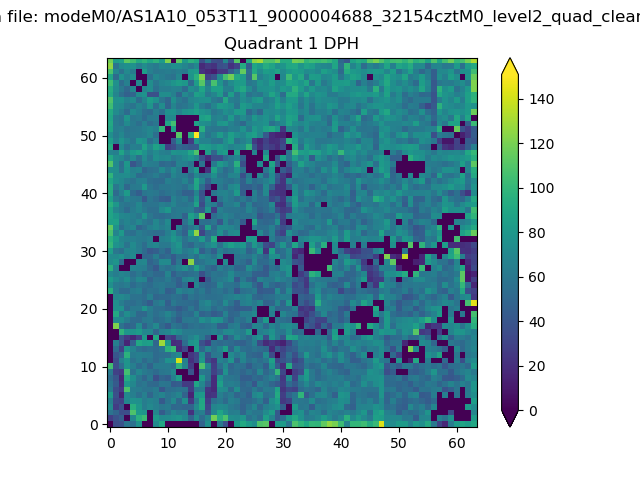 |
Quadrant B |
|---|---|---|---|
| Quadrant D | 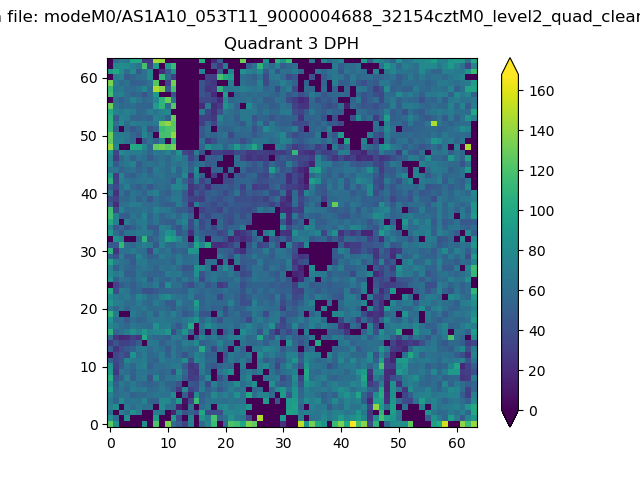 |
 |
Quadrant C |
| Plot type | Count rate plots | Images |
|---|---|---|
| Comparison with Poisson distribution Blue bars denote a histogram of data divided into 1 sec bins. Red curve is a Poisson curve with rate = median count rate of data. |
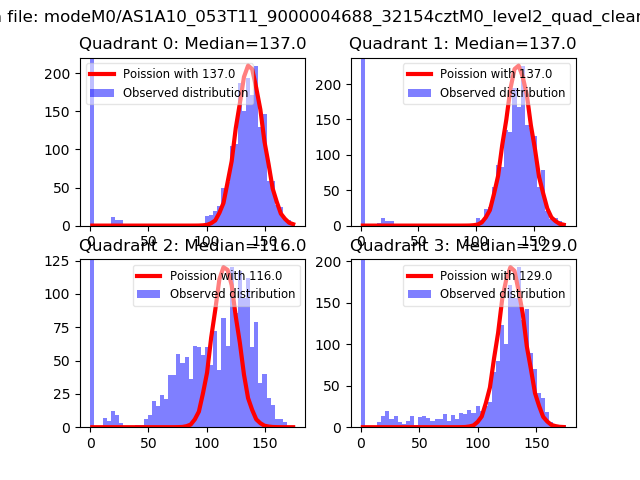 |
 |
| Quadrant-wise count rates Data is divided into 100 sec bins |
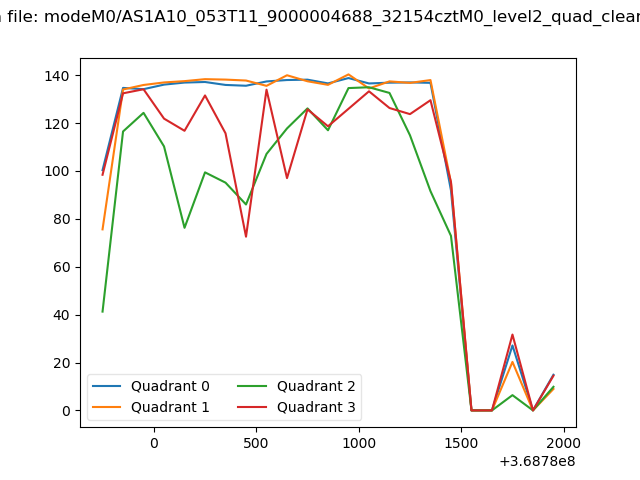 |
|
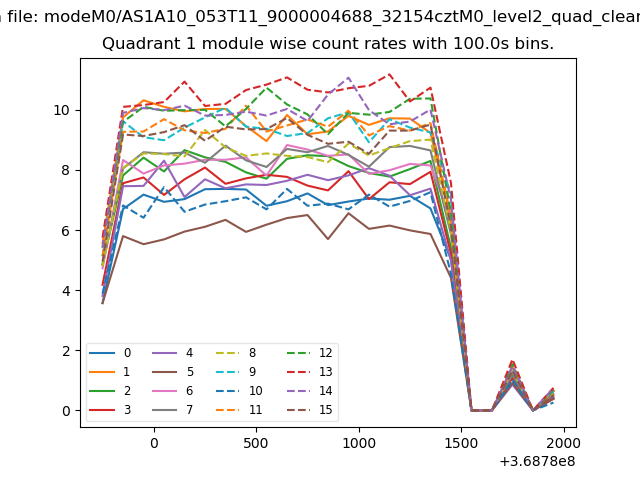
| Module-wise count rates for Quadrant A Data is divided into 100 sec bins |
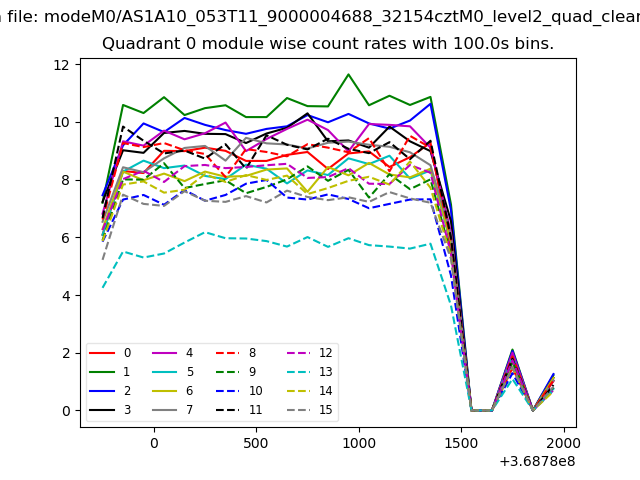 |
 |
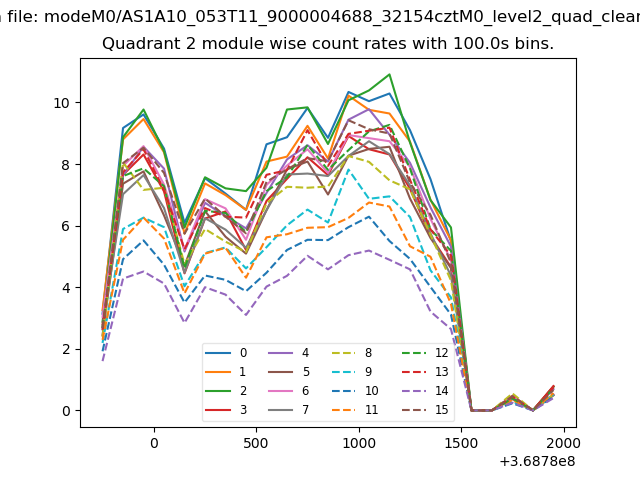
| Module-wise count rates for Quadrant B Data is divided into 100 sec bins |
 |
 |
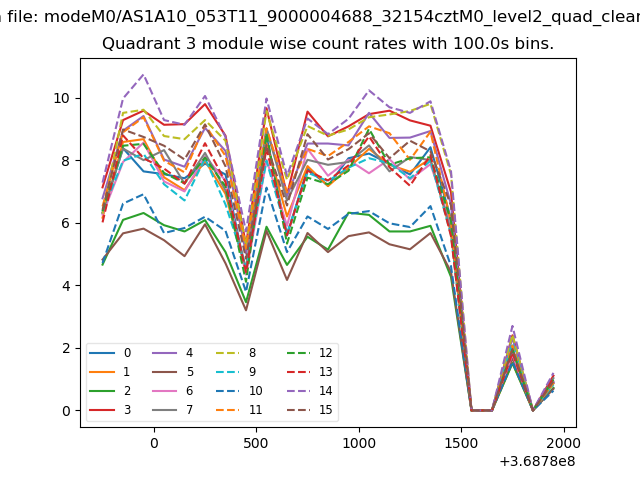
| Module-wise count rates for Quadrant C Data is divided into 100 sec bins |
 |
 |
| Module-wise count rates for Quadrant D Data is divided into 100 sec bins |
 |
 |
| Parameter | Plot |
|---|---|
| CZT HV Monitor | 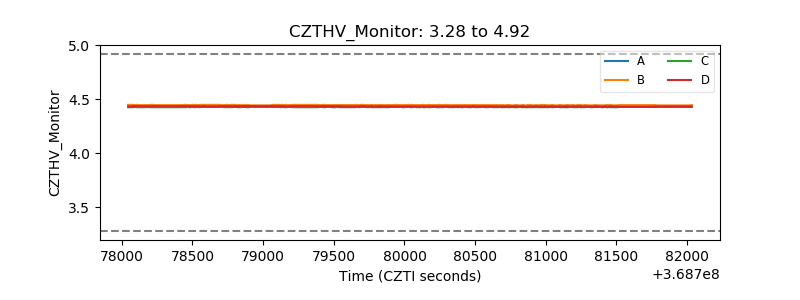 |
| D_VDD | 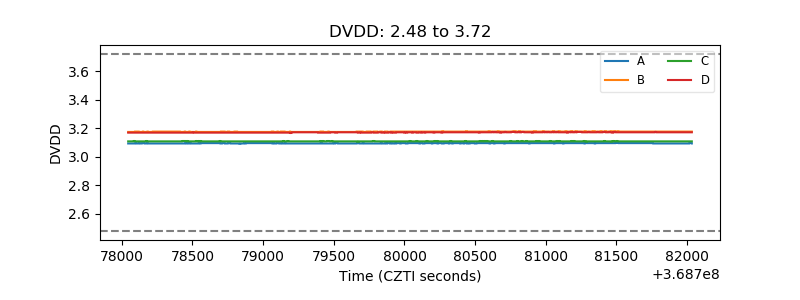 |
| Temperature 1 | 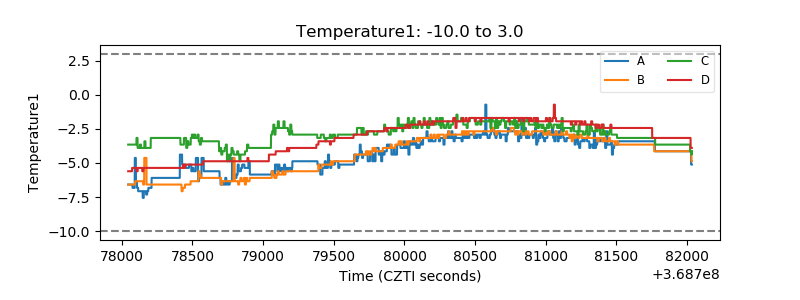 |
| Veto HV Monitor | 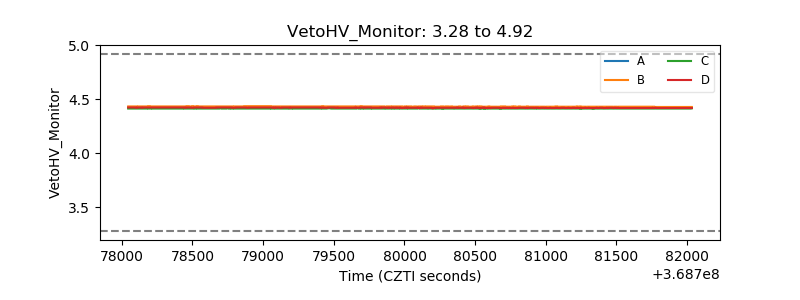 |
| Veto LLD | 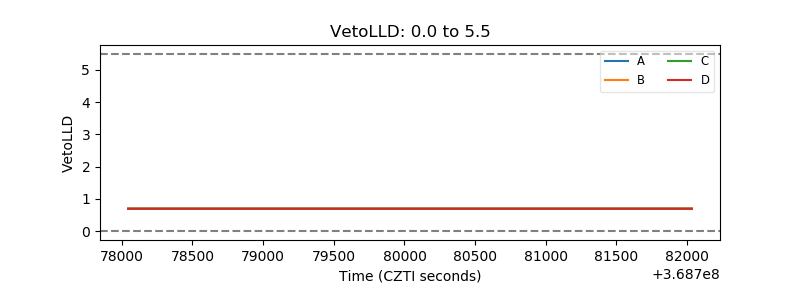 |
| Alpha Counter | 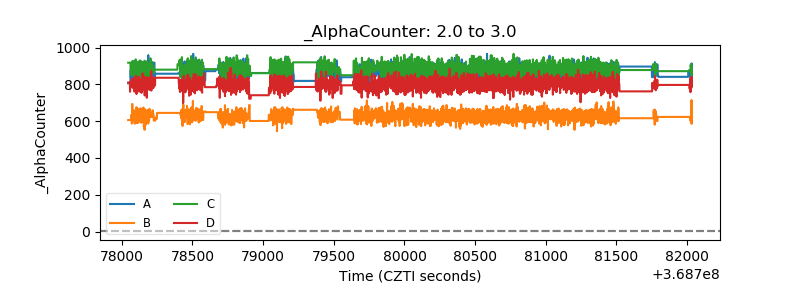 |
| _CPM_Rate | 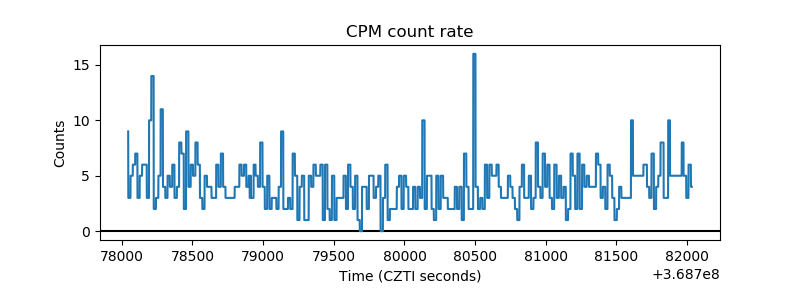 |
| CZT Counter | 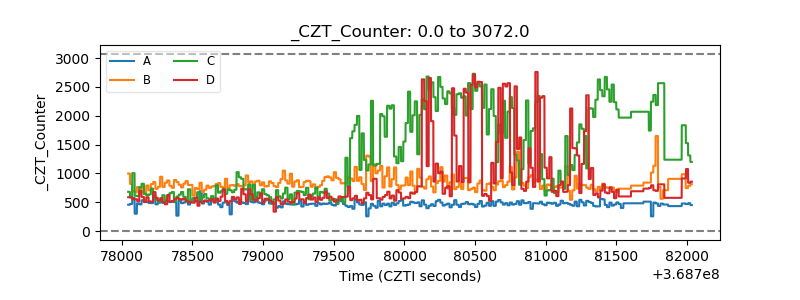 |
| +2.5 Volts monitor |  |
| +5 Volts monitor |  |
| _ROLL_ROT | 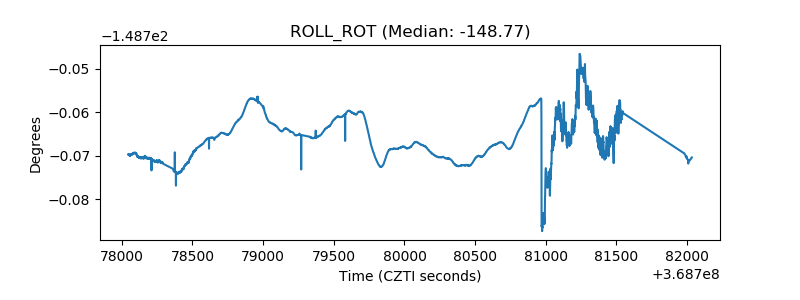 |
| _Roll_DEC | 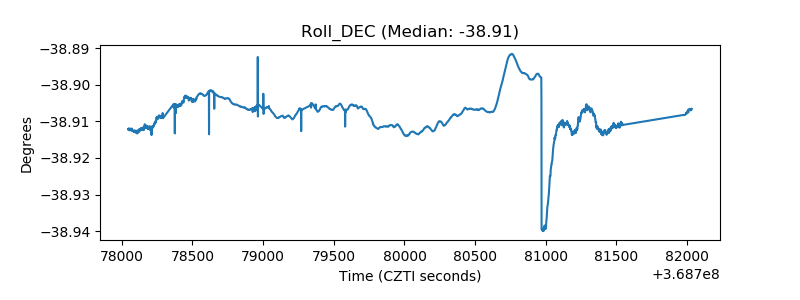 |
| _Roll_RA | 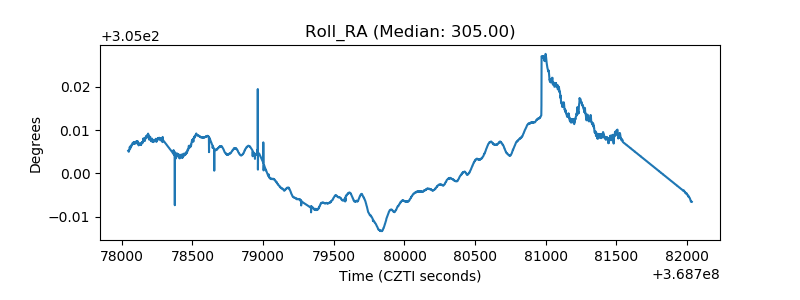 |
| Veto Counter | 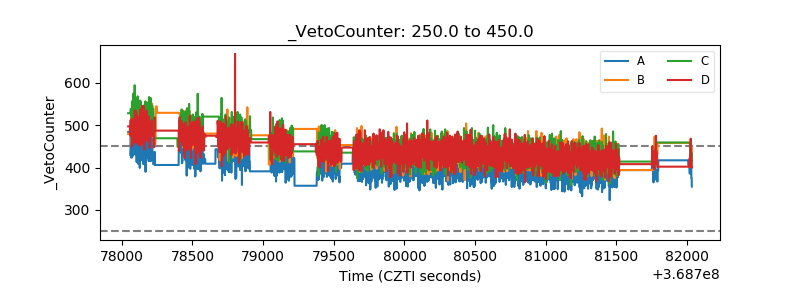 |