| Param | Original file | Final file |
|---|---|---|
| Filename | modeM0/AS1A09_131T01_9000004690cztM0_level2.fits | modeM0/AS1A09_131T01_9000004690cztM0_level2_quad_clean.evt |
| Size (bytes) | 2,012,253,120 | 2,218,472,640 |
| Size | 1.9 GB | 2.1 GB |
| Events in quadrant A | 12,601,532 | 13,924,107 |
| Events in quadrant B | 11,689,714 | 13,668,644 |
| Events in quadrant C | 11,942,360 | 13,180,898 |
| Events in quadrant D | 10,511,676 | 12,233,630 |
| Mode SS | |||
|---|---|---|---|
| Quadrant | BADHDUFLAG | Total packets | Discarded packets |
| A | 0 | 4215 | 0 |
| B | 0 | 4206 | 0 |
| C | 0 | 4221 | 0 |
| D | 0 | 4212 | 0 |
| Mode M0 | |||
|---|---|---|---|
| Quadrant | BADHDUFLAG | Total packets | Discarded packets |
| A | 0 | 432064 | 0 |
| B | 0 | 662801 | 0 |
| C | 0 | 483387 | 0 |
| D | 0 | 595232 | 0 |
| Mode M9 | |||
|---|---|---|---|
| Quadrant | BADHDUFLAG | Total packets | Discarded packets |
| A | 0 | 302 | 0 |
| B | 0 | 302 | 0 |
| C | 0 | 302 | 0 |
| D | 0 | 303 | 0 |
| Quadrant | Total seconds | Saturated seconds | Saturation percentage |
|---|---|---|---|
| A | 207288 | 2365 | 1.140925% |
| B | 206656 | 8737 | 4.227799% |
| C | 207166 | 15161 | 7.318286% |
| D | 207055 | 9318 | 4.500254% |
Noise dominated data is calculated using 1-second bins in cleaned event files. If a bin has >2000 counts, and if more than 50% of those come from <1% of pixels, then it is considered to be noise-dominated and hence unusable.
| Quadrant | # 1 sec bins | Bins with >0 counts | Bins with >2000 counts | High rate bins dominated by noise | Noise dominated (total time) | Noise dominated (detector-on time) | Marked lightcurve |
|---|---|---|---|---|---|---|---|
| A | 285083 | 208222 | 0 | 0 | 0.00% | 0.00% |  |
| B | 285083 | 207524 | 0 | 0 | 0.00% | 0.00% |  |
| C | 285083 | 207564 | 0 | 0 | 0.00% | 0.00% |  |
| D | 285083 | 207800 | 0 | 0 | 0.00% | 0.00% | 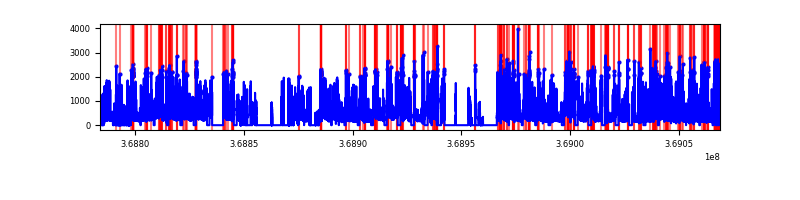 |
Top three noisy pixels from each quadrant. If the there are fewer than three noisy pixels in the level2.evt file, extra rows are filled as -1
| Pixel properties | Quadrant properties | ||||||
|---|---|---|---|---|---|---|---|
| Quadrant | DetID | PixID | Counts | Sigma | Mean | Median | Sigma |
| A | 0 | 29 | 12293 | 11.38 | 3287 | 3094 | 808.1 |
| A | 7 | 110 | 10136 | 8.71 | 3287 | 3094 | 808.1 |
| A | 0 | 30 | 9584 | 8.03 | 3287 | 3094 | 808.1 |
| B | 2 | 9 | 9568 | 11.05 | 3099 | 2968 | 597.4 |
| B | 3 | 80 | 7930 | 8.31 | 3099 | 2968 | 597.4 |
| B | 2 | 8 | 7912 | 8.28 | 3099 | 2968 | 597.4 |
| C | 1 | 81 | 9474 | 8.18 | 3160 | 2974 | 794.3 |
| C | 1 | 80 | 9316 | 7.98 | 3160 | 2974 | 794.3 |
| C | 12 | 241 | 8395 | 6.83 | 3160 | 2974 | 794.3 |
| D | 3 | 14 | 7720 | 6.26 | 3003 | 2735 | 796.0 |
| D | 10 | 189 | 7549 | 6.05 | 3003 | 2735 | 796.0 |
| D | 6 | 67 | 7313 | 5.75 | 3003 | 2735 | 796.0 |
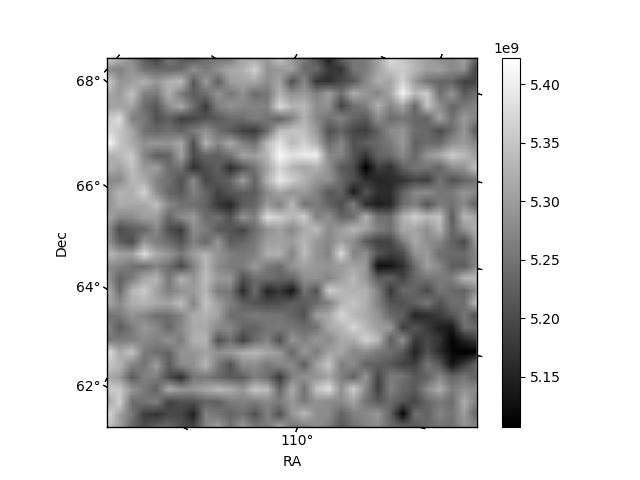
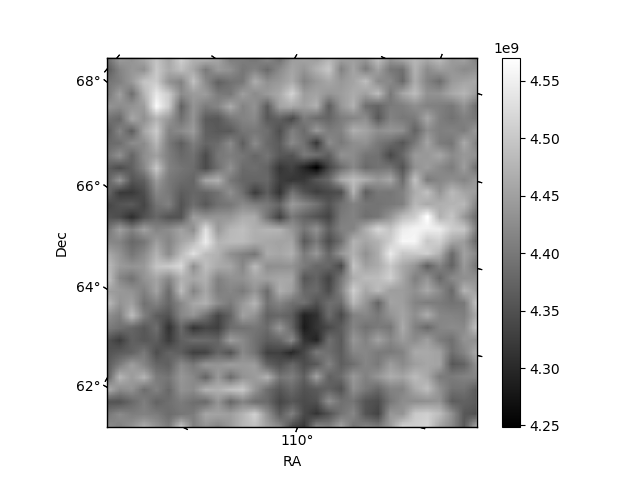
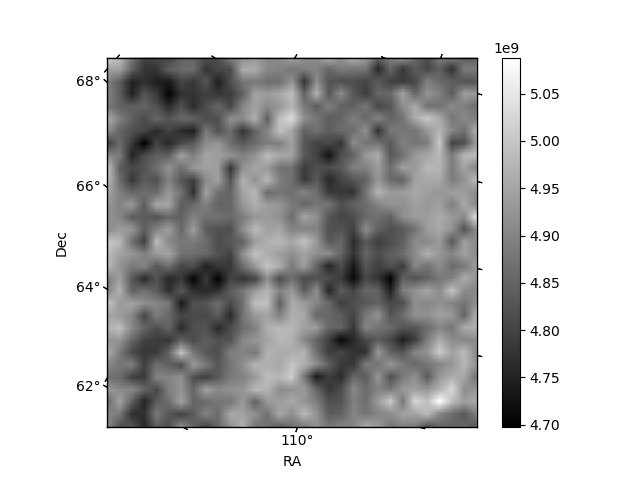
Histogram calculated using DETX and DETY for each event in the final _common_clean file
| Quadrant A |  |
 |
Quadrant B |
|---|---|---|---|
| Quadrant D | 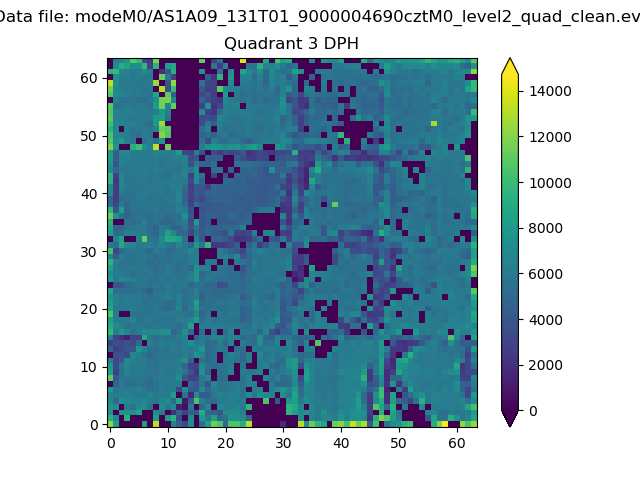 |
 |
Quadrant C |
| Plot type | Count rate plots | Images |
|---|---|---|
| Comparison with Poisson distribution Blue bars denote a histogram of data divided into 1 sec bins. Red curve is a Poisson curve with rate = median count rate of data. |
 |
 |
| Quadrant-wise count rates Data is divided into 100 sec bins |
 |
|
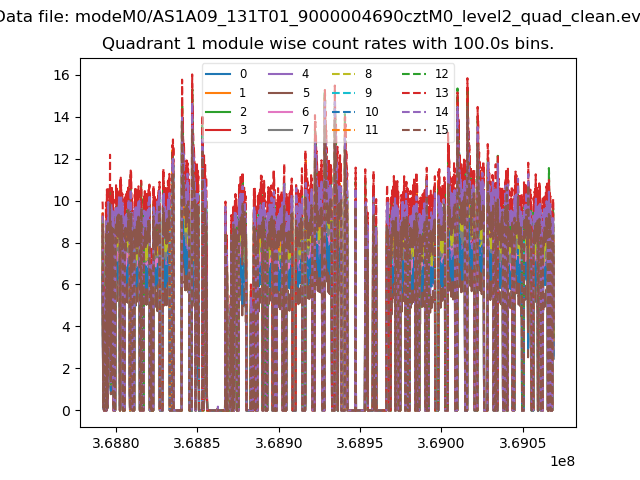
| Module-wise count rates for Quadrant A Data is divided into 100 sec bins |
 |
 |
| Module-wise count rates for Quadrant B Data is divided into 100 sec bins |
 |
 |
| Module-wise count rates for Quadrant C Data is divided into 100 sec bins |
 |
 |
| Module-wise count rates for Quadrant D Data is divided into 100 sec bins |
 |
 |
| Parameter | Plot |
|---|---|
| CZT HV Monitor |  |
| D_VDD |  |
| Temperature 1 | 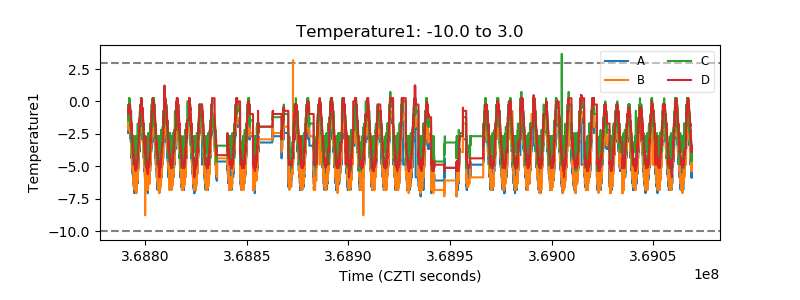 |
| Veto HV Monitor |  |
| Veto LLD |  |
| Alpha Counter |  |
| _CPM_Rate |  |
| CZT Counter |  |
| +2.5 Volts monitor | 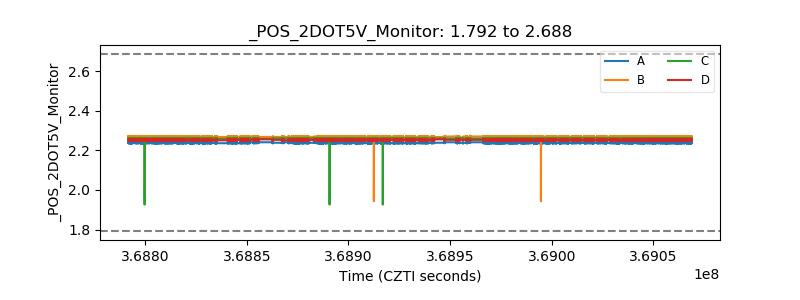 |
| +5 Volts monitor |  |
| _ROLL_ROT |  |
| _Roll_DEC |  |
| _Roll_RA |  |
| Veto Counter | 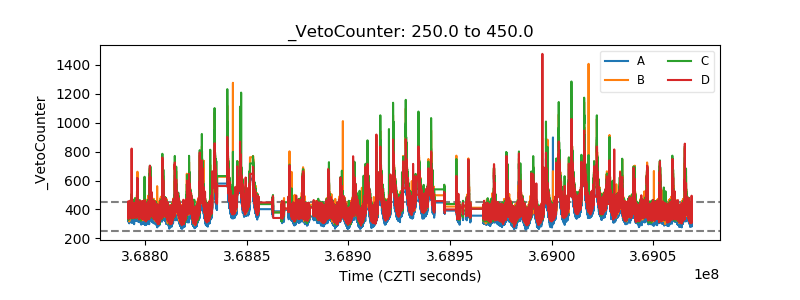 |