| Param | Original file | Final file |
|---|---|---|
| Filename | modeM0/AS1A09_131T01_9000004690_32155cztM0_level2.evt | modeM0/AS1A09_131T01_9000004690_32155cztM0_level2_quad_clean.evt |
| Size (bytes) | 603,613,440 | 119,770,560 |
| Size | 575.7 MB | 114.2 MB |
| Events in quadrant A | 3,528,807 | 790,948 |
| Events in quadrant B | 6,054,243 | 784,958 |
| Events in quadrant C | 3,791,193 | 776,209 |
| Events in quadrant D | 4,407,403 | 762,625 |
| Mode SS | |||
|---|---|---|---|
| Quadrant | BADHDUFLAG | Total packets | Discarded packets |
| A | 0 | 150 | 0 |
| B | 0 | 150 | 0 |
| C | 0 | 150 | 0 |
| D | 0 | 150 | 0 |
| Mode M0 | |||
|---|---|---|---|
| Quadrant | BADHDUFLAG | Total packets | Discarded packets |
| A | 0 | 15168 | 2 |
| B | 0 | 23600 | 1 |
| C | 0 | 15761 | 1 |
| D | 0 | 17623 | 1 |
| Mode M9 | |||
|---|---|---|---|
| Quadrant | BADHDUFLAG | Total packets | Discarded packets |
| A | 0 | 2 | 0 |
| B | 0 | 2 | 0 |
| C | 0 | 2 | 0 |
| D | 0 | 2 | 0 |
| Quadrant | Total seconds | Saturated seconds | Saturation percentage |
|---|---|---|---|
| A | 7363 | 79 | 1.072932% |
| B | 7363 | 317 | 4.305310% |
| C | 7363 | 168 | 2.281679% |
| D | 7363 | 188 | 2.553307% |
Noise dominated data is calculated using 1-second bins in cleaned event files. If a bin has >2000 counts, and if more than 50% of those come from <1% of pixels, then it is considered to be noise-dominated and hence unusable.
| Quadrant | # 1 sec bins | Bins with >0 counts | Bins with >2000 counts | High rate bins dominated by noise | Noise dominated (total time) | Noise dominated (detector-on time) | Marked lightcurve |
|---|---|---|---|---|---|---|---|
| A | 7598 | 7364 | 0 | 0 | 0.00% | 0.00% | 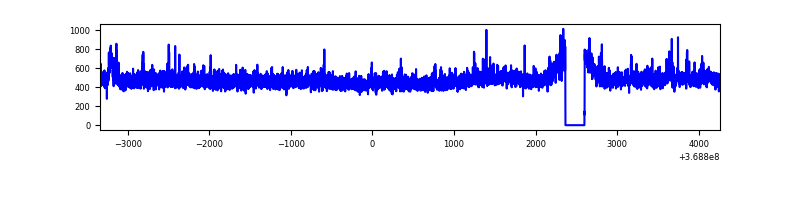 |
| B | 7598 | 7364 | 109 | 109 | 1.43% | 1.48% | 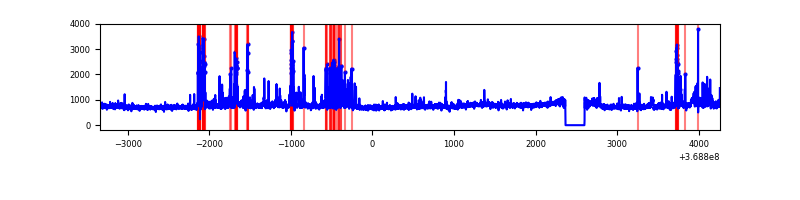 |
| C | 7598 | 7364 | 4 | 4 | 0.05% | 0.05% | 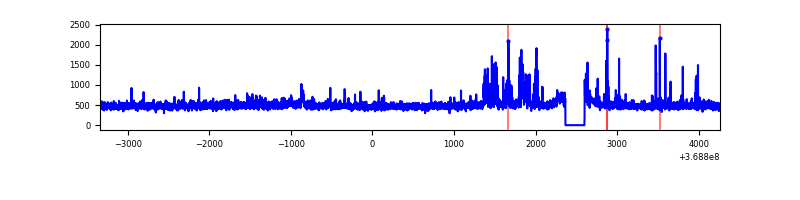 |
| D | 7598 | 7364 | 111 | 111 | 1.46% | 1.51% | 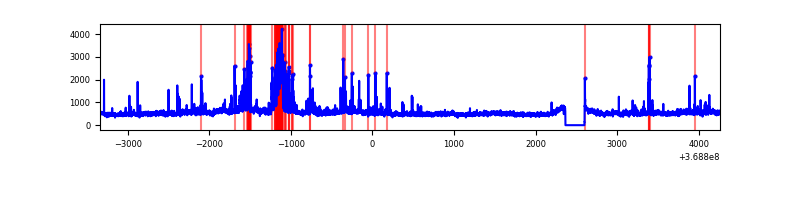 |
Top three noisy pixels from each quadrant. If the there are fewer than three noisy pixels in the level2.evt file, extra rows are filled as -1
| Pixel properties | Quadrant properties | ||||||
|---|---|---|---|---|---|---|---|
| Quadrant | DetID | PixID | Counts | Sigma | Mean | Median | Sigma |
| A | 12 | 189 | 83177 | 467.39 | 886 | 866 | 176.1 |
| A | 13 | 6 | 19286 | 104.6 | 886 | 866 | 176.1 |
| A | 13 | 254 | 12558 | 66.39 | 886 | 866 | 176.1 |
| B | 6 | 159 | 1981653 | 11954.1 | 863 | 840 | 165.7 |
| B | 5 | 172 | 346795 | 2087.82 | 863 | 840 | 165.7 |
| B | 0 | 190 | 257870 | 1551.16 | 863 | 840 | 165.7 |
| C | 0 | 10 | 215381 | 1087.4 | 845 | 850 | 197.3 |
| C | 14 | 238 | 146562 | 738.58 | 845 | 850 | 197.3 |
| C | 3 | 233 | 74669 | 374.17 | 845 | 850 | 197.3 |
| D | 8 | 195 | 600566 | 2978.79 | 853 | 829 | 201.3 |
| D | 12 | 233 | 512712 | 2542.43 | 853 | 829 | 201.3 |
| D | 2 | 234 | 38629 | 187.74 | 853 | 829 | 201.3 |
Histogram calculated using DETX and DETY for each event in the final _common_clean file
| Quadrant A | 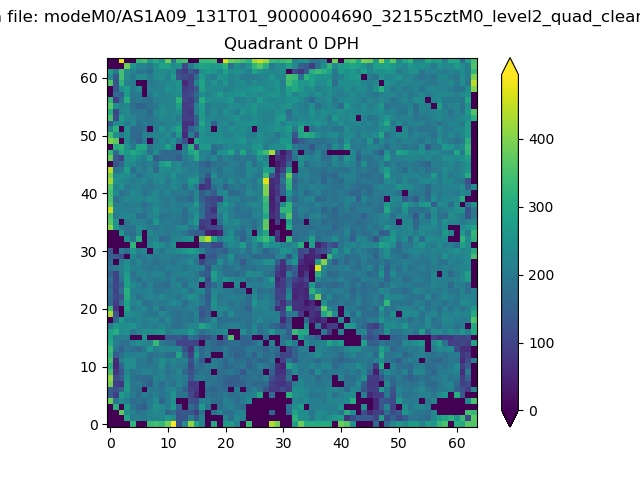 |
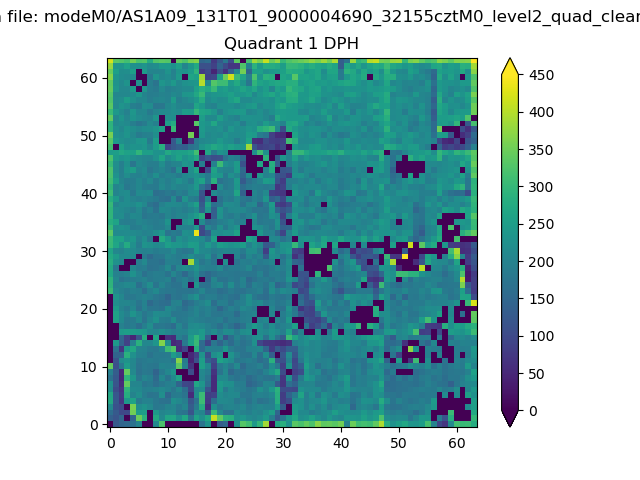 |
Quadrant B |
|---|---|---|---|
| Quadrant D | 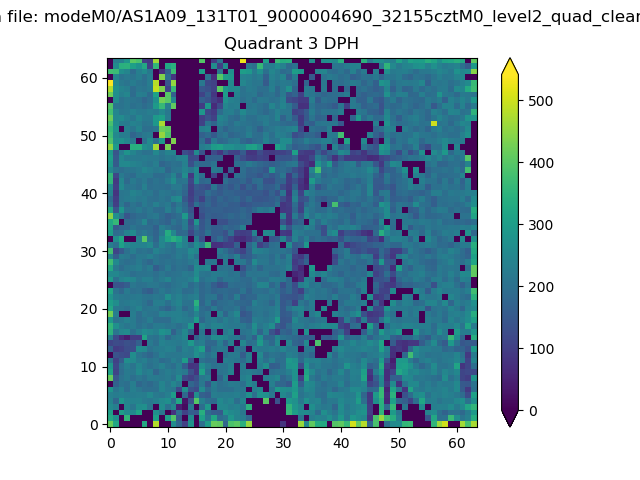 |
 |
Quadrant C |
| Plot type | Count rate plots | Images |
|---|---|---|
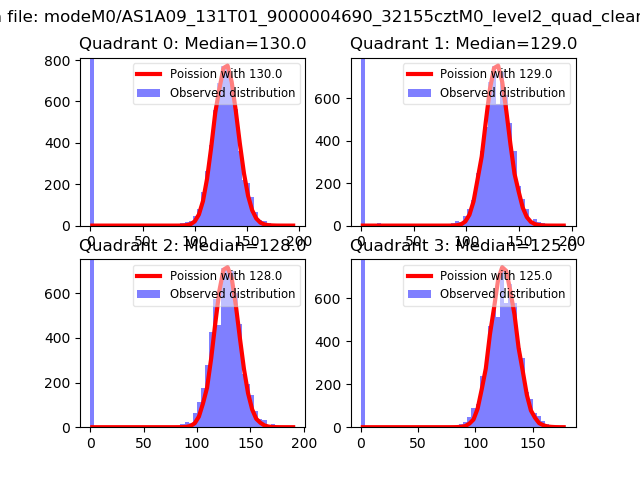
| Comparison with Poisson distribution Blue bars denote a histogram of data divided into 1 sec bins. Red curve is a Poisson curve with rate = median count rate of data. |
 |
 |
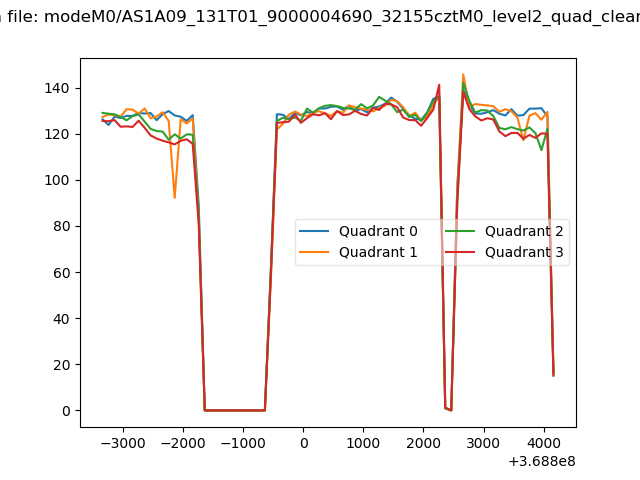
| Quadrant-wise count rates Data is divided into 100 sec bins |
 |
|
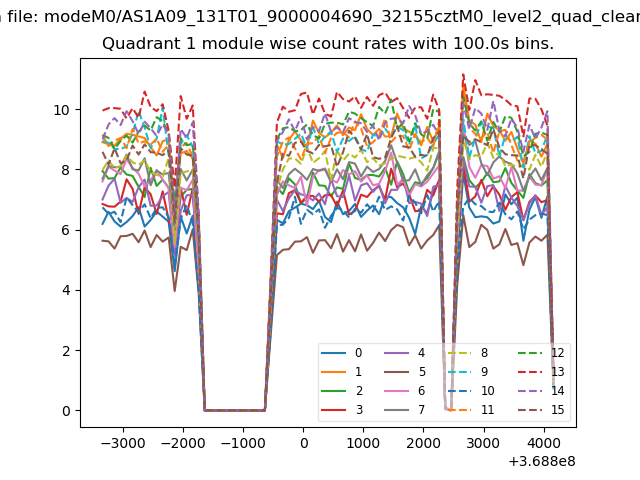
| Module-wise count rates for Quadrant A Data is divided into 100 sec bins |
 |
 |
| Module-wise count rates for Quadrant B Data is divided into 100 sec bins |
 |
 |
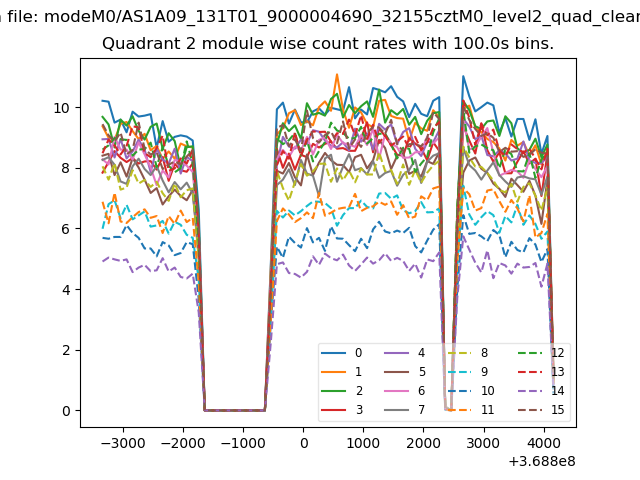
| Module-wise count rates for Quadrant C Data is divided into 100 sec bins |
 |
 |
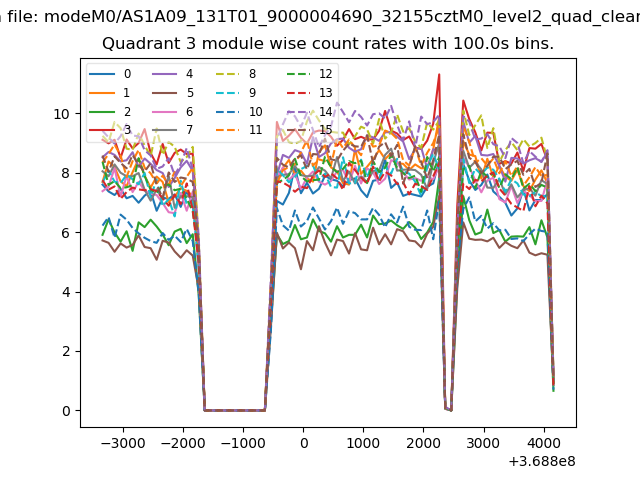
| Module-wise count rates for Quadrant D Data is divided into 100 sec bins |
 |
 |
| Parameter | Plot |
|---|---|
| CZT HV Monitor | 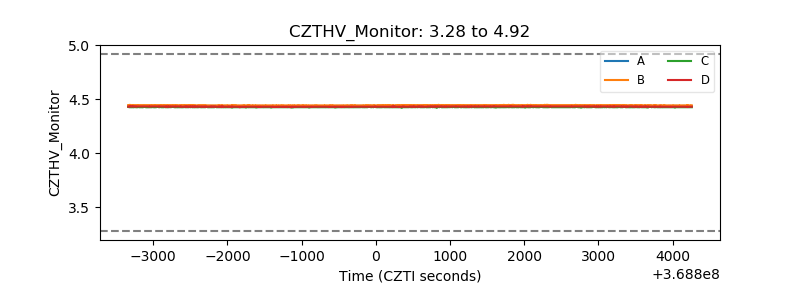 |
| D_VDD | 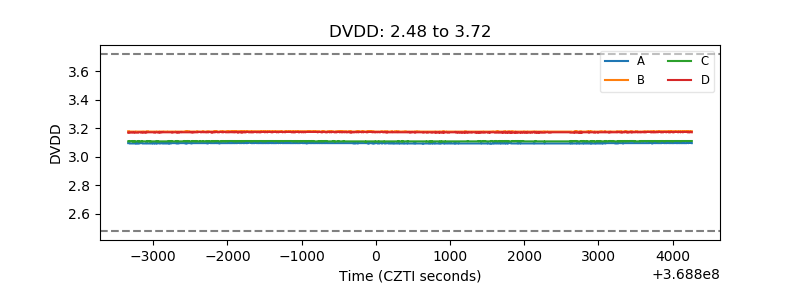 |
| Temperature 1 | 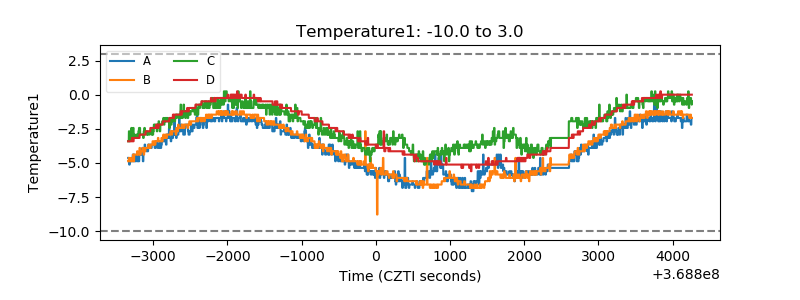 |
| Veto HV Monitor | 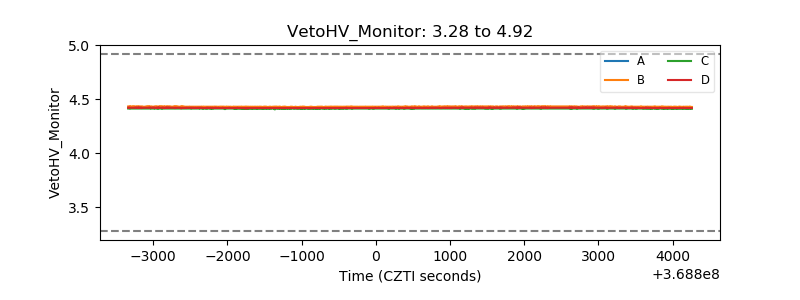 |
| Veto LLD | 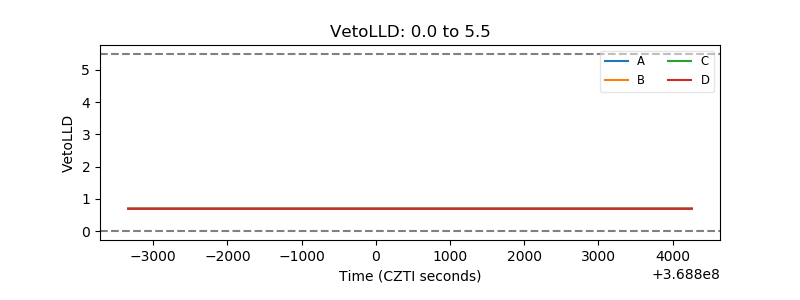 |
| Alpha Counter | 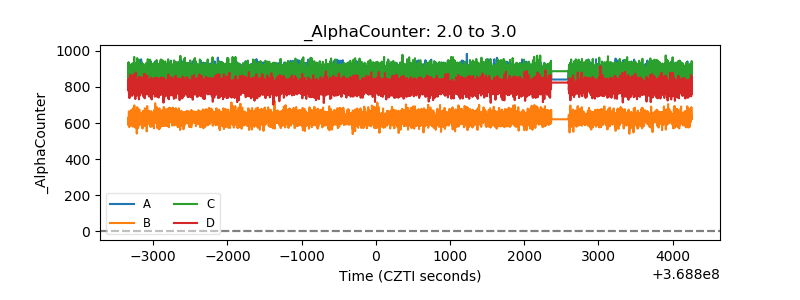 |
| _CPM_Rate | 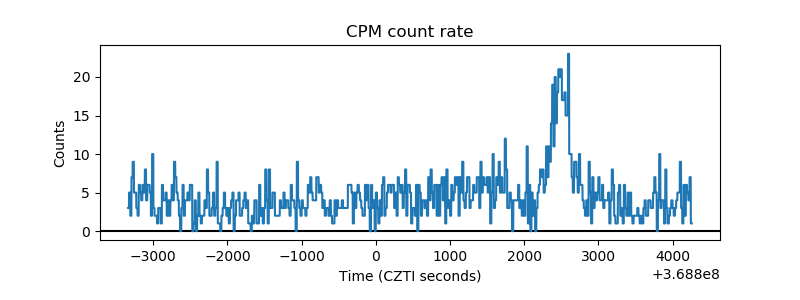 |
| CZT Counter | 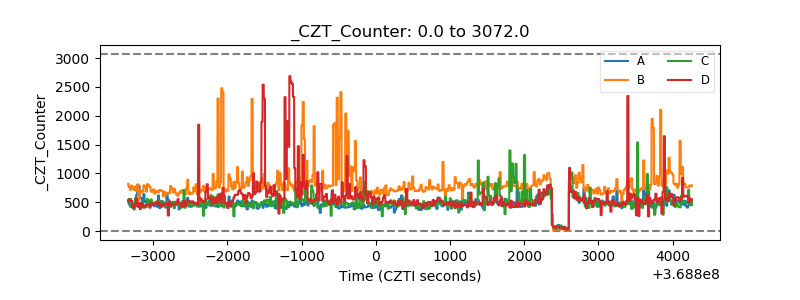 |
| +2.5 Volts monitor |  |
| +5 Volts monitor |  |
| _ROLL_ROT | 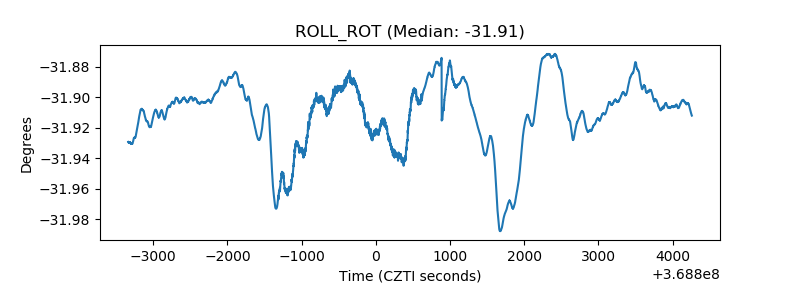 |
| _Roll_DEC | 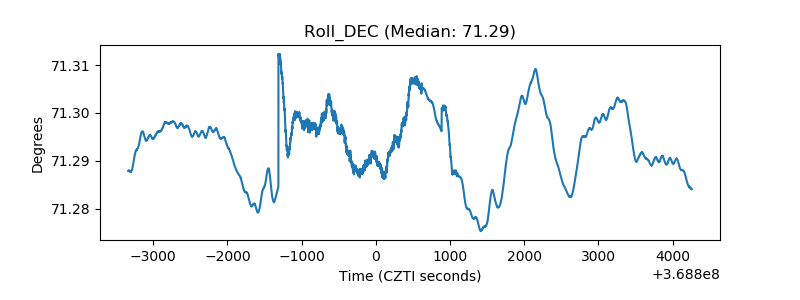 |
| _Roll_RA |  |
| Veto Counter | 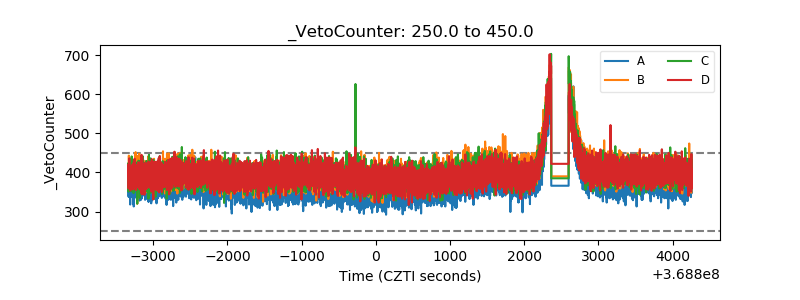 |