| Param | Original file | Final file |
|---|---|---|
| Filename | modeM0/AS1A09_131T01_9000004690_32157cztM0_level2.evt | modeM0/AS1A09_131T01_9000004690_32157cztM0_level2_quad_clean.evt |
| Size (bytes) | 1,149,526,080 | 183,669,120 |
| Size | 1.1 GB | 175.2 MB |
| Events in quadrant A | 6,078,443 | 1,201,944 |
| Events in quadrant B | 10,811,546 | 1,183,134 |
| Events in quadrant C | 6,304,783 | 1,181,356 |
| Events in quadrant D | 10,761,397 | 1,116,748 |
| Mode SS | |||
|---|---|---|---|
| Quadrant | BADHDUFLAG | Total packets | Discarded packets |
| A | 0 | 258 | 0 |
| B | 0 | 258 | 0 |
| C | 0 | 258 | 0 |
| D | 0 | 258 | 0 |
| Mode M0 | |||
|---|---|---|---|
| Quadrant | BADHDUFLAG | Total packets | Discarded packets |
| A | 0 | 26163 | 2 |
| B | 0 | 41428 | 4 |
| C | 0 | 26413 | 2 |
| D | 0 | 40822 | 2 |
| Mode M9 | |||
|---|---|---|---|
| Quadrant | BADHDUFLAG | Total packets | Discarded packets |
| A | 0 | 12 | 0 |
| B | 0 | 12 | 0 |
| C | 0 | 12 | 0 |
| D | 0 | 12 | 0 |
| Quadrant | Total seconds | Saturated seconds | Saturation percentage |
|---|---|---|---|
| A | 12724 | 97 | 0.762339% |
| B | 12723 | 584 | 4.590112% |
| C | 12723 | 275 | 2.161440% |
| D | 12723 | 702 | 5.517567% |
Noise dominated data is calculated using 1-second bins in cleaned event files. If a bin has >2000 counts, and if more than 50% of those come from <1% of pixels, then it is considered to be noise-dominated and hence unusable.
| Quadrant | # 1 sec bins | Bins with >0 counts | Bins with >2000 counts | High rate bins dominated by noise | Noise dominated (total time) | Noise dominated (detector-on time) | Marked lightcurve |
|---|---|---|---|---|---|---|---|
| A | 13884 | 12726 | 7 | 7 | 0.05% | 0.06% | 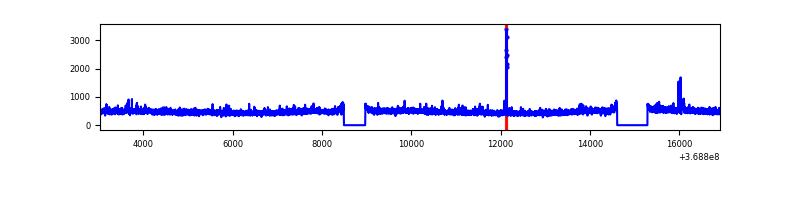 |
| B | 13883 | 12725 | 236 | 236 | 1.70% | 1.85% | 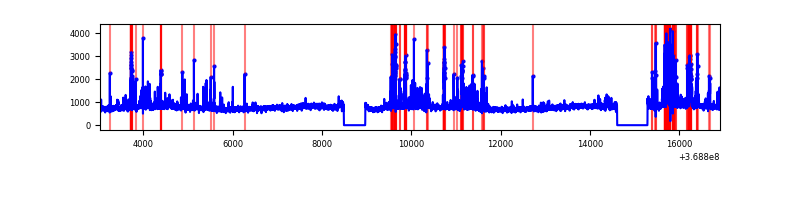 |
| C | 13883 | 12725 | 10 | 10 | 0.07% | 0.08% | 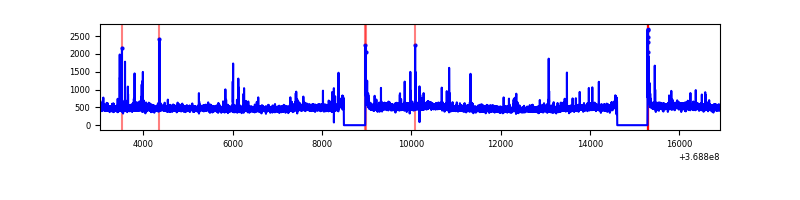 |
| D | 13883 | 12725 | 520 | 520 | 3.75% | 4.09% | 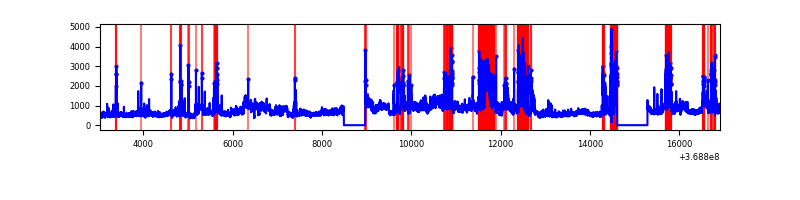 |
Top three noisy pixels from each quadrant. If the there are fewer than three noisy pixels in the level2.evt file, extra rows are filled as -1
| Pixel properties | Quadrant properties | ||||||
|---|---|---|---|---|---|---|---|
| Quadrant | DetID | PixID | Counts | Sigma | Mean | Median | Sigma |
| A | 12 | 189 | 114080 | 368.14 | 1530 | 1495 | 305.8 |
| A | 15 | 174 | 31227 | 97.22 | 1530 | 1495 | 305.8 |
| A | 13 | 6 | 29890 | 92.85 | 1530 | 1495 | 305.8 |
| B | 6 | 159 | 3569881 | 12636.0 | 1491 | 1452 | 282.4 |
| B | 5 | 172 | 866070 | 3061.66 | 1491 | 1452 | 282.4 |
| B | 0 | 190 | 300691 | 1059.62 | 1491 | 1452 | 282.4 |
| C | 14 | 238 | 266367 | 776.96 | 1465 | 1469 | 340.9 |
| C | 0 | 10 | 132263 | 383.63 | 1465 | 1469 | 340.9 |
| C | 3 | 233 | 62019 | 177.6 | 1465 | 1469 | 340.9 |
| D | 8 | 195 | 3434513 | 10113.61 | 1451 | 1410 | 339.5 |
| D | 12 | 233 | 1335121 | 3928.99 | 1451 | 1410 | 339.5 |
| D | 2 | 250 | 377074 | 1106.67 | 1451 | 1410 | 339.5 |
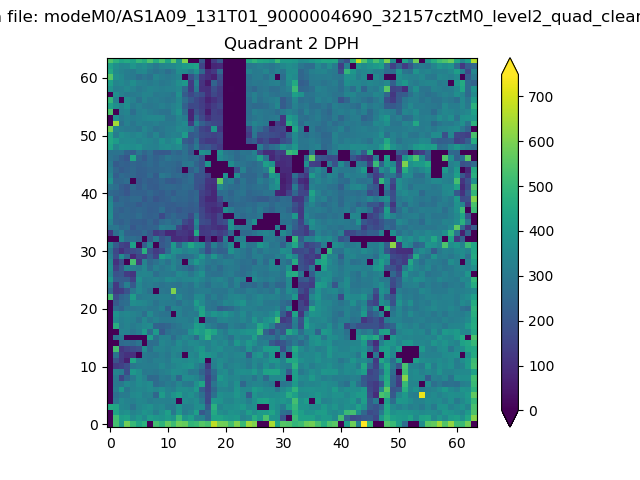
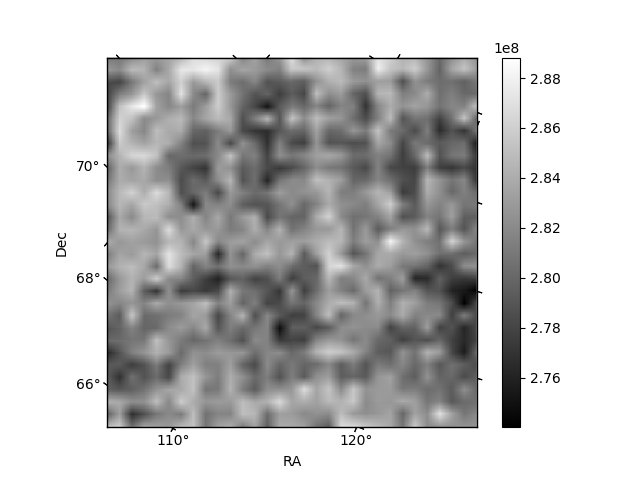
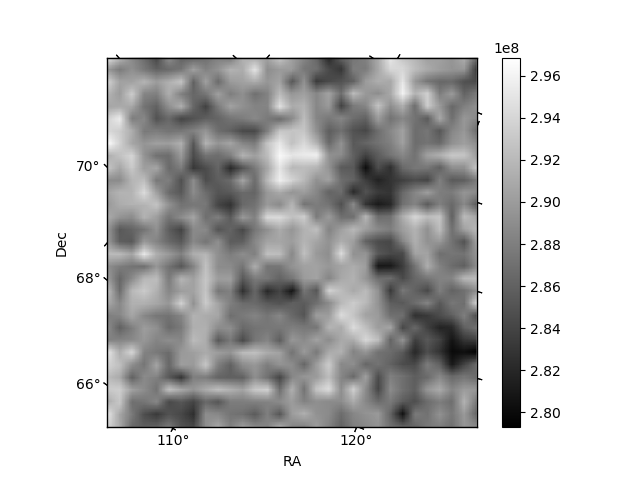
Histogram calculated using DETX and DETY for each event in the final _common_clean file
| Quadrant A | 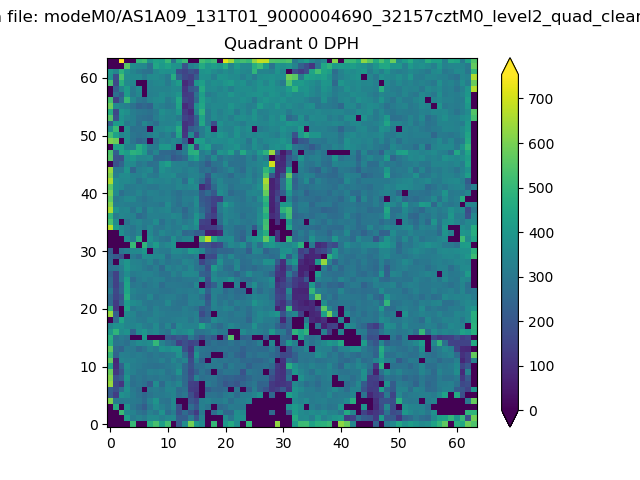 |
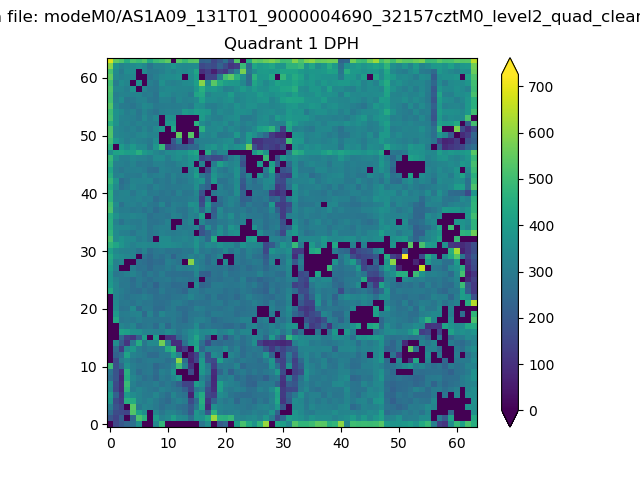 |
Quadrant B |
|---|---|---|---|
| Quadrant D | 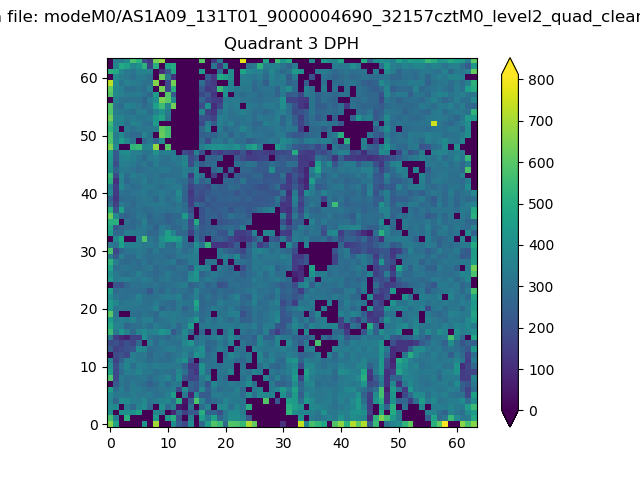 |
 |
Quadrant C |
| Plot type | Count rate plots | Images |
|---|---|---|
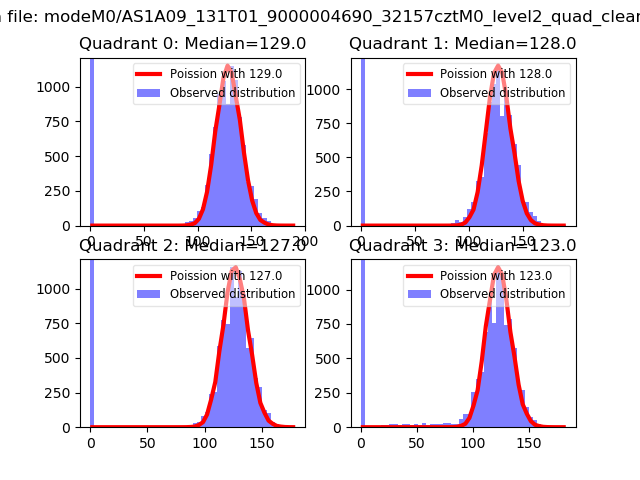
| Comparison with Poisson distribution Blue bars denote a histogram of data divided into 1 sec bins. Red curve is a Poisson curve with rate = median count rate of data. |
 |
 |
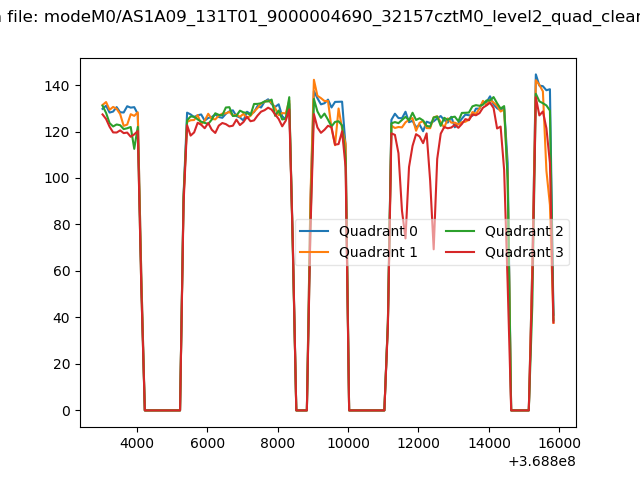
| Quadrant-wise count rates Data is divided into 100 sec bins |
 |
|
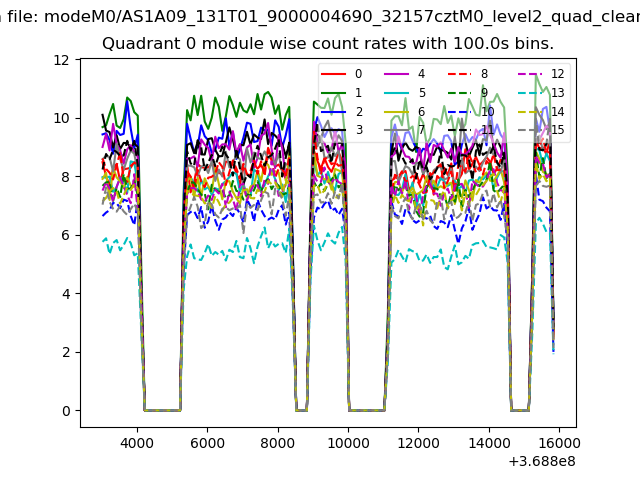
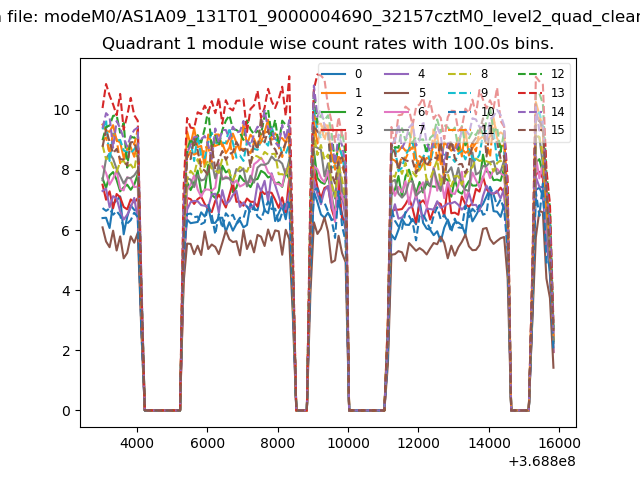
| Module-wise count rates for Quadrant A Data is divided into 100 sec bins |
 |
 |
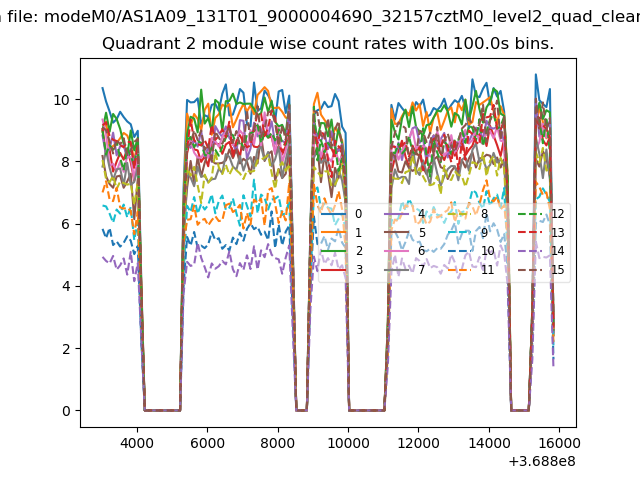
| Module-wise count rates for Quadrant B Data is divided into 100 sec bins |
 |
 |
| Module-wise count rates for Quadrant C Data is divided into 100 sec bins |
 |
 |
| Module-wise count rates for Quadrant D Data is divided into 100 sec bins |
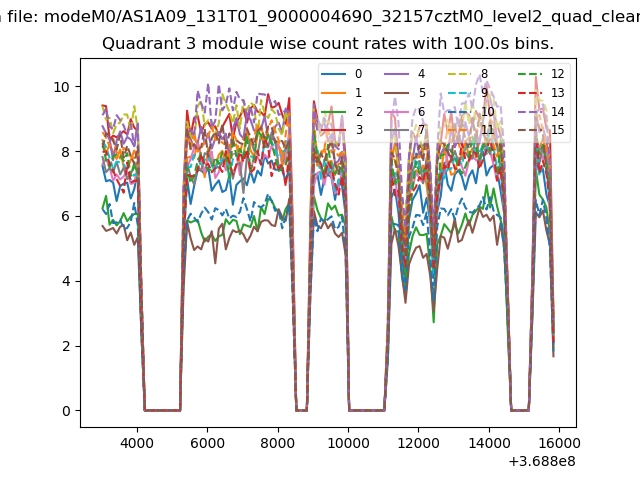 |
 |
| Parameter | Plot |
|---|---|
| CZT HV Monitor | 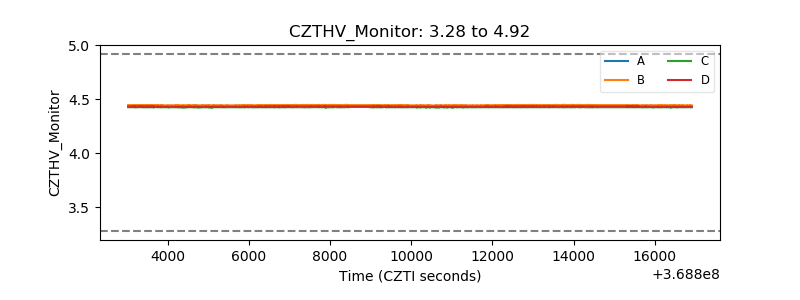 |
| D_VDD | 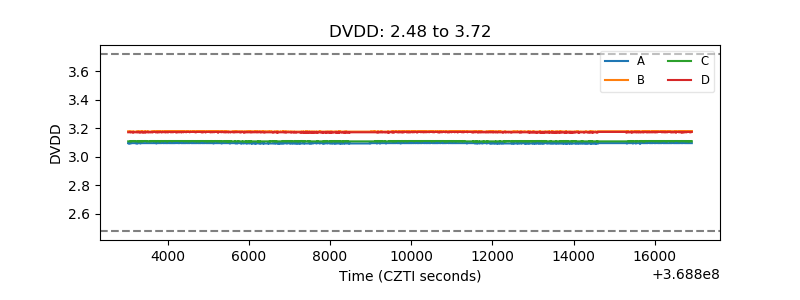 |
| Temperature 1 | 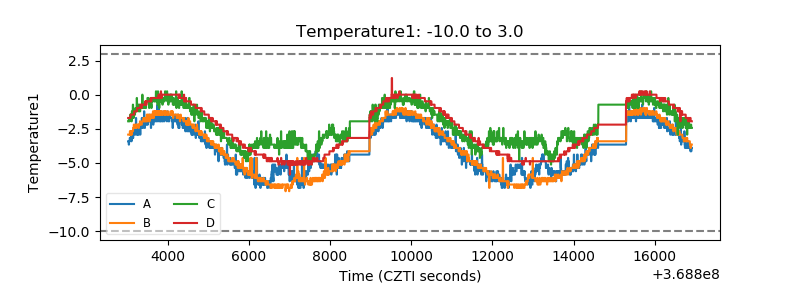 |
| Veto HV Monitor | 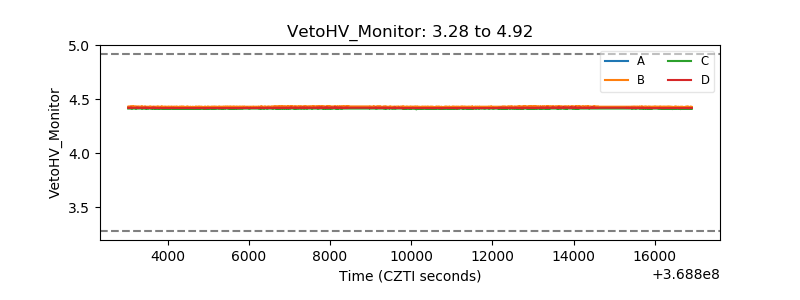 |
| Veto LLD |  |
| Alpha Counter | 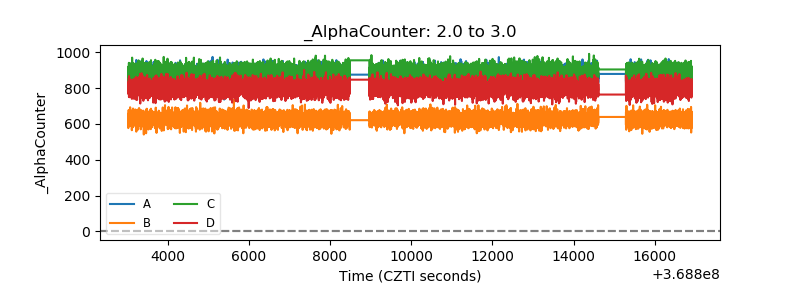 |
| _CPM_Rate | 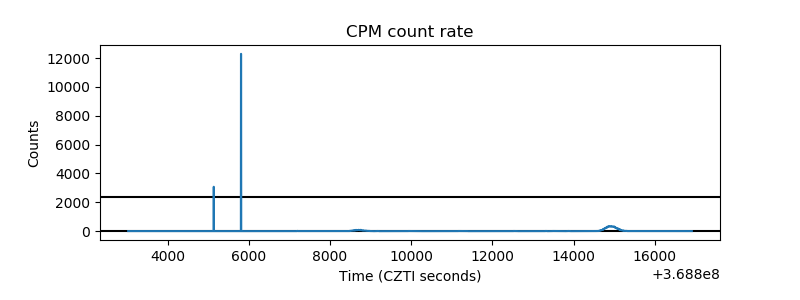 |
| CZT Counter | 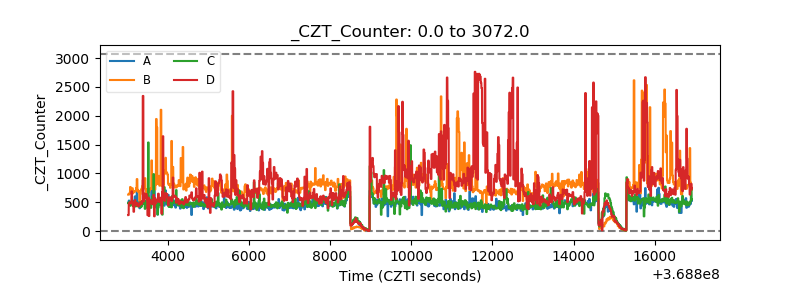 |
| +2.5 Volts monitor |  |
| +5 Volts monitor |  |
| _ROLL_ROT | 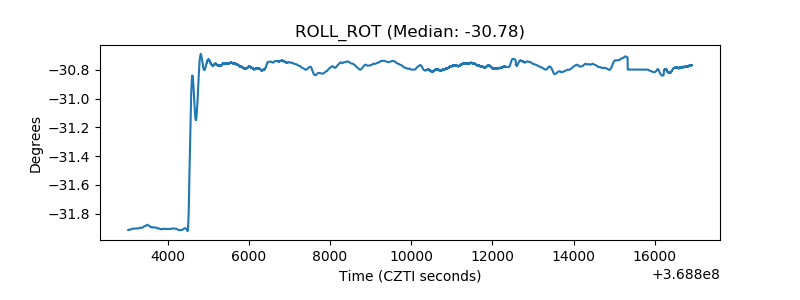 |
| _Roll_DEC | 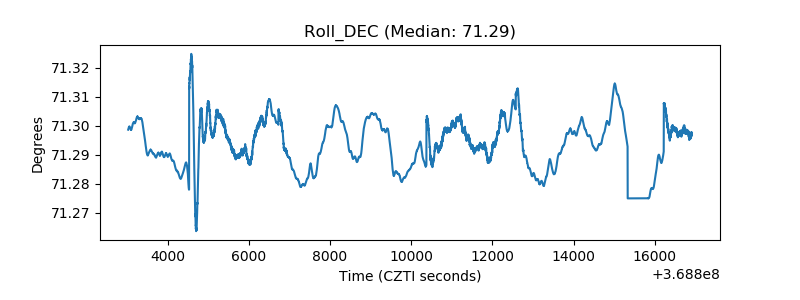 |
| _Roll_RA | 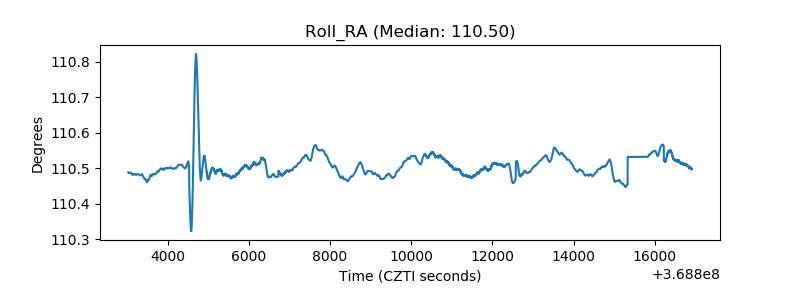 |
| Veto Counter | 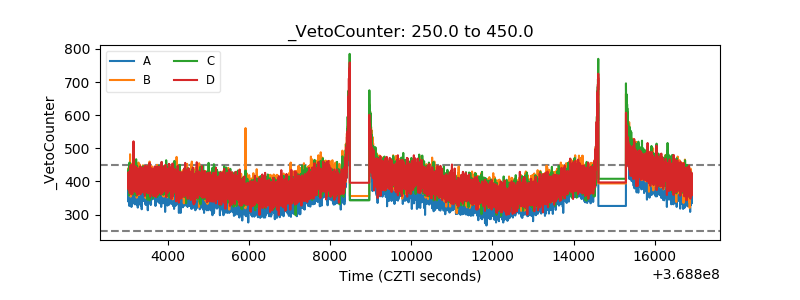 |