| Param | Original file | Final file |
|---|---|---|
| Filename | modeM0/AS1A09_131T01_9000004690_32158cztM0_level2.evt | modeM0/AS1A09_131T01_9000004690_32158cztM0_level2_quad_clean.evt |
| Size (bytes) | 573,505,920 | 82,157,760 |
| Size | 546.9 MB | 78.4 MB |
| Events in quadrant A | 3,071,160 | 517,171 |
| Events in quadrant B | 5,494,073 | 511,829 |
| Events in quadrant C | 3,232,012 | 511,833 |
| Events in quadrant D | 5,137,175 | 499,409 |
| Mode SS | |||
|---|---|---|---|
| Quadrant | BADHDUFLAG | Total packets | Discarded packets |
| A | 0 | 130 | 0 |
| B | 0 | 130 | 0 |
| C | 0 | 130 | 0 |
| D | 0 | 130 | 0 |
| Mode M0 | |||
|---|---|---|---|
| Quadrant | BADHDUFLAG | Total packets | Discarded packets |
| A | 0 | 13320 | 1 |
| B | 0 | 20949 | 1 |
| C | 0 | 13612 | 1 |
| D | 0 | 19646 | 1 |
| Mode M9 | |||
|---|---|---|---|
| Quadrant | BADHDUFLAG | Total packets | Discarded packets |
| A | 0 | 9 | 0 |
| B | 0 | 9 | 0 |
| C | 0 | 9 | 0 |
| D | 0 | 9 | 0 |
| Quadrant | Total seconds | Saturated seconds | Saturation percentage |
|---|---|---|---|
| A | 6417 | 29 | 0.451925% |
| B | 6418 | 264 | 4.113431% |
| C | 6418 | 123 | 1.916485% |
| D | 6418 | 231 | 3.599252% |
Noise dominated data is calculated using 1-second bins in cleaned event files. If a bin has >2000 counts, and if more than 50% of those come from <1% of pixels, then it is considered to be noise-dominated and hence unusable.
| Quadrant | # 1 sec bins | Bins with >0 counts | Bins with >2000 counts | High rate bins dominated by noise | Noise dominated (total time) | Noise dominated (detector-on time) | Marked lightcurve |
|---|---|---|---|---|---|---|---|
| A | 7312 | 6418 | 0 | 0 | 0.00% | 0.00% | 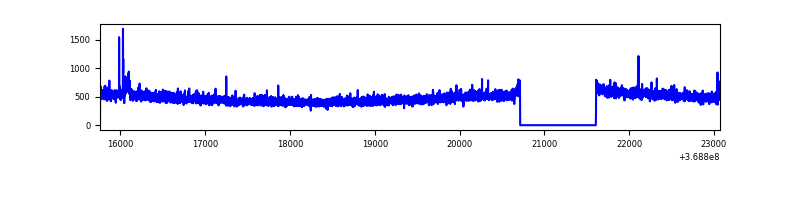 |
| B | 7313 | 6419 | 136 | 136 | 1.86% | 2.12% | 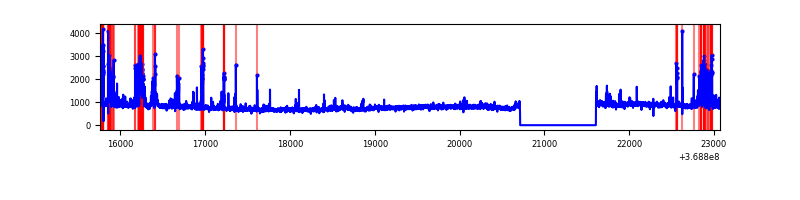 |
| C | 7313 | 6419 | 18 | 18 | 0.25% | 0.28% | 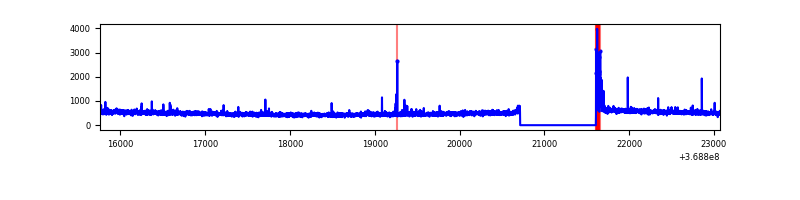 |
| D | 7313 | 6419 | 161 | 161 | 2.20% | 2.51% | 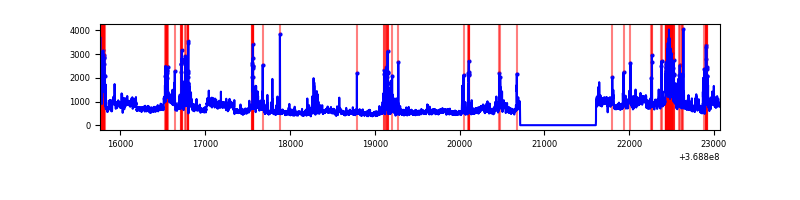 |
Top three noisy pixels from each quadrant. If the there are fewer than three noisy pixels in the level2.evt file, extra rows are filled as -1
| Pixel properties | Quadrant properties | ||||||
|---|---|---|---|---|---|---|---|
| Quadrant | DetID | PixID | Counts | Sigma | Mean | Median | Sigma |
| A | 12 | 189 | 47031 | 297.18 | 779 | 762 | 155.7 |
| A | 13 | 6 | 17056 | 104.66 | 779 | 762 | 155.7 |
| A | 13 | 254 | 11312 | 67.76 | 779 | 762 | 155.7 |
| B | 6 | 159 | 1879698 | 13001.5 | 758 | 738 | 144.5 |
| B | 5 | 172 | 466305 | 3221.5 | 758 | 738 | 144.5 |
| B | 0 | 190 | 49585 | 338.0 | 758 | 738 | 144.5 |
| C | 14 | 238 | 122865 | 691.97 | 751 | 754 | 176.5 |
| C | 0 | 10 | 114776 | 646.13 | 751 | 754 | 176.5 |
| C | 3 | 233 | 17273 | 93.61 | 751 | 754 | 176.5 |
| D | 8 | 195 | 1556232 | 8737.33 | 750 | 728 | 178.0 |
| D | 12 | 233 | 529795 | 2971.79 | 750 | 728 | 178.0 |
| D | 2 | 120 | 102152 | 569.7 | 750 | 728 | 178.0 |
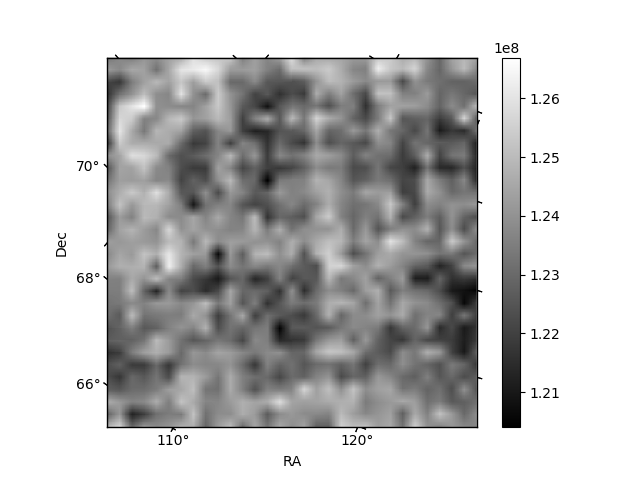
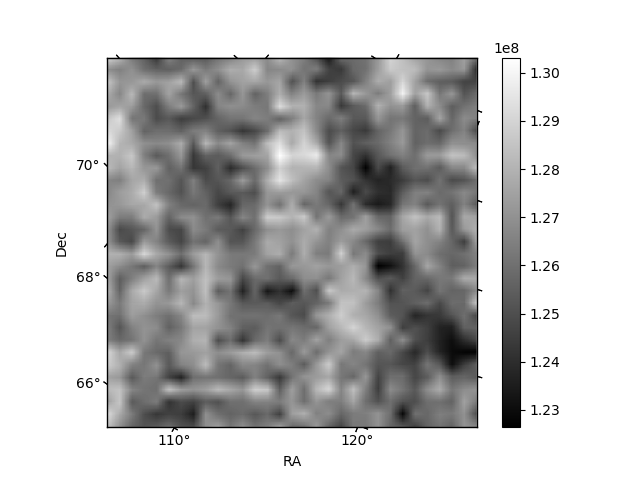
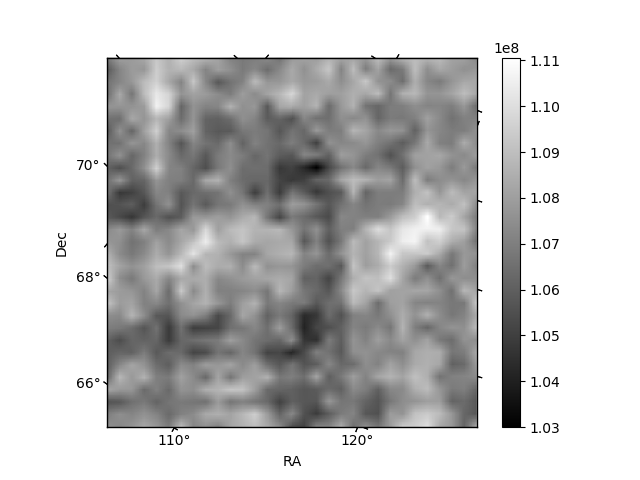
Histogram calculated using DETX and DETY for each event in the final _common_clean file
| Quadrant A | 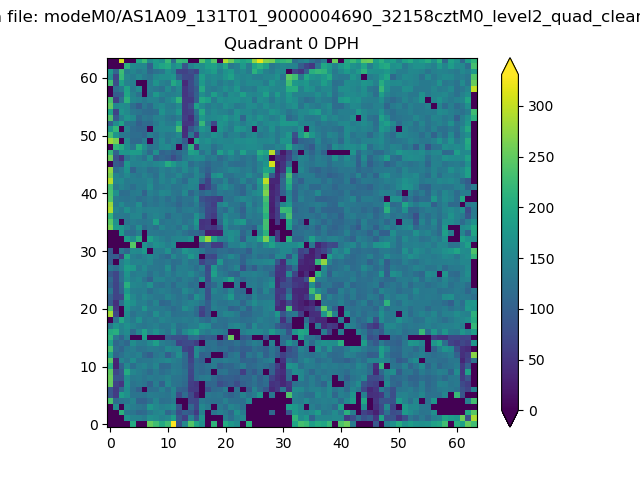 |
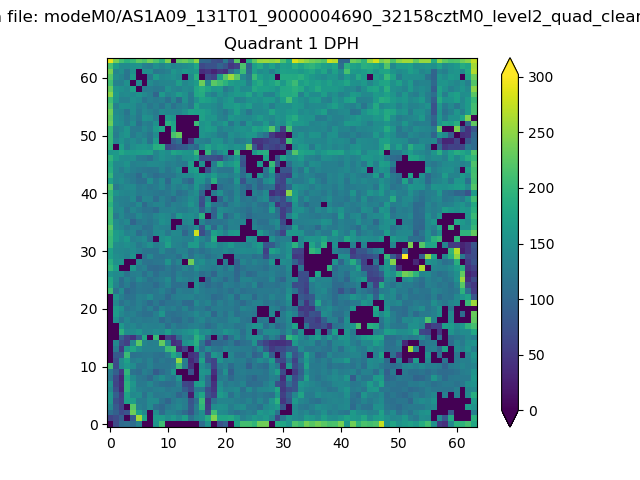 |
Quadrant B |
|---|---|---|---|
| Quadrant D |  |
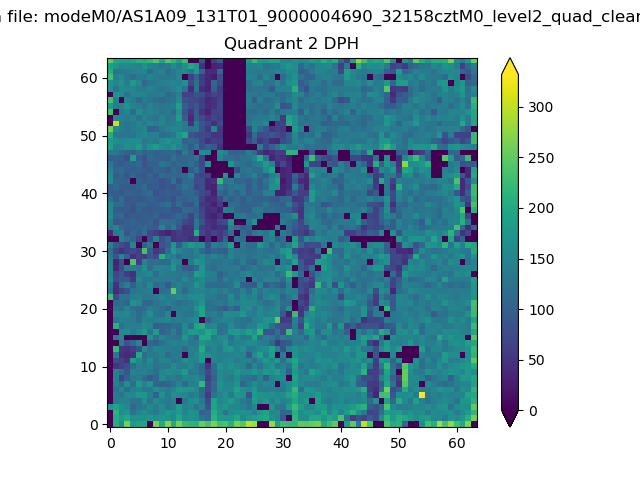 |
Quadrant C |
| Plot type | Count rate plots | Images |
|---|---|---|
| Comparison with Poisson distribution Blue bars denote a histogram of data divided into 1 sec bins. Red curve is a Poisson curve with rate = median count rate of data. |
 |
 |
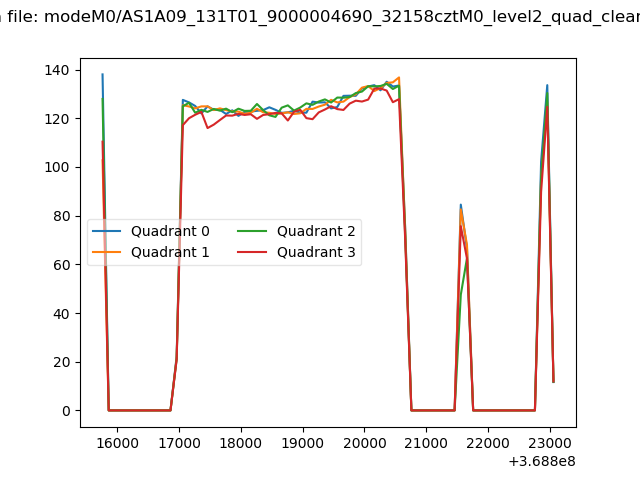
| Quadrant-wise count rates Data is divided into 100 sec bins |
 |
|
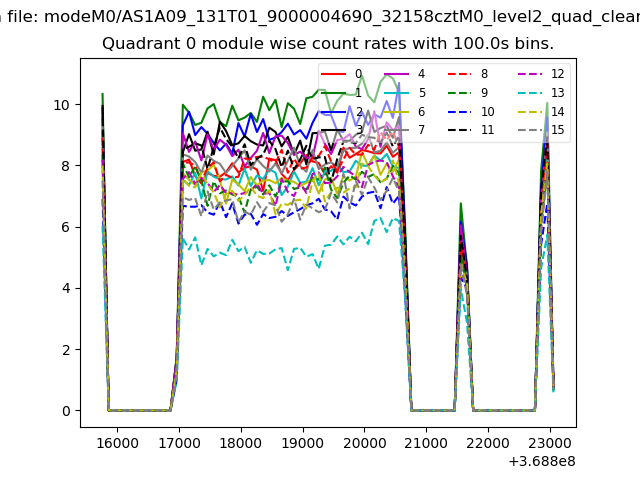
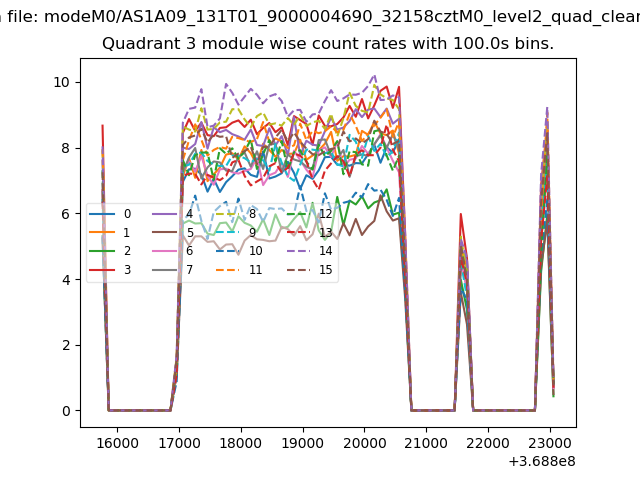
| Module-wise count rates for Quadrant A Data is divided into 100 sec bins |
 |
 |
| Module-wise count rates for Quadrant B Data is divided into 100 sec bins |
 |
 |
| Module-wise count rates for Quadrant C Data is divided into 100 sec bins |
 |
 |
| Module-wise count rates for Quadrant D Data is divided into 100 sec bins |
 |
 |
| Parameter | Plot |
|---|---|
| CZT HV Monitor |  |
| D_VDD | 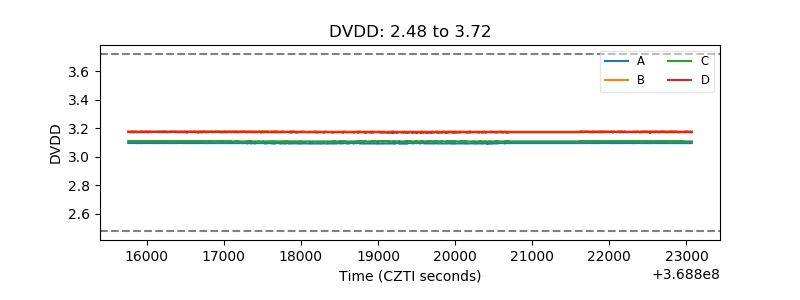 |
| Temperature 1 | 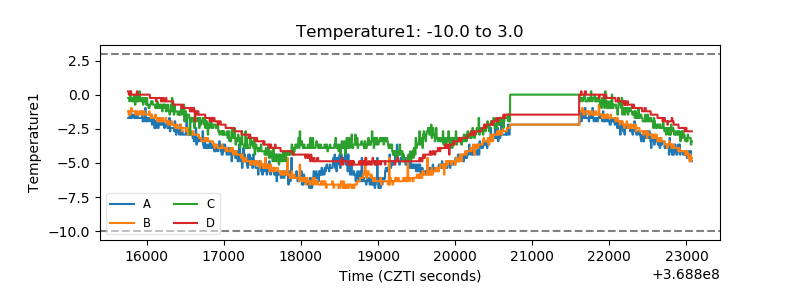 |
| Veto HV Monitor | 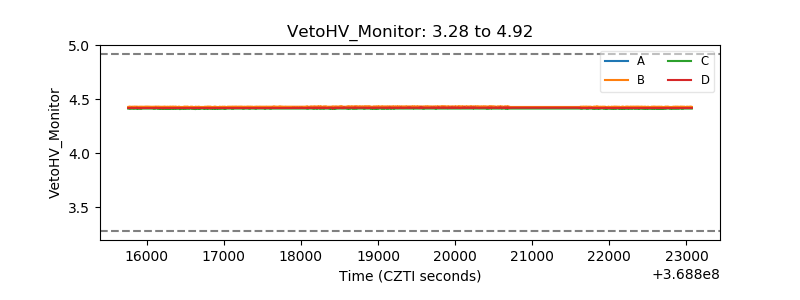 |
| Veto LLD | 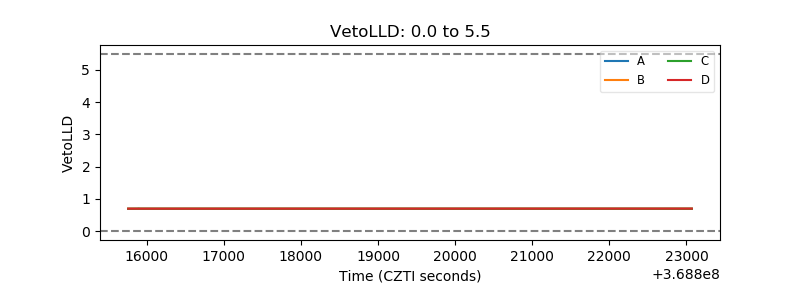 |
| Alpha Counter | 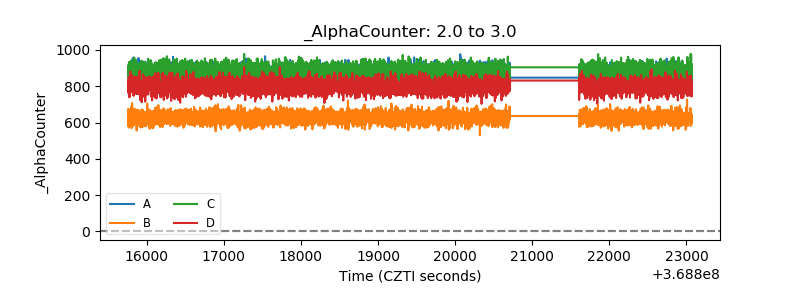 |
| _CPM_Rate | 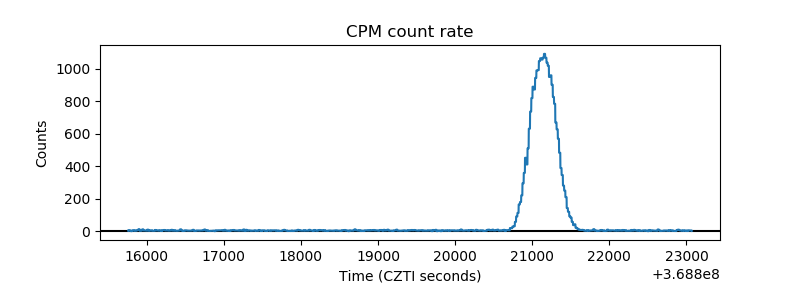 |
| CZT Counter | 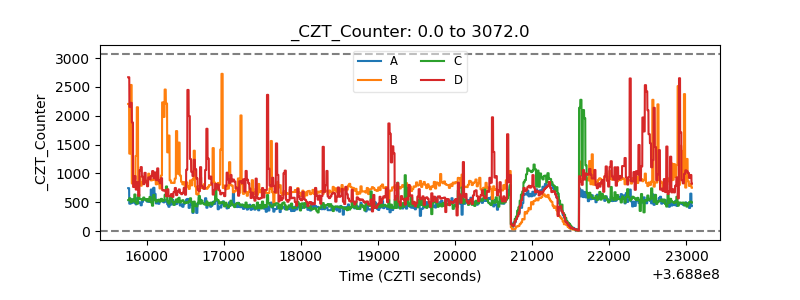 |
| +2.5 Volts monitor |  |
| +5 Volts monitor |  |
| _ROLL_ROT | 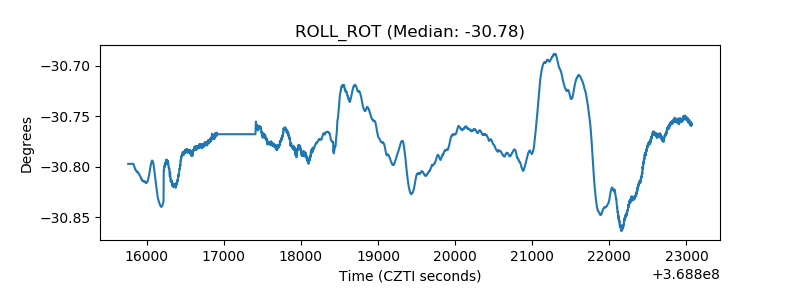 |
| _Roll_DEC | 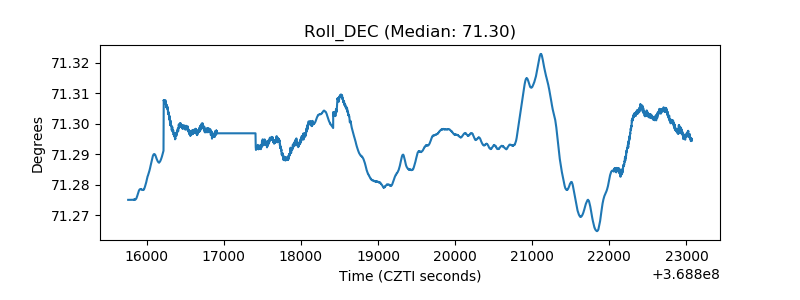 |
| _Roll_RA | 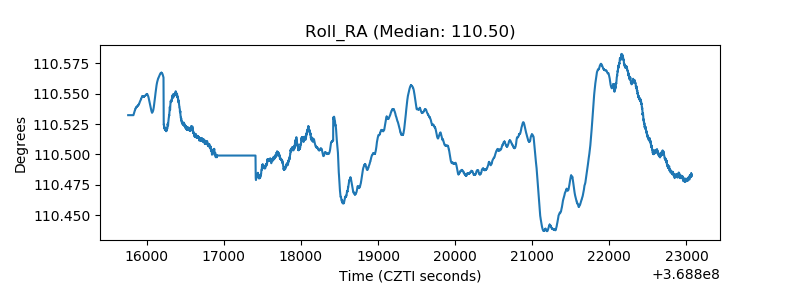 |
| Veto Counter | 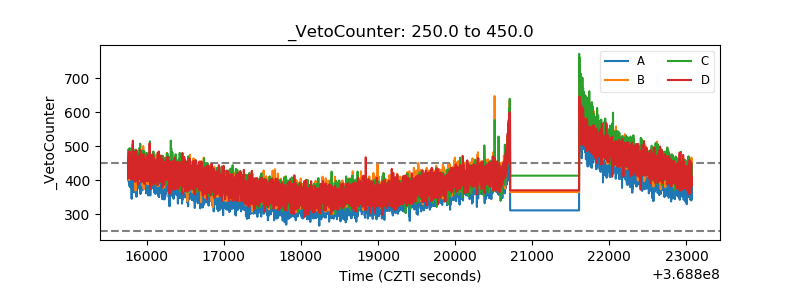 |