| Param | Original file | Final file |
|---|---|---|
| Filename | modeM0/AS1A09_131T01_9000004690_32159cztM0_level2.evt | modeM0/AS1A09_131T01_9000004690_32159cztM0_level2_quad_clean.evt |
| Size (bytes) | 601,853,760 | 94,769,280 |
| Size | 574.0 MB | 90.4 MB |
| Events in quadrant A | 3,285,014 | 605,622 |
| Events in quadrant B | 5,518,146 | 605,708 |
| Events in quadrant C | 3,552,201 | 605,577 |
| Events in quadrant D | 5,420,762 | 588,191 |
| Mode SS | |||
|---|---|---|---|
| Quadrant | BADHDUFLAG | Total packets | Discarded packets |
| A | 0 | 136 | 0 |
| B | 0 | 136 | 0 |
| C | 0 | 136 | 0 |
| D | 0 | 136 | 0 |
| Mode M0 | |||
|---|---|---|---|
| Quadrant | BADHDUFLAG | Total packets | Discarded packets |
| A | 0 | 14199 | 2 |
| B | 0 | 21388 | 2 |
| C | 0 | 14917 | 2 |
| D | 0 | 20761 | 2 |
| Mode M9 | |||
|---|---|---|---|
| Quadrant | BADHDUFLAG | Total packets | Discarded packets |
| A | 0 | 11 | 0 |
| B | 0 | 12 | 0 |
| C | 0 | 12 | 0 |
| D | 0 | 12 | 0 |
| Quadrant | Total seconds | Saturated seconds | Saturation percentage |
|---|---|---|---|
| A | 6667 | 47 | 0.704965% |
| B | 6667 | 171 | 2.564872% |
| C | 6667 | 216 | 3.239838% |
| D | 6667 | 353 | 5.294735% |
Noise dominated data is calculated using 1-second bins in cleaned event files. If a bin has >2000 counts, and if more than 50% of those come from <1% of pixels, then it is considered to be noise-dominated and hence unusable.
| Quadrant | # 1 sec bins | Bins with >0 counts | Bins with >2000 counts | High rate bins dominated by noise | Noise dominated (total time) | Noise dominated (detector-on time) | Marked lightcurve |
|---|---|---|---|---|---|---|---|
| A | 7702 | 6668 | 0 | 0 | 0.00% | 0.00% | 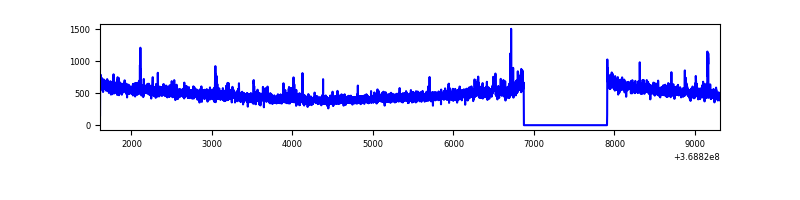 |
| B | 7702 | 6668 | 44 | 44 | 0.57% | 0.66% | 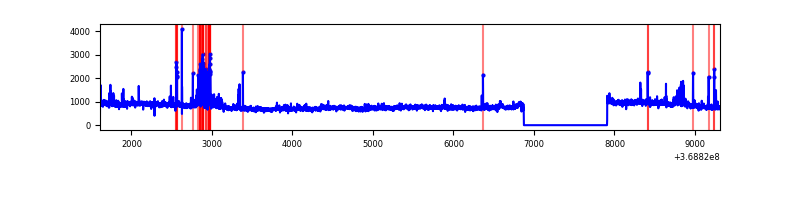 |
| C | 7702 | 6668 | 40 | 40 | 0.52% | 0.60% | 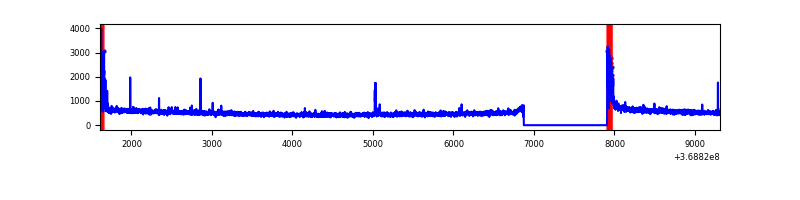 |
| D | 7702 | 6668 | 225 | 225 | 2.92% | 3.37% | 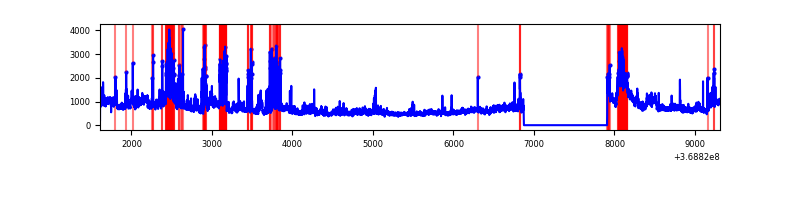 |
Top three noisy pixels from each quadrant. If the there are fewer than three noisy pixels in the level2.evt file, extra rows are filled as -1
| Pixel properties | Quadrant properties | ||||||
|---|---|---|---|---|---|---|---|
| Quadrant | DetID | PixID | Counts | Sigma | Mean | Median | Sigma |
| A | 12 | 189 | 82189 | 491.61 | 825 | 806 | 165.5 |
| A | 13 | 6 | 15214 | 87.03 | 825 | 806 | 165.5 |
| A | 13 | 254 | 12019 | 67.73 | 825 | 806 | 165.5 |
| B | 6 | 159 | 1978150 | 12745.42 | 817 | 797 | 155.1 |
| B | 5 | 172 | 172210 | 1104.88 | 817 | 797 | 155.1 |
| B | 0 | 190 | 60396 | 384.16 | 817 | 797 | 155.1 |
| C | 0 | 10 | 222060 | 1184.16 | 798 | 802 | 186.8 |
| C | 14 | 238 | 129280 | 687.61 | 798 | 802 | 186.8 |
| C | 4 | 175 | 29862 | 155.53 | 798 | 802 | 186.8 |
| D | 8 | 195 | 1571670 | 8311.59 | 796 | 775 | 189.0 |
| D | 12 | 233 | 508121 | 2684.36 | 796 | 775 | 189.0 |
| D | 14 | 50 | 173726 | 915.08 | 796 | 775 | 189.0 |
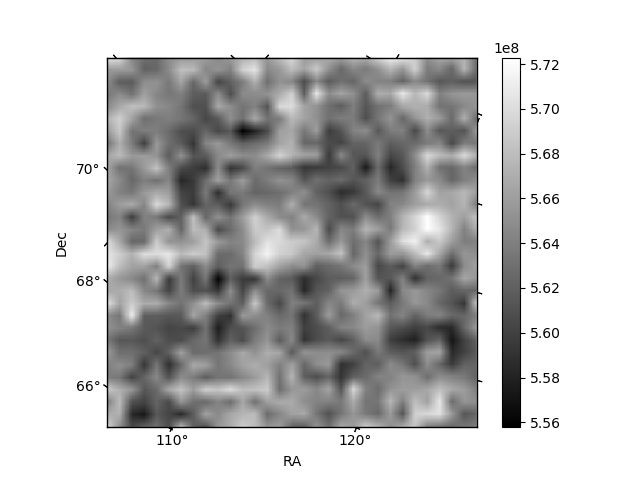
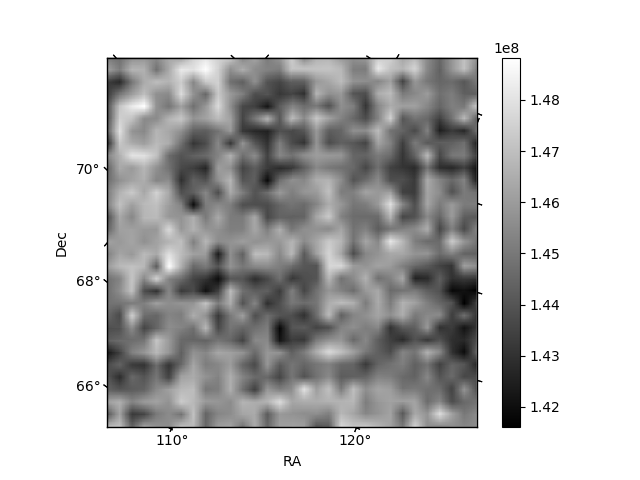
Histogram calculated using DETX and DETY for each event in the final _common_clean file
| Quadrant A | 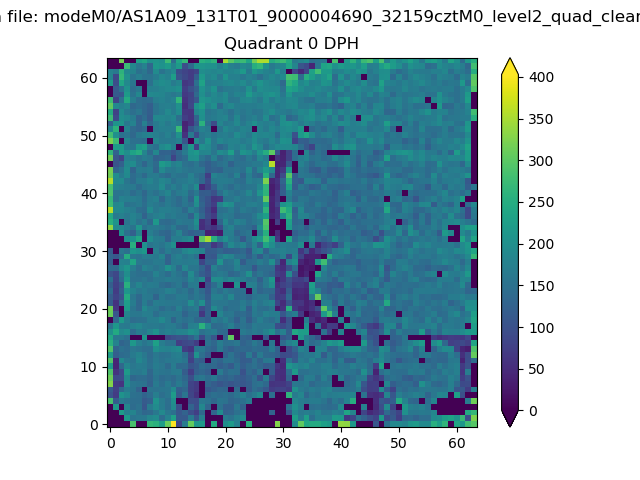 |
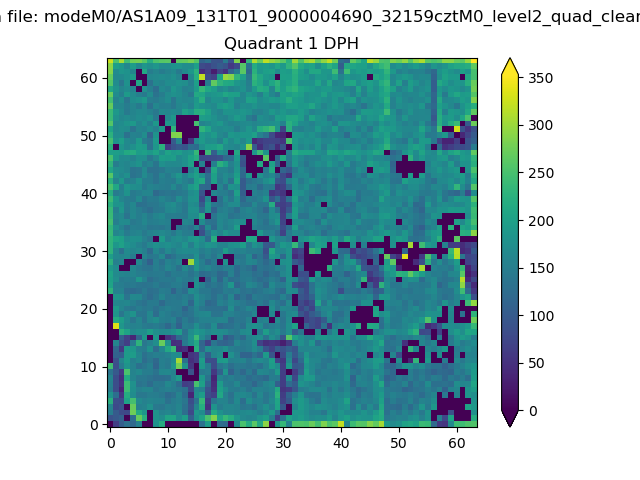 |
Quadrant B |
|---|---|---|---|
| Quadrant D | 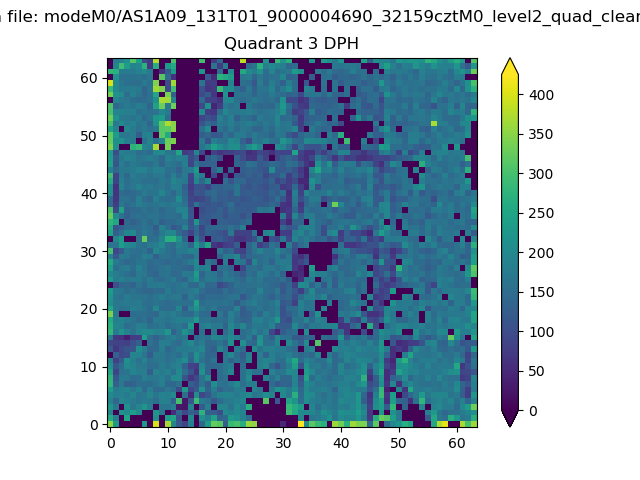 |
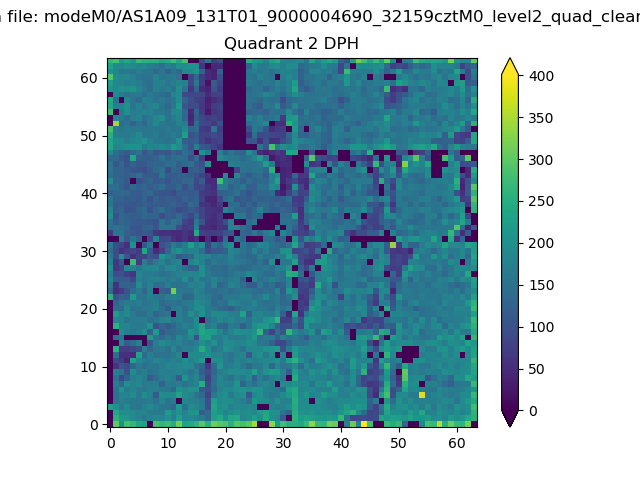 |
Quadrant C |
| Plot type | Count rate plots | Images |
|---|---|---|
| Comparison with Poisson distribution Blue bars denote a histogram of data divided into 1 sec bins. Red curve is a Poisson curve with rate = median count rate of data. |
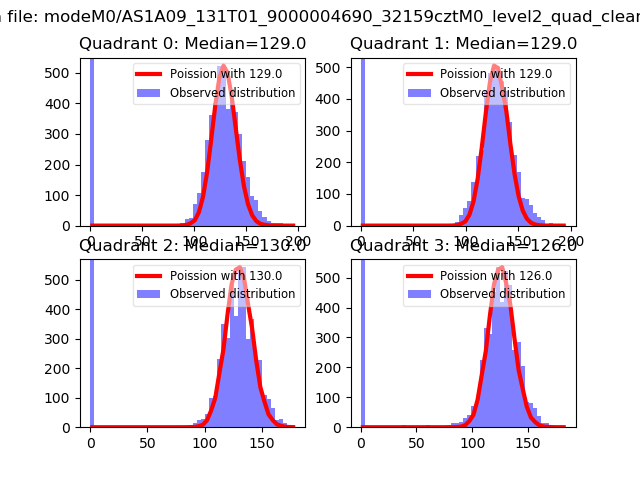 |
 |
| Quadrant-wise count rates Data is divided into 100 sec bins |
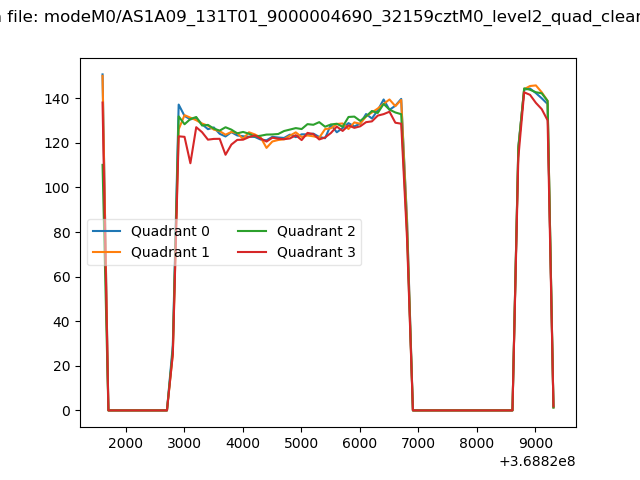 |
|
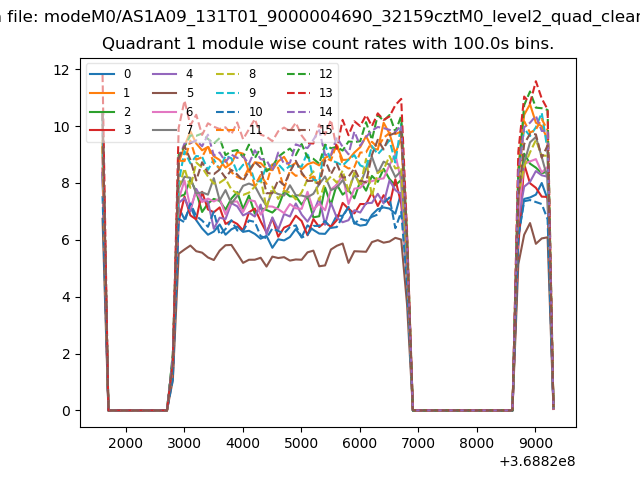
| Module-wise count rates for Quadrant A Data is divided into 100 sec bins |
 |
 |
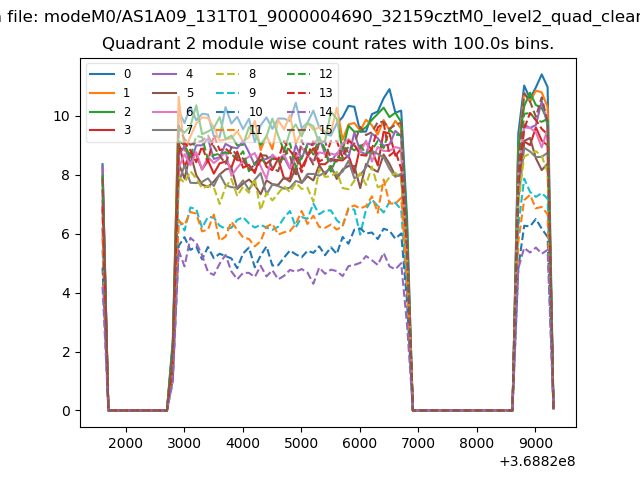
| Module-wise count rates for Quadrant B Data is divided into 100 sec bins |
 |
 |
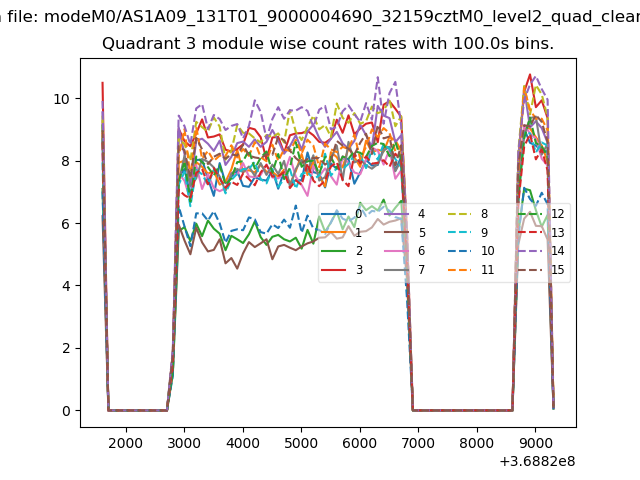
| Module-wise count rates for Quadrant C Data is divided into 100 sec bins |
 |
 |
| Module-wise count rates for Quadrant D Data is divided into 100 sec bins |
 |
 |
| Parameter | Plot |
|---|---|
| CZT HV Monitor | 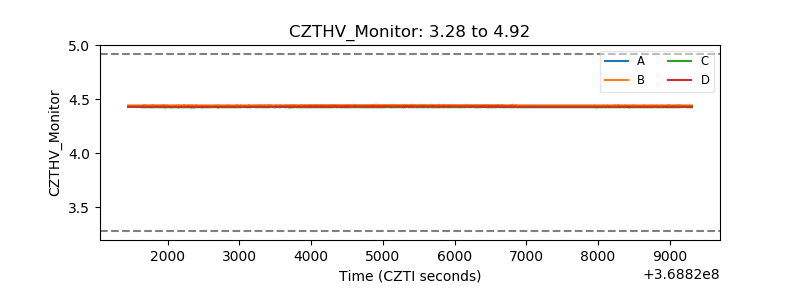 |
| D_VDD | 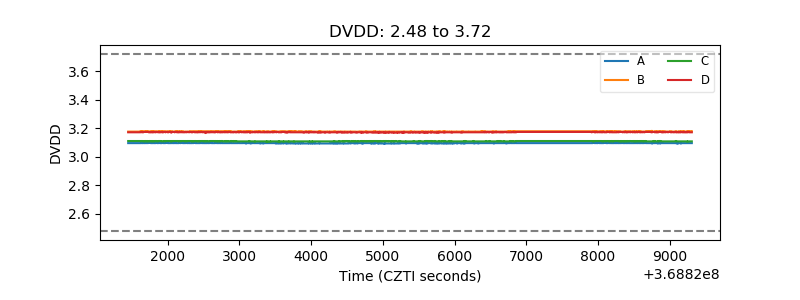 |
| Temperature 1 | 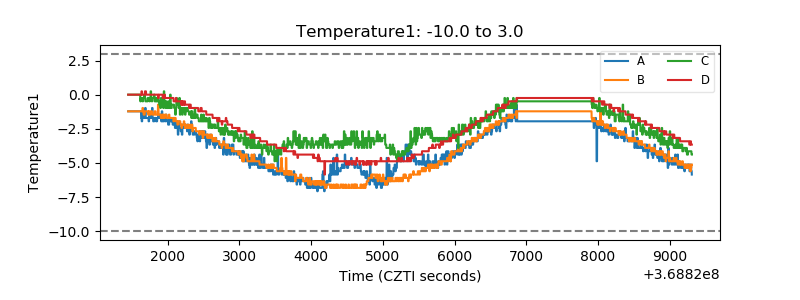 |
| Veto HV Monitor | 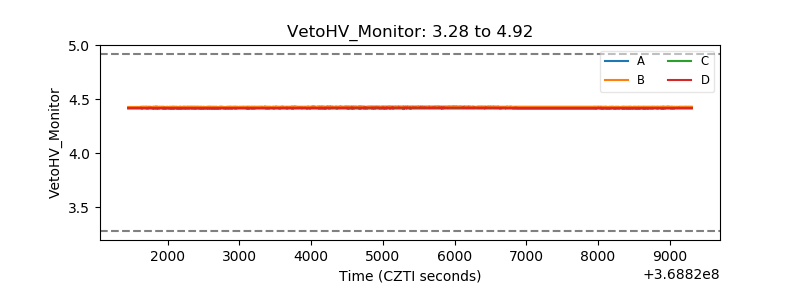 |
| Veto LLD | 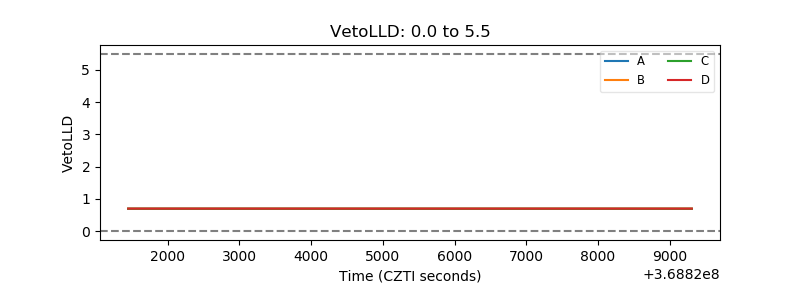 |
| Alpha Counter | 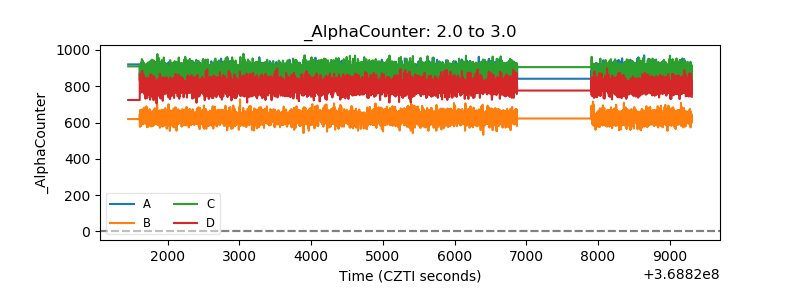 |
| _CPM_Rate | 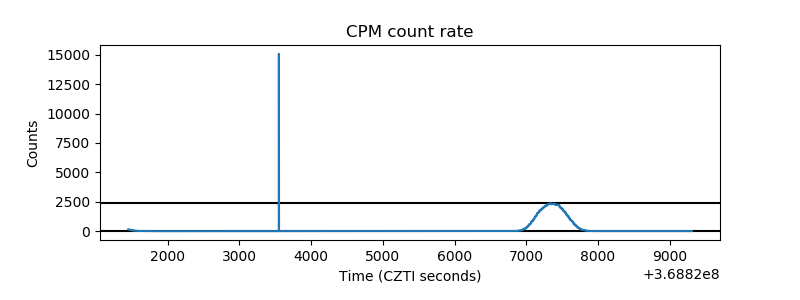 |
| CZT Counter | 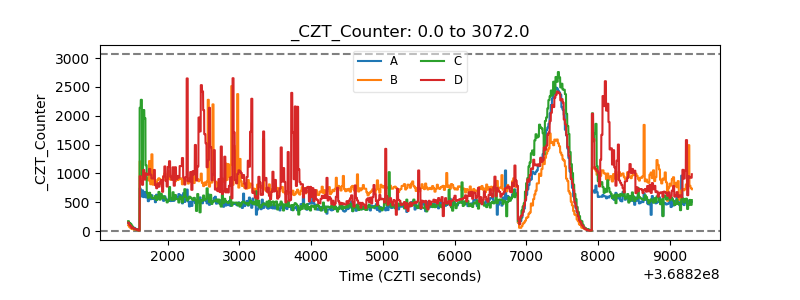 |
| +2.5 Volts monitor |  |
| +5 Volts monitor |  |
| _ROLL_ROT |  |
| _Roll_DEC | 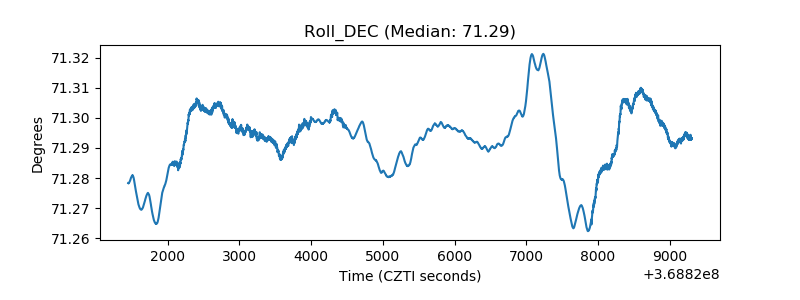 |
| _Roll_RA | 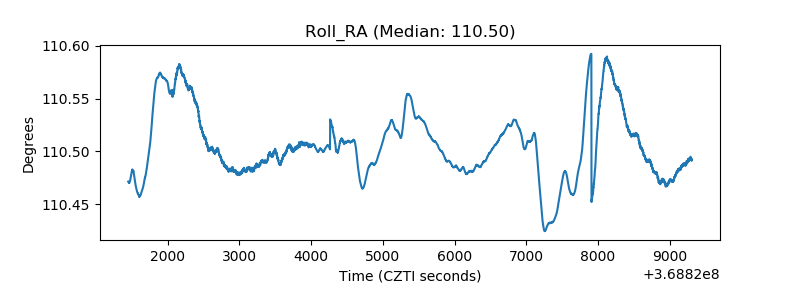 |
| Veto Counter |  |