| Param | Original file | Final file |
|---|---|---|
| Filename | modeM0/AS1A09_131T01_9000004690_32161cztM0_level2.evt | modeM0/AS1A09_131T01_9000004690_32161cztM0_level2_quad_clean.evt |
| Size (bytes) | 579,139,200 | 105,036,480 |
| Size | 552.3 MB | 100.2 MB |
| Events in quadrant A | 3,053,372 | 694,620 |
| Events in quadrant B | 5,166,622 | 696,619 |
| Events in quadrant C | 3,381,997 | 695,845 |
| Events in quadrant D | 5,519,401 | 662,642 |
| Mode SS | |||
|---|---|---|---|
| Quadrant | BADHDUFLAG | Total packets | Discarded packets |
| A | 0 | 126 | 0 |
| B | 0 | 126 | 0 |
| C | 0 | 126 | 0 |
| D | 0 | 126 | 0 |
| Mode M0 | |||
|---|---|---|---|
| Quadrant | BADHDUFLAG | Total packets | Discarded packets |
| A | 0 | 13207 | 1 |
| B | 0 | 19999 | 1 |
| C | 0 | 14215 | 1 |
| D | 0 | 20679 | 1 |
| Mode M9 | |||
|---|---|---|---|
| Quadrant | BADHDUFLAG | Total packets | Discarded packets |
| A | 0 | 12 | 0 |
| B | 0 | 12 | 0 |
| C | 0 | 12 | 0 |
| D | 0 | 12 | 0 |
| Quadrant | Total seconds | Saturated seconds | Saturation percentage |
|---|---|---|---|
| A | 6177 | 25 | 0.404727% |
| B | 6178 | 155 | 2.508903% |
| C | 6178 | 177 | 2.865005% |
| D | 6178 | 343 | 5.551959% |
Noise dominated data is calculated using 1-second bins in cleaned event files. If a bin has >2000 counts, and if more than 50% of those come from <1% of pixels, then it is considered to be noise-dominated and hence unusable.
| Quadrant | # 1 sec bins | Bins with >0 counts | Bins with >2000 counts | High rate bins dominated by noise | Noise dominated (total time) | Noise dominated (detector-on time) | Marked lightcurve |
|---|---|---|---|---|---|---|---|
| A | 7347 | 6178 | 0 | 0 | 0.00% | 0.00% | 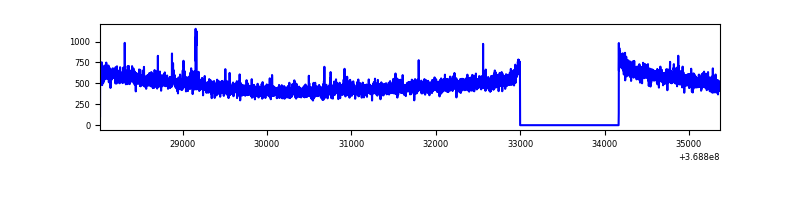 |
| B | 7348 | 6179 | 37 | 37 | 0.50% | 0.60% | 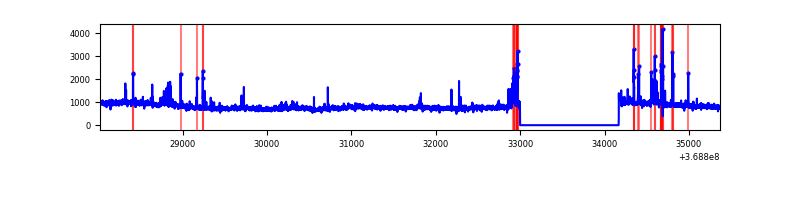 |
| C | 7348 | 6179 | 44 | 44 | 0.60% | 0.71% | 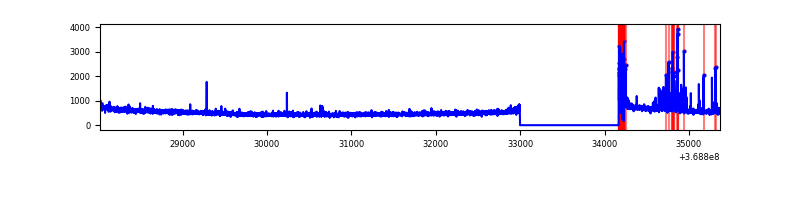 |
| D | 7348 | 6179 | 259 | 259 | 3.52% | 4.19% | 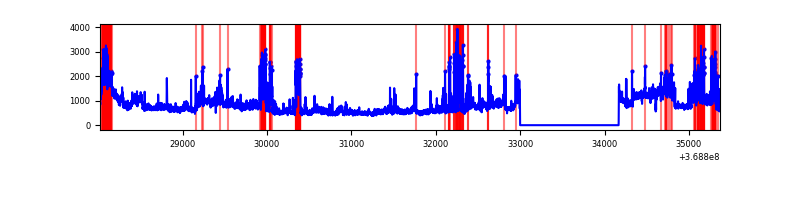 |
Top three noisy pixels from each quadrant. If the there are fewer than three noisy pixels in the level2.evt file, extra rows are filled as -1
| Pixel properties | Quadrant properties | ||||||
|---|---|---|---|---|---|---|---|
| Quadrant | DetID | PixID | Counts | Sigma | Mean | Median | Sigma |
| A | 12 | 189 | 39491 | 249.33 | 777 | 761 | 155.3 |
| A | 13 | 6 | 15960 | 97.84 | 777 | 761 | 155.3 |
| A | 13 | 254 | 11008 | 65.97 | 777 | 761 | 155.3 |
| B | 6 | 159 | 1782892 | 12392.0 | 772 | 755 | 143.8 |
| B | 5 | 172 | 170403 | 1179.64 | 772 | 755 | 143.8 |
| B | 0 | 229 | 71734 | 493.55 | 772 | 755 | 143.8 |
| C | 0 | 10 | 248309 | 1408.48 | 753 | 758 | 175.8 |
| C | 14 | 238 | 125253 | 708.34 | 753 | 758 | 175.8 |
| C | 4 | 175 | 25046 | 138.19 | 753 | 758 | 175.8 |
| D | 8 | 195 | 1722901 | 9548.69 | 752 | 730 | 180.4 |
| D | 12 | 233 | 654664 | 3625.78 | 752 | 730 | 180.4 |
| D | 14 | 50 | 157069 | 866.83 | 752 | 730 | 180.4 |
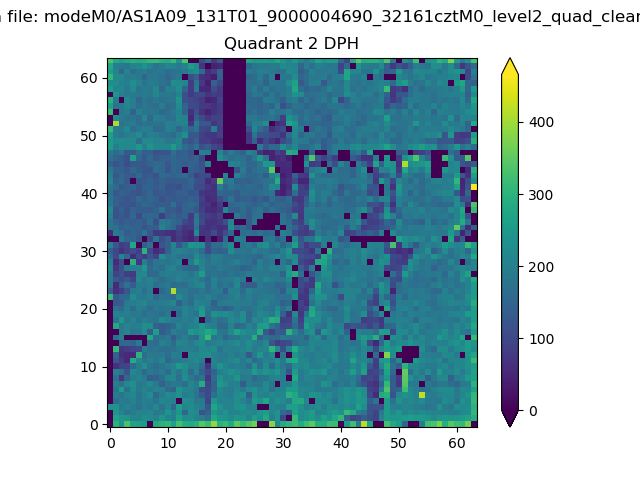
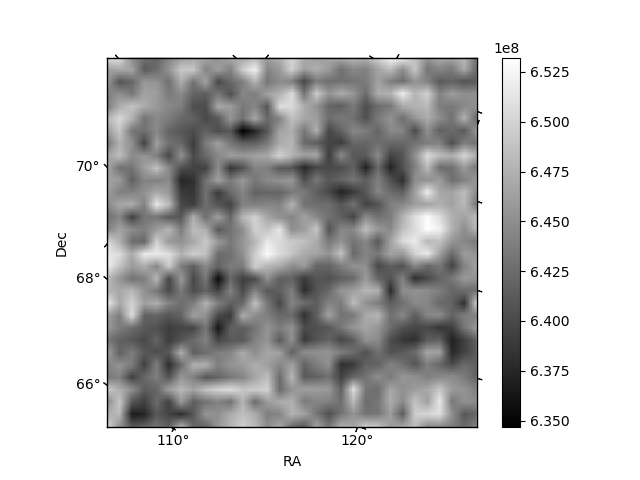
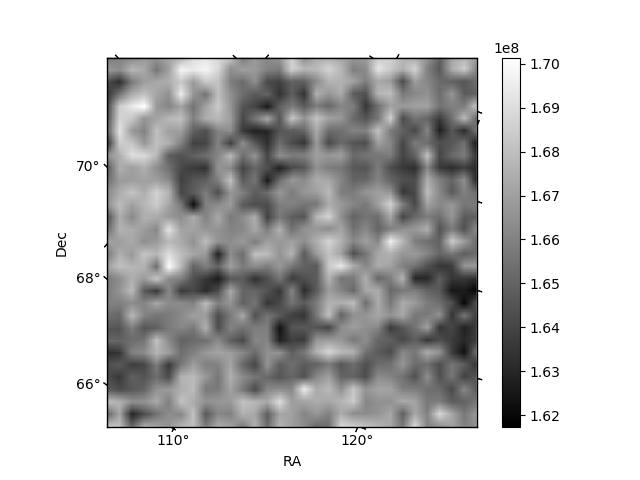
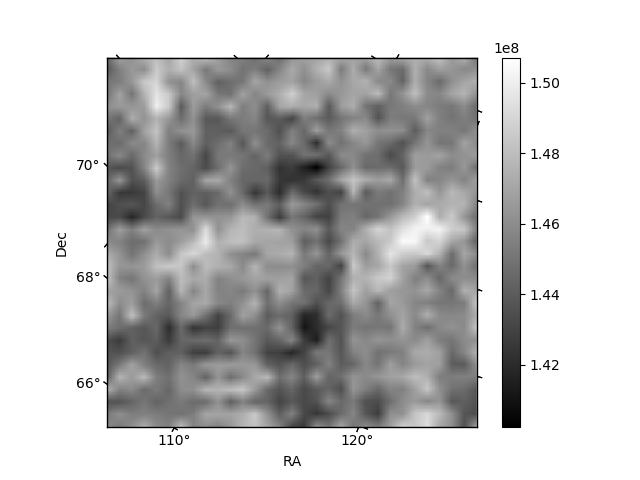
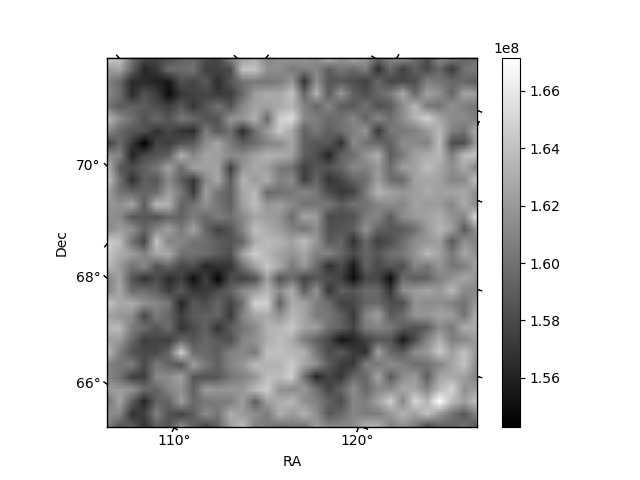
Histogram calculated using DETX and DETY for each event in the final _common_clean file
| Quadrant A | 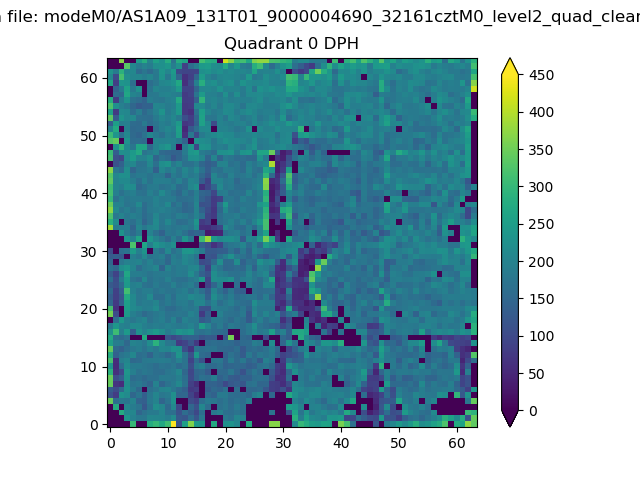 |
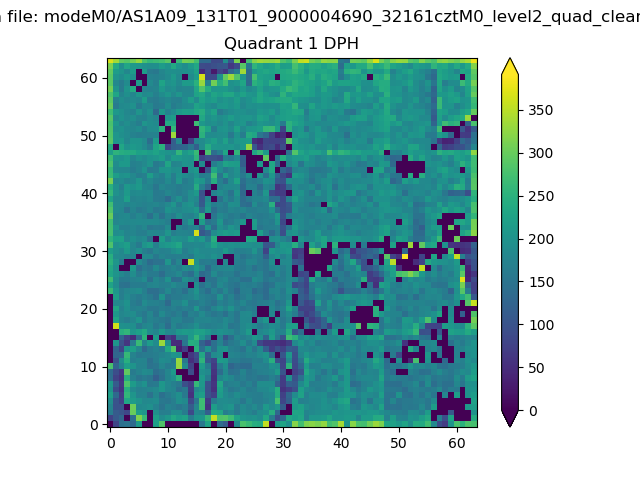 |
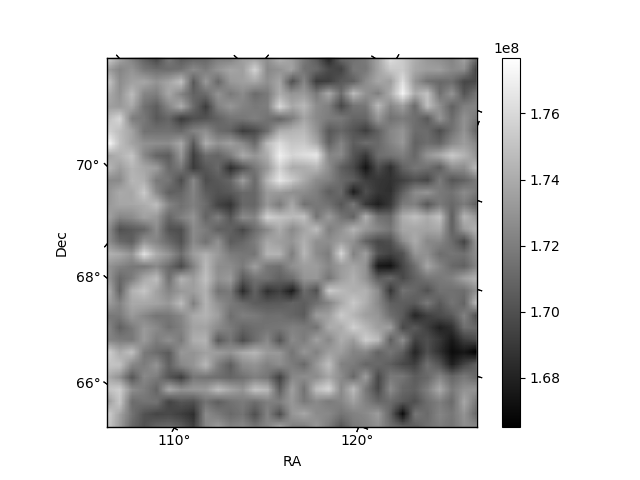
Quadrant B |
|---|---|---|---|
| Quadrant D | 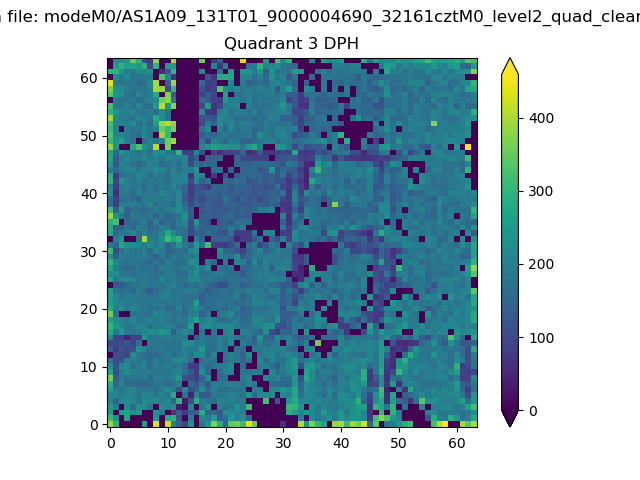 |
 |
Quadrant C |
| Plot type | Count rate plots | Images |
|---|---|---|
| Comparison with Poisson distribution Blue bars denote a histogram of data divided into 1 sec bins. Red curve is a Poisson curve with rate = median count rate of data. |
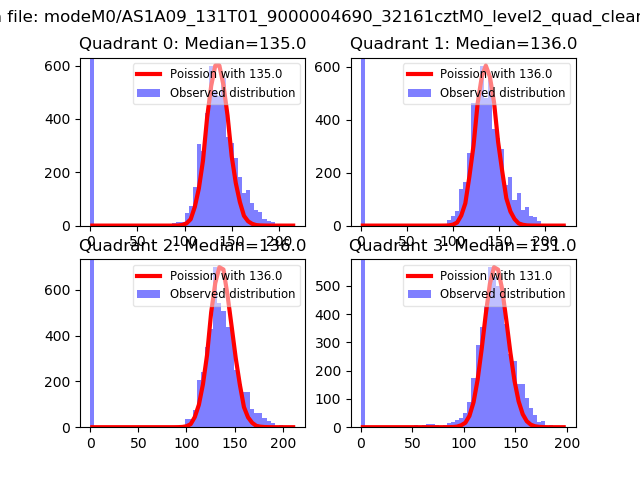 |
 |
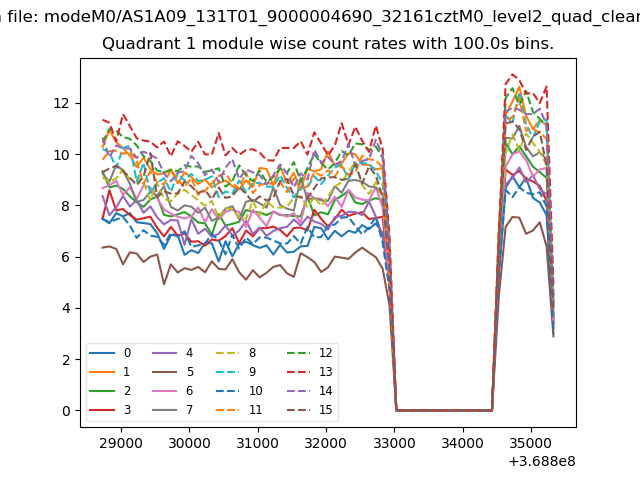
| Quadrant-wise count rates Data is divided into 100 sec bins |
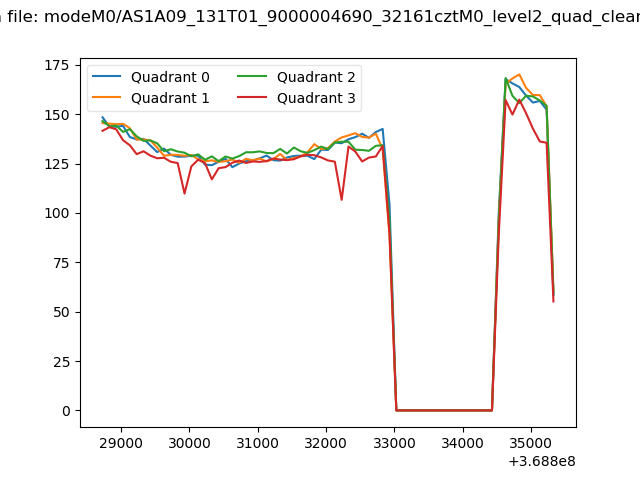 |
|
| Module-wise count rates for Quadrant A Data is divided into 100 sec bins |
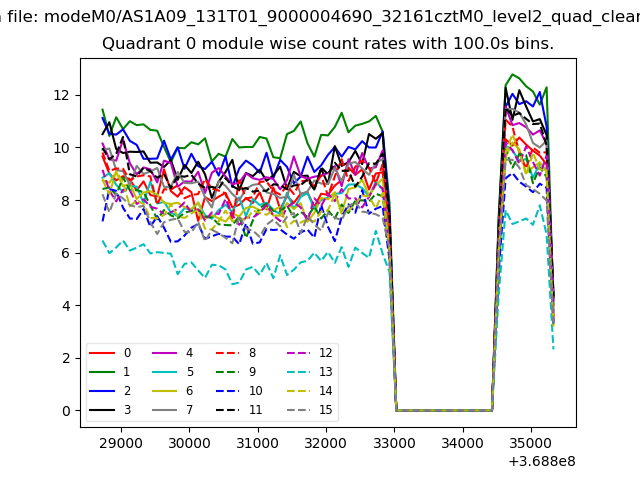 |
 |
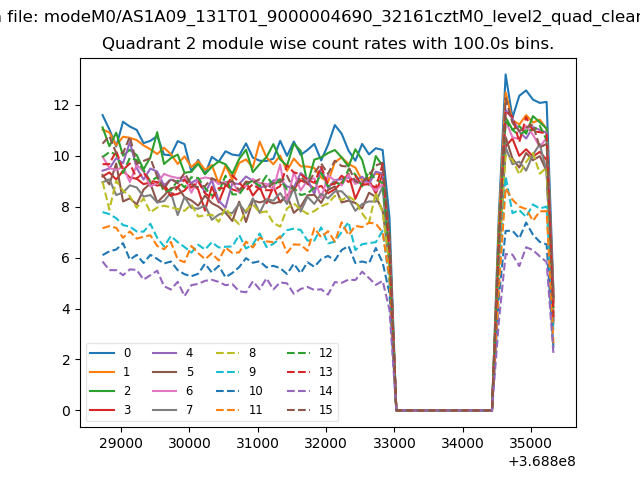
| Module-wise count rates for Quadrant B Data is divided into 100 sec bins |
 |
 |
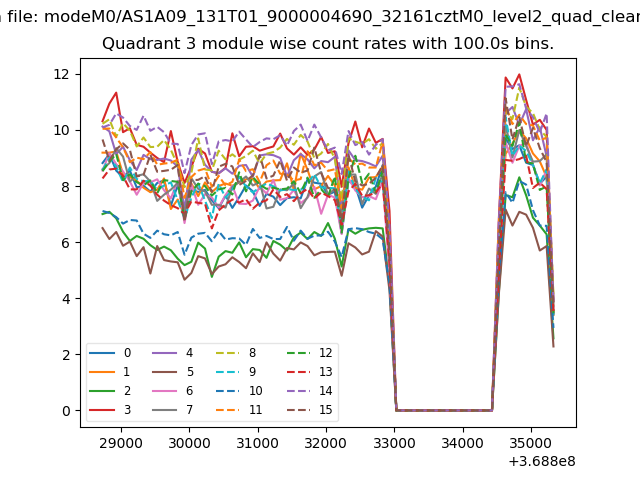
| Module-wise count rates for Quadrant C Data is divided into 100 sec bins |
 |
 |
| Module-wise count rates for Quadrant D Data is divided into 100 sec bins |
 |
 |
| Parameter | Plot |
|---|---|
| CZT HV Monitor | 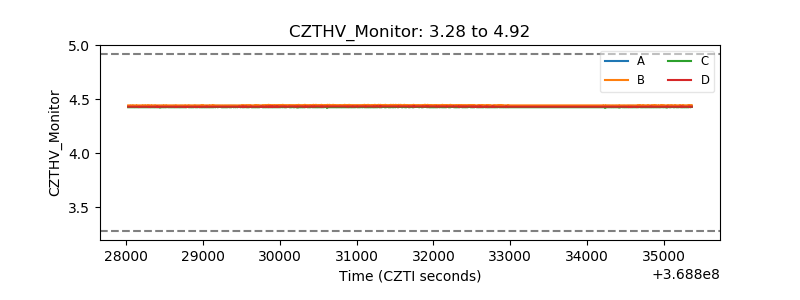 |
| D_VDD | 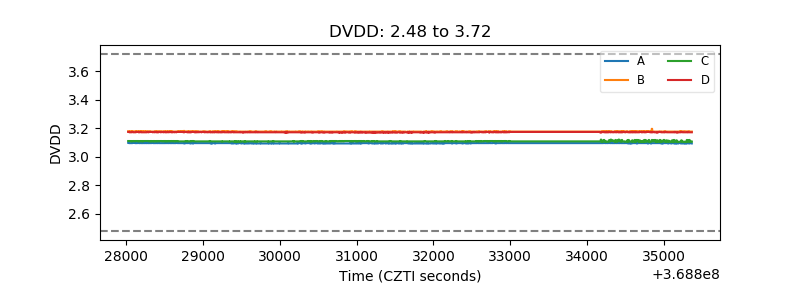 |
| Temperature 1 |  |
| Veto HV Monitor | 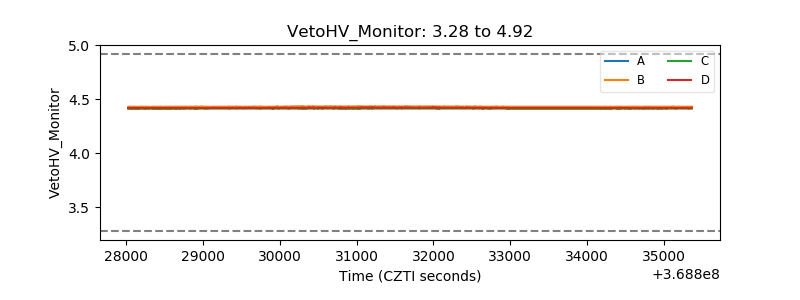 |
| Veto LLD | 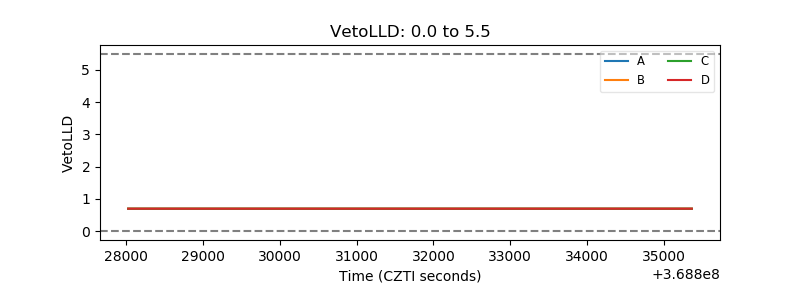 |
| Alpha Counter | 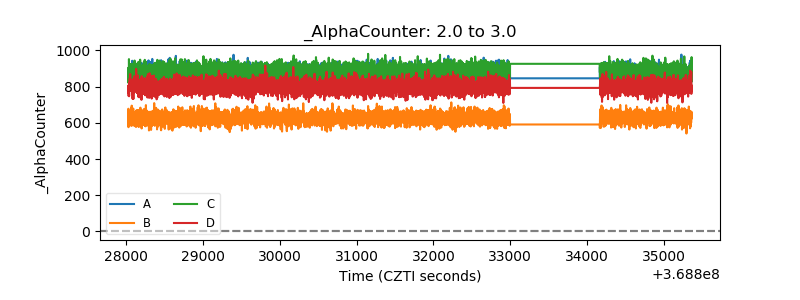 |
| _CPM_Rate | 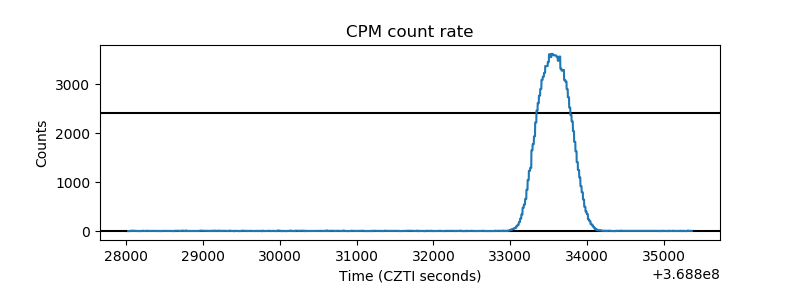 |
| CZT Counter | 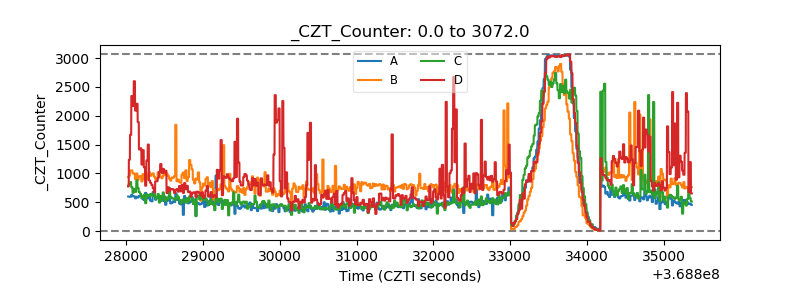 |
| +2.5 Volts monitor |  |
| +5 Volts monitor |  |
| _ROLL_ROT | 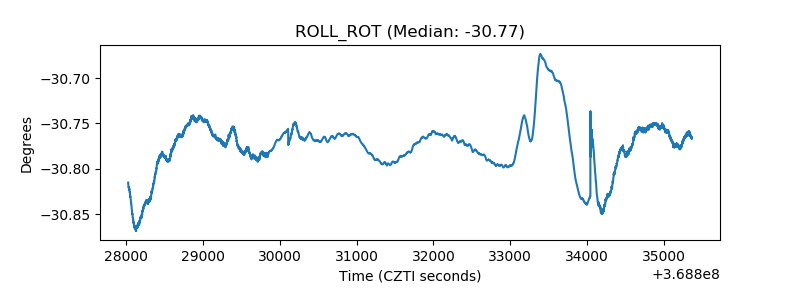 |
| _Roll_DEC |  |
| _Roll_RA | 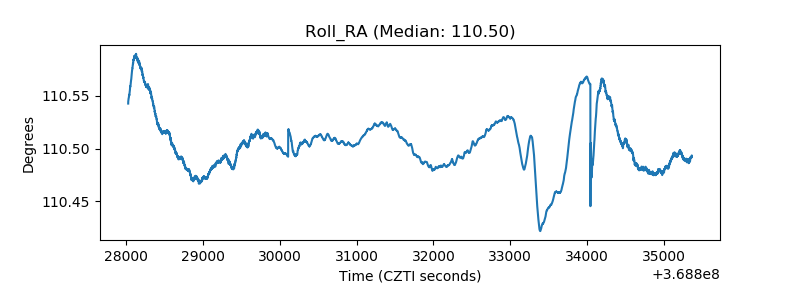 |
| Veto Counter | 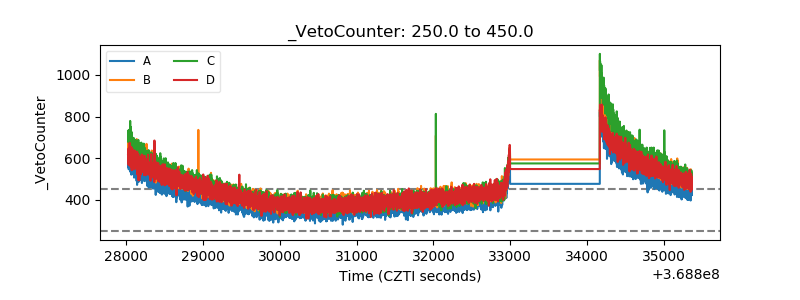 |