| Param | Original file | Final file |
|---|---|---|
| Filename | modeM0/AS1A09_131T01_9000004690_32169cztM0_level2.evt | modeM0/AS1A09_131T01_9000004690_32169cztM0_level2_quad_clean.evt |
| Size (bytes) | 231,776,640 | 45,550,080 |
| Size | 221.0 MB | 43.4 MB |
| Events in quadrant A | 1,311,329 | 308,611 |
| Events in quadrant B | 2,308,749 | 297,673 |
| Events in quadrant C | 1,524,393 | 290,166 |
| Events in quadrant D | 1,685,072 | 284,888 |
| Mode SS | |||
|---|---|---|---|
| Quadrant | BADHDUFLAG | Total packets | Discarded packets |
| A | 0 | 67 | 9 |
| B | 0 | 68 | 8 |
| C | 0 | 70 | 12 |
| D | 0 | 66 | 8 |
| Mode M0 | |||
|---|---|---|---|
| Quadrant | BADHDUFLAG | Total packets | Discarded packets |
| A | 0 | 6950 | 1278 |
| B | 0 | 11021 | 2001 |
| C | 0 | 7610 | 1333 |
| D | 0 | 8613 | 1866 |
| Mode M9 | |||
|---|---|---|---|
| Quadrant | BADHDUFLAG | Total packets | Discarded packets |
| A | 1 | 139882234424104 | 46 |
| B | 1 | -1 | -1 |
| C | 1 | -1 | -1 |
| D | 1 | -1 | -1 |
| Quadrant | Total seconds | Saturated seconds | Saturation percentage |
|---|---|---|---|
| A | 2766 | 4 | 0.144613% |
| B | 2722 | 135 | 4.959589% |
| C | 2763 | 87 | 3.148751% |
| D | 2762 | 81 | 2.932657% |
Noise dominated data is calculated using 1-second bins in cleaned event files. If a bin has >2000 counts, and if more than 50% of those come from <1% of pixels, then it is considered to be noise-dominated and hence unusable.
| Quadrant | # 1 sec bins | Bins with >0 counts | Bins with >2000 counts | High rate bins dominated by noise | Noise dominated (total time) | Noise dominated (detector-on time) | Marked lightcurve |
|---|---|---|---|---|---|---|---|
| A | 6665 | 2876 | 0 | 0 | 0.00% | 0.00% | 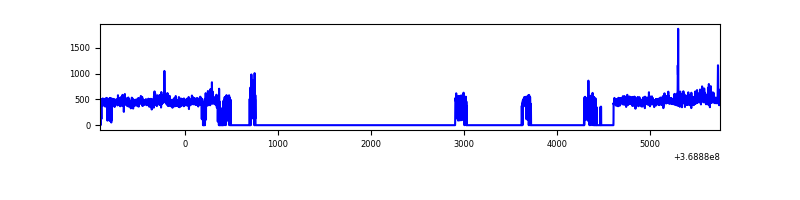 |
| B | 6665 | 2837 | 105 | 105 | 1.58% | 3.70% | 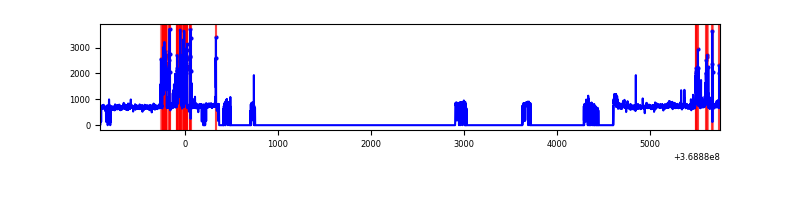 |
| C | 6664 | 2872 | 50 | 50 | 0.75% | 1.74% | 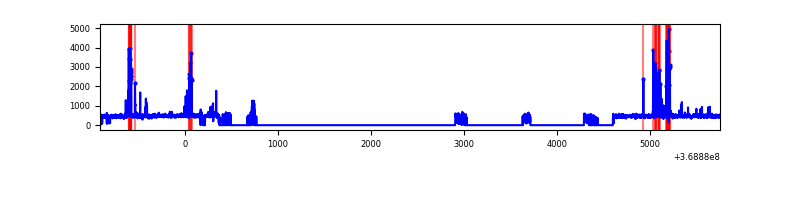 |
| D | 6661 | 2856 | 69 | 69 | 1.04% | 2.42% | 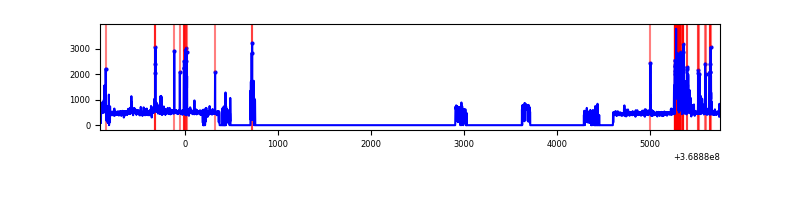 |
Top three noisy pixels from each quadrant. If the there are fewer than three noisy pixels in the level2.evt file, extra rows are filled as -1
| Pixel properties | Quadrant properties | ||||||
|---|---|---|---|---|---|---|---|
| Quadrant | DetID | PixID | Counts | Sigma | Mean | Median | Sigma |
| A | 12 | 189 | 51543 | 764.72 | 324 | 317 | 67.0 |
| A | 13 | 6 | 7502 | 107.26 | 324 | 317 | 67.0 |
| A | 13 | 254 | 4975 | 69.54 | 324 | 317 | 67.0 |
| B | 6 | 159 | 691287 | 11471.98 | 304 | 297 | 60.2 |
| B | 5 | 172 | 290803 | 4823.05 | 304 | 297 | 60.2 |
| B | 0 | 190 | 43323 | 714.33 | 304 | 297 | 60.2 |
| C | 0 | 10 | 243041 | 3417.47 | 299 | 301 | 71.0 |
| C | 14 | 238 | 52160 | 730.11 | 299 | 301 | 71.0 |
| C | 3 | 233 | 41932 | 586.11 | 299 | 301 | 71.0 |
| D | 2 | 250 | 225817 | 3049.55 | 306 | 299 | 74.0 |
| D | 8 | 195 | 190080 | 2566.3 | 306 | 299 | 74.0 |
| D | 12 | 233 | 69954 | 941.91 | 306 | 299 | 74.0 |
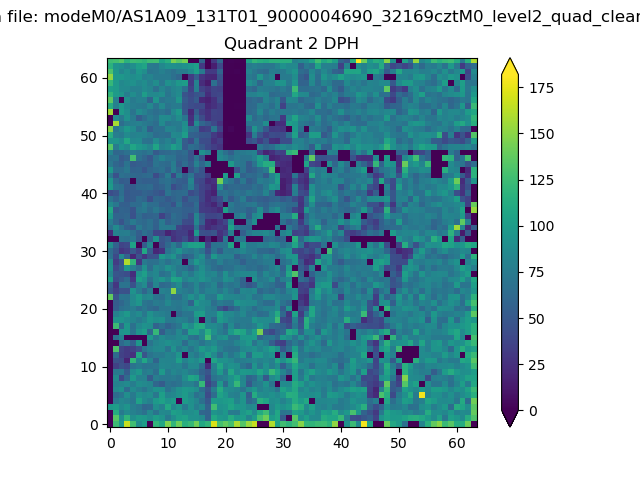
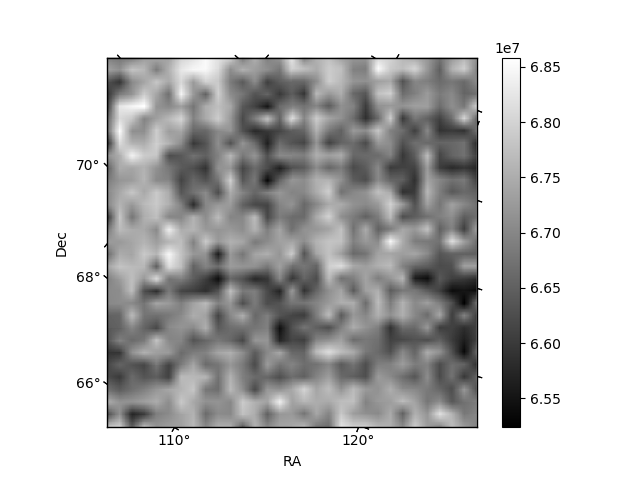
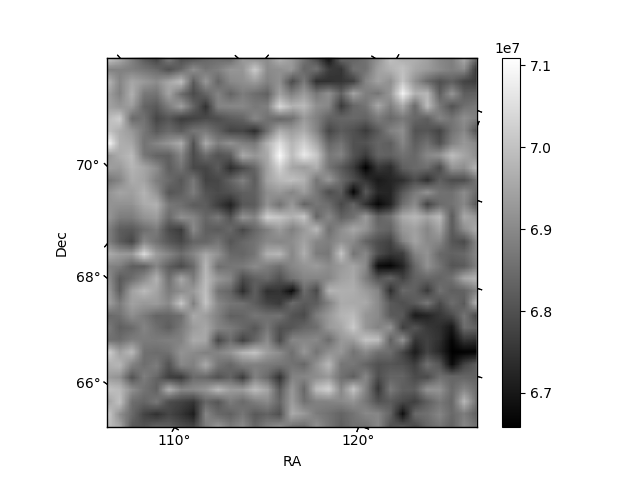
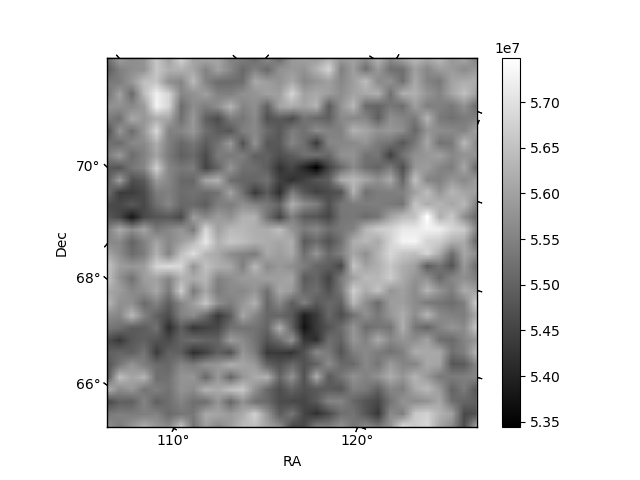
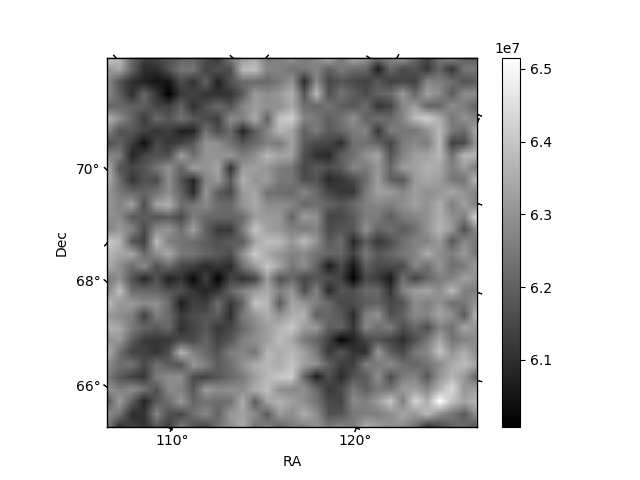
Histogram calculated using DETX and DETY for each event in the final _common_clean file
| Quadrant A | 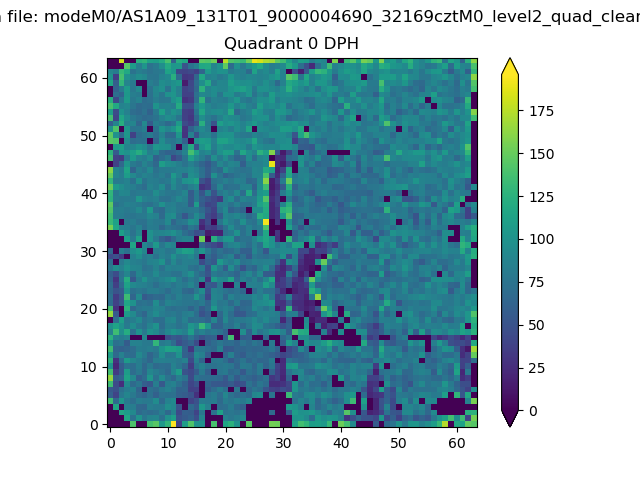 |
 |
Quadrant B |
|---|---|---|---|
| Quadrant D |  |
 |
Quadrant C |
| Plot type | Count rate plots | Images |
|---|---|---|
| Comparison with Poisson distribution Blue bars denote a histogram of data divided into 1 sec bins. Red curve is a Poisson curve with rate = median count rate of data. |
 |
 |
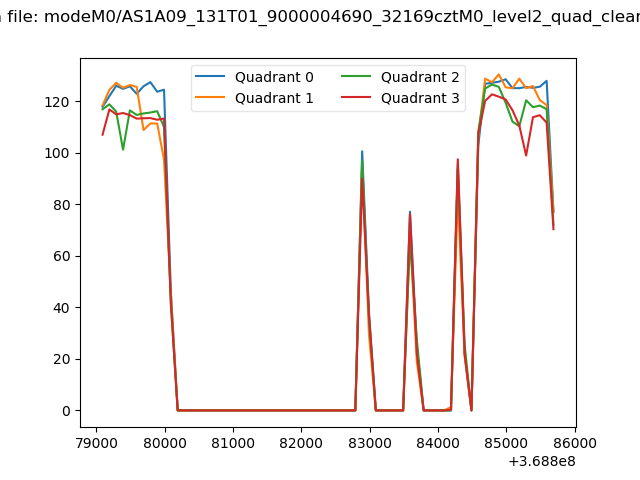
| Quadrant-wise count rates Data is divided into 100 sec bins |
 |
|
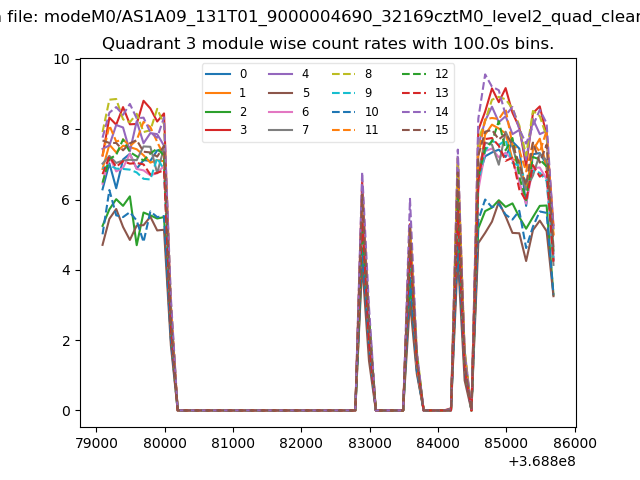
| Module-wise count rates for Quadrant A Data is divided into 100 sec bins |
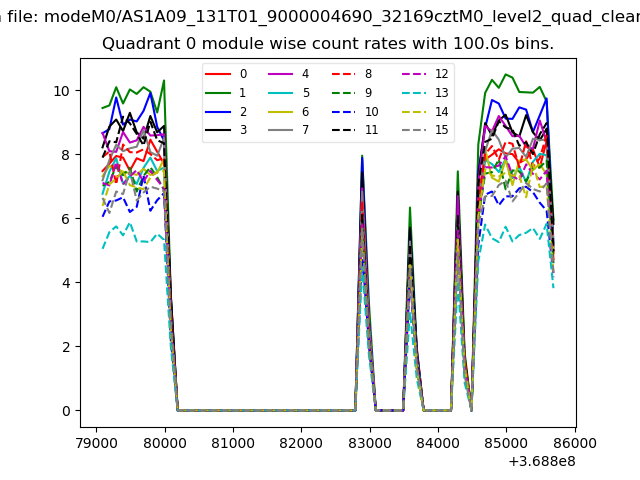 |
 |
| Module-wise count rates for Quadrant B Data is divided into 100 sec bins |
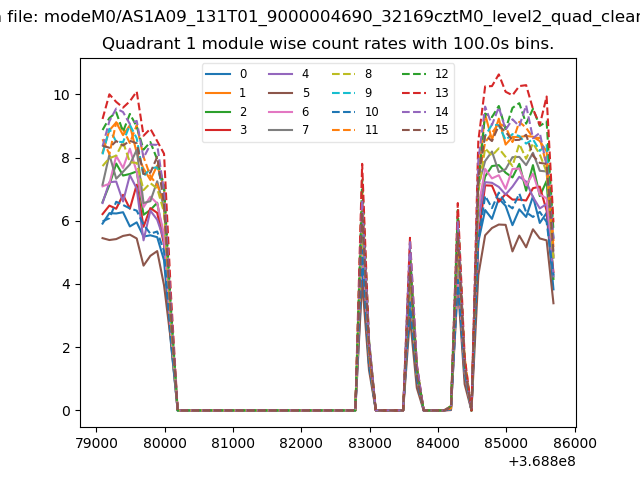 |
 |
| Module-wise count rates for Quadrant C Data is divided into 100 sec bins |
 |
 |
| Module-wise count rates for Quadrant D Data is divided into 100 sec bins |
 |
 |
| Parameter | Plot |
|---|---|
| CZT HV Monitor |  |
| D_VDD | 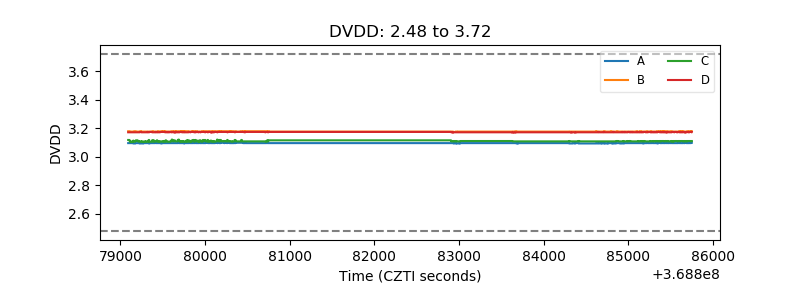 |
| Temperature 1 | 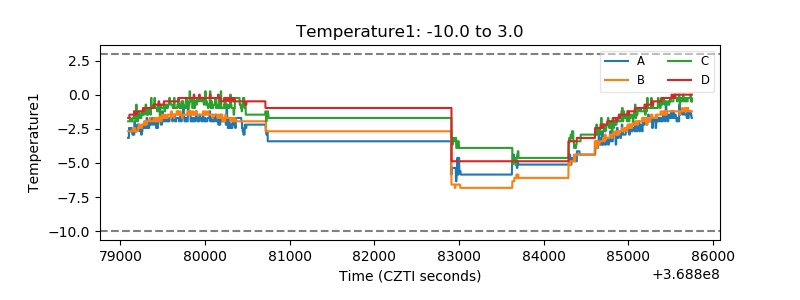 |
| Veto HV Monitor | 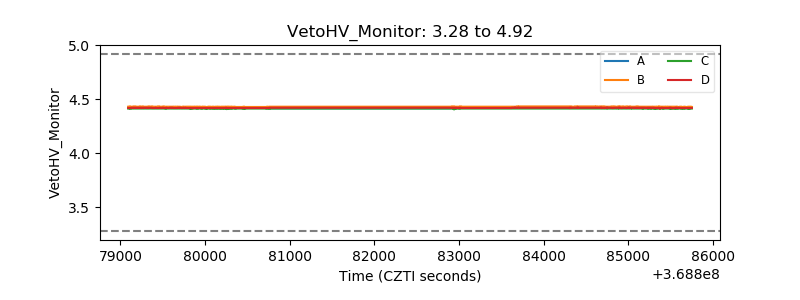 |
| Veto LLD | 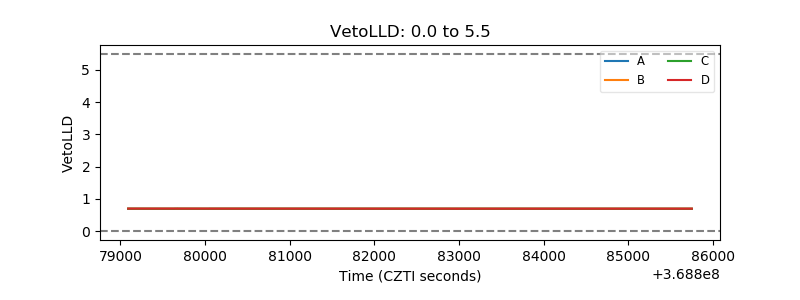 |
| Alpha Counter | 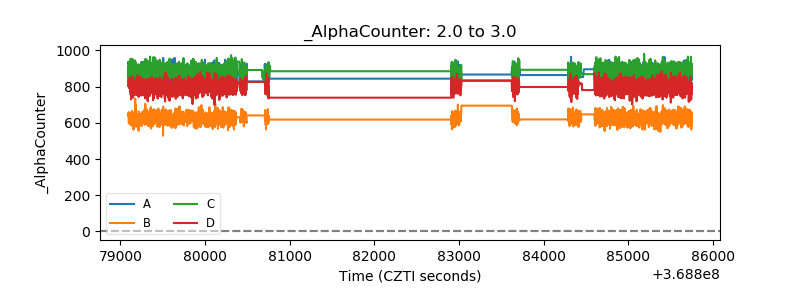 |
| _CPM_Rate | 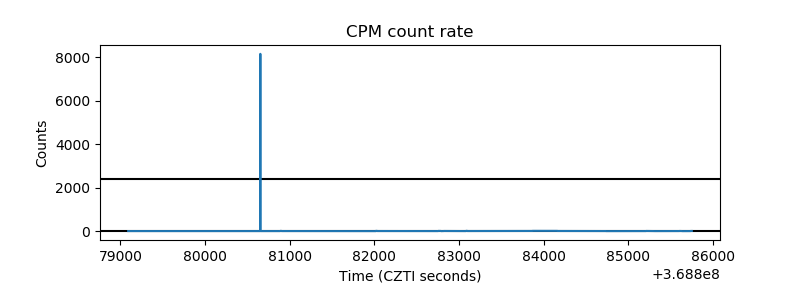 |
| CZT Counter | 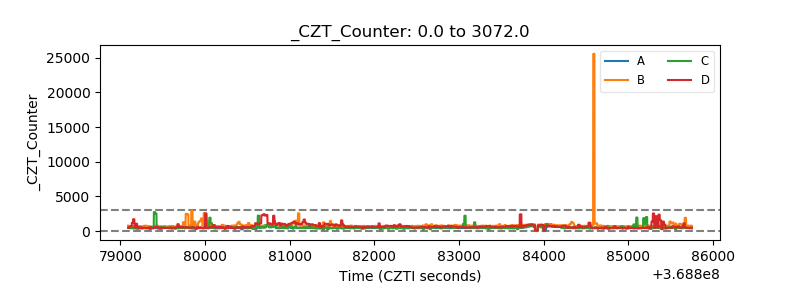 |
| +2.5 Volts monitor |  |
| +5 Volts monitor |  |
| _ROLL_ROT | 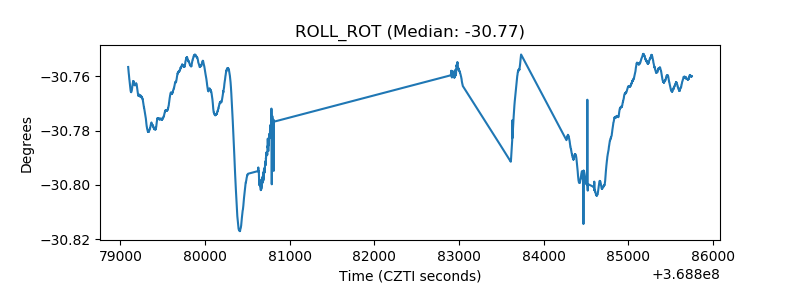 |
| _Roll_DEC | 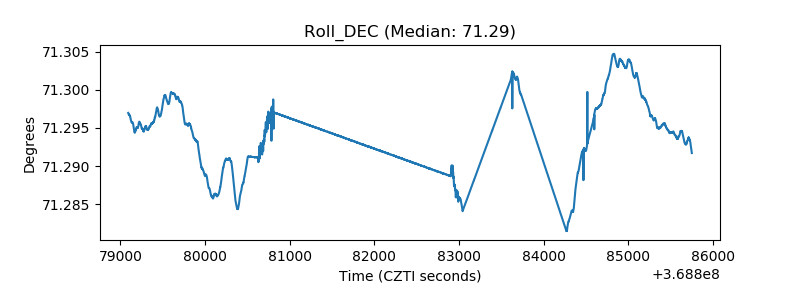 |
| _Roll_RA | 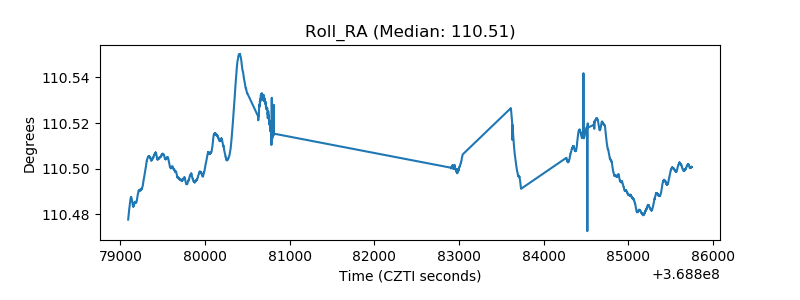 |
| Veto Counter | 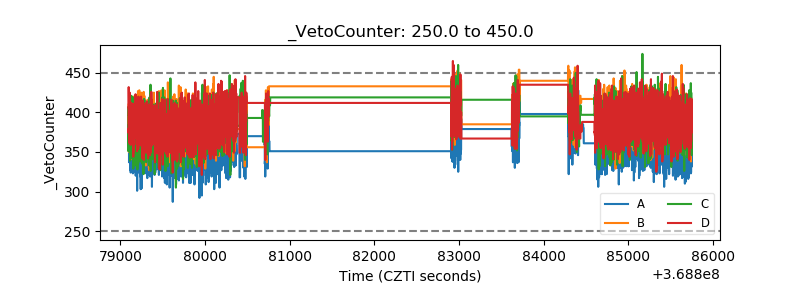 |