| Param | Original file | Final file |
|---|---|---|
| Filename | modeM0/AS1A09_131T01_9000004690_32172cztM0_level2.evt | modeM0/AS1A09_131T01_9000004690_32172cztM0_level2_quad_clean.evt |
| Size (bytes) | 1,565,879,040 | 255,424,320 |
| Size | 1.5 GB | 243.6 MB |
| Events in quadrant A | 8,420,259 | 1,693,974 |
| Events in quadrant B | 14,766,176 | 1,683,868 |
| Events in quadrant C | 10,634,229 | 1,504,263 |
| Events in quadrant D | 12,397,320 | 1,622,875 |
| Mode SS | |||
|---|---|---|---|
| Quadrant | BADHDUFLAG | Total packets | Discarded packets |
| A | 0 | 362 | 0 |
| B | 0 | 362 | 0 |
| C | 0 | 362 | 0 |
| D | 0 | 362 | 0 |
| Mode M0 | |||
|---|---|---|---|
| Quadrant | BADHDUFLAG | Total packets | Discarded packets |
| A | 0 | 36549 | 4 |
| B | 0 | 56932 | 3 |
| C | 0 | 43139 | 3 |
| D | 0 | 48789 | 3 |
| Mode M9 | |||
|---|---|---|---|
| Quadrant | BADHDUFLAG | Total packets | Discarded packets |
| A | 0 | 18 | 0 |
| B | 0 | 18 | 0 |
| C | 0 | 18 | 0 |
| D | 0 | 18 | 0 |
| Quadrant | Total seconds | Saturated seconds | Saturation percentage |
|---|---|---|---|
| A | 17849 | 125 | 0.700319% |
| B | 17849 | 656 | 3.675276% |
| C | 17849 | 3945 | 22.102079% |
| D | 17849 | 556 | 3.115020% |
Noise dominated data is calculated using 1-second bins in cleaned event files. If a bin has >2000 counts, and if more than 50% of those come from <1% of pixels, then it is considered to be noise-dominated and hence unusable.
| Quadrant | # 1 sec bins | Bins with >0 counts | Bins with >2000 counts | High rate bins dominated by noise | Noise dominated (total time) | Noise dominated (detector-on time) | Marked lightcurve |
|---|---|---|---|---|---|---|---|
| A | 19624 | 17852 | 0 | 0 | 0.00% | 0.00% | 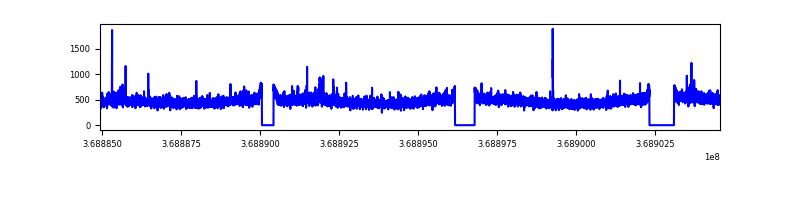 |
| B | 19624 | 17852 | 227 | 227 | 1.16% | 1.27% | 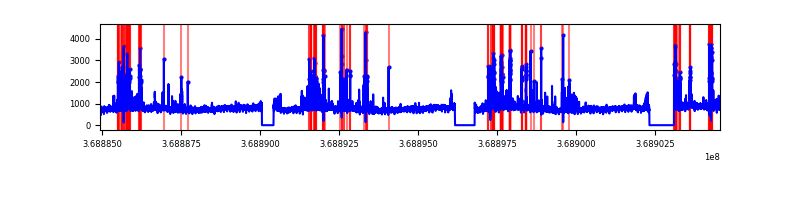 |
| C | 19624 | 17846 | 77 | 77 | 0.39% | 0.43% | 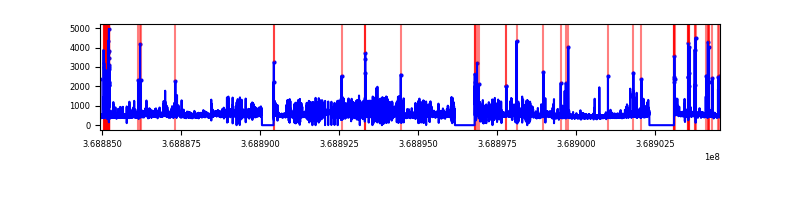 |
| D | 19624 | 17851 | 349 | 349 | 1.78% | 1.96% | 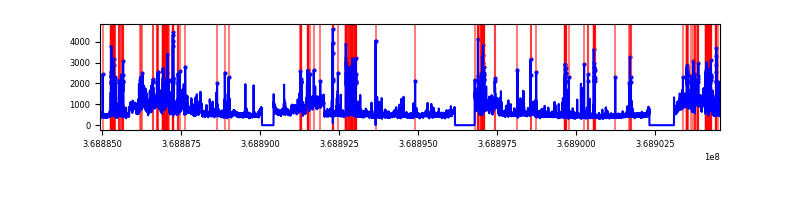 |
Top three noisy pixels from each quadrant. If the there are fewer than three noisy pixels in the level2.evt file, extra rows are filled as -1
| Pixel properties | Quadrant properties | ||||||
|---|---|---|---|---|---|---|---|
| Quadrant | DetID | PixID | Counts | Sigma | Mean | Median | Sigma |
| A | 12 | 189 | 108274 | 247.9 | 2140 | 2094 | 428.3 |
| A | 13 | 6 | 47175 | 105.25 | 2140 | 2094 | 428.3 |
| A | 13 | 254 | 31992 | 69.8 | 2140 | 2094 | 428.3 |
| B | 6 | 159 | 5053768 | 12779.2 | 2092 | 2035 | 395.3 |
| B | 5 | 172 | 820135 | 2069.52 | 2092 | 2035 | 395.3 |
| B | 0 | 190 | 385124 | 969.09 | 2092 | 2035 | 395.3 |
| C | 14 | 254 | 1337807 | 3184.71 | 1802 | 1809 | 419.5 |
| C | 14 | 238 | 1287287 | 3064.28 | 1802 | 1809 | 419.5 |
| C | 0 | 10 | 515699 | 1224.99 | 1802 | 1809 | 419.5 |
| D | 8 | 195 | 2654746 | 5389.62 | 2059 | 2001 | 492.2 |
| D | 12 | 233 | 566047 | 1145.98 | 2059 | 2001 | 492.2 |
| D | 12 | 218 | 521544 | 1055.56 | 2059 | 2001 | 492.2 |
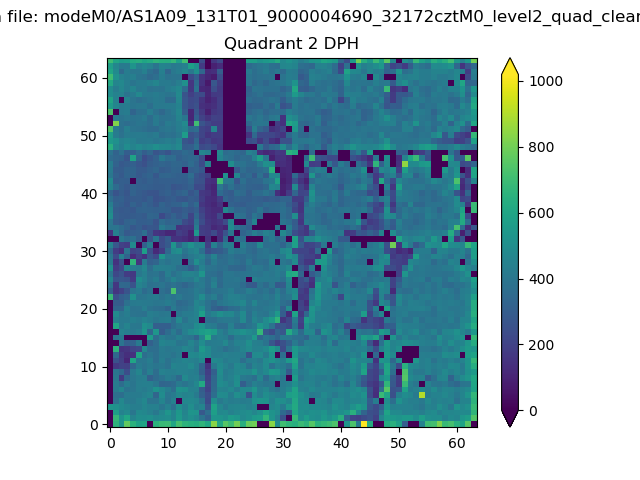
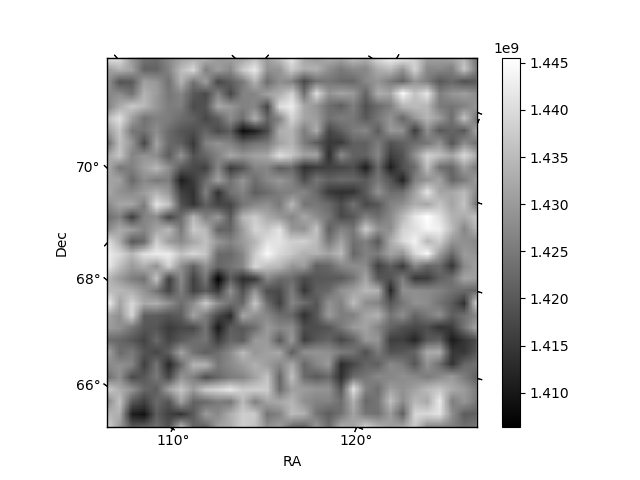
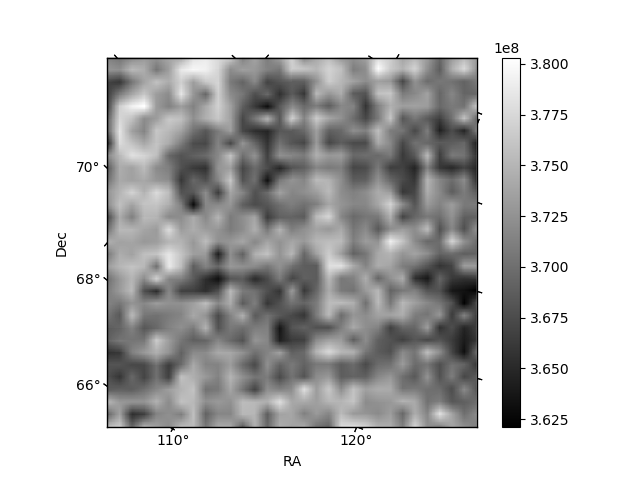
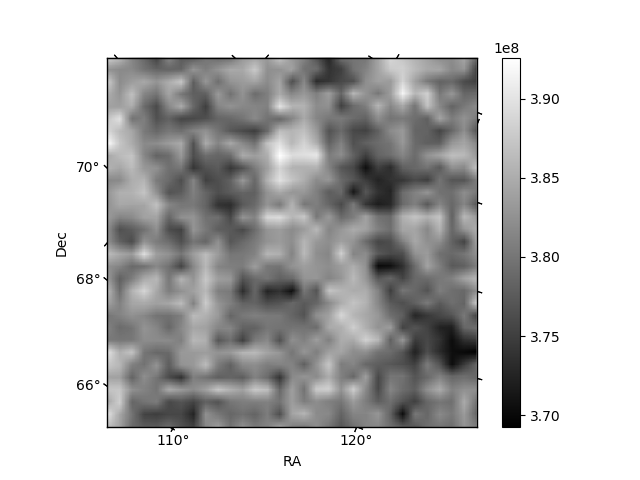
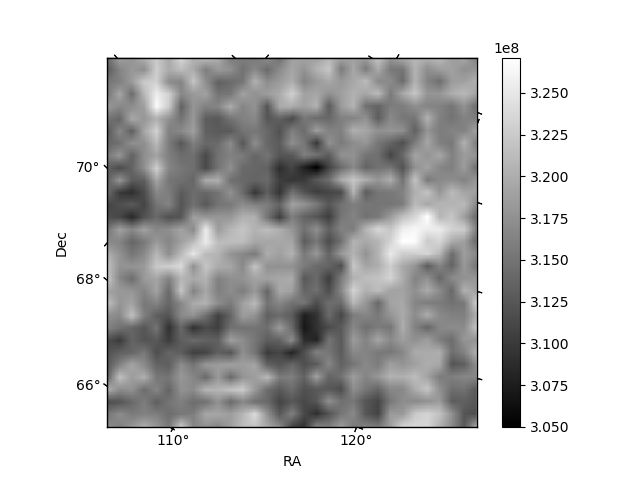
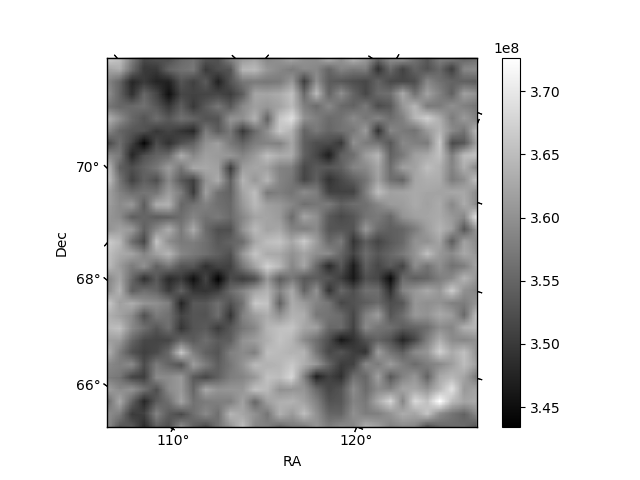
Histogram calculated using DETX and DETY for each event in the final _common_clean file
| Quadrant A | 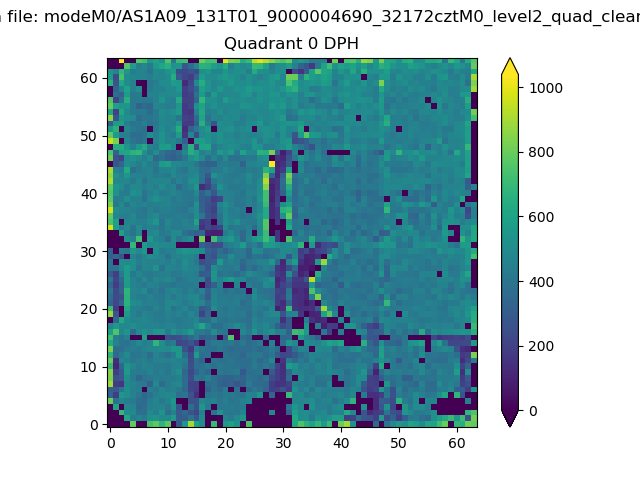 |
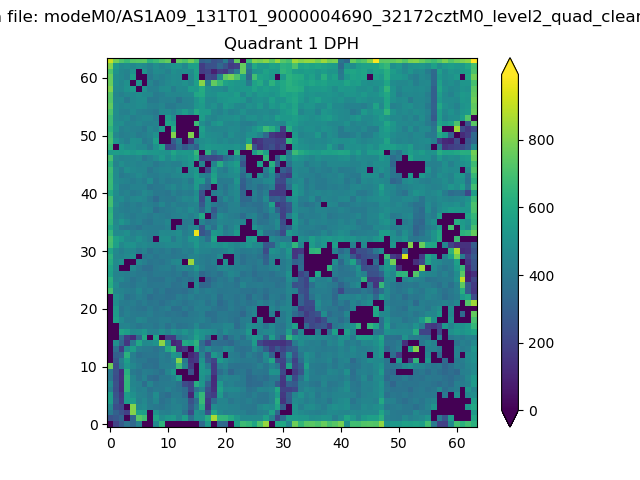 |
Quadrant B |
|---|---|---|---|
| Quadrant D | 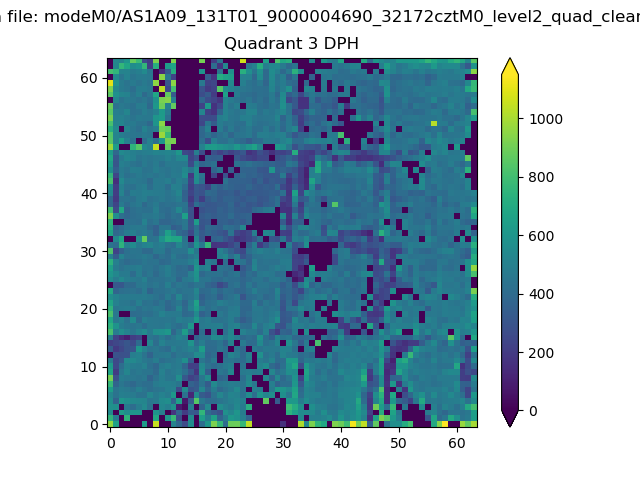 |
 |
Quadrant C |
| Plot type | Count rate plots | Images |
|---|---|---|
| Comparison with Poisson distribution Blue bars denote a histogram of data divided into 1 sec bins. Red curve is a Poisson curve with rate = median count rate of data. |
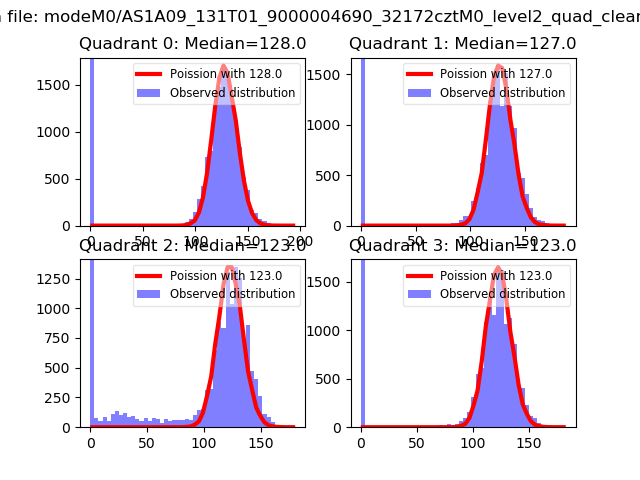 |
 |
| Quadrant-wise count rates Data is divided into 100 sec bins |
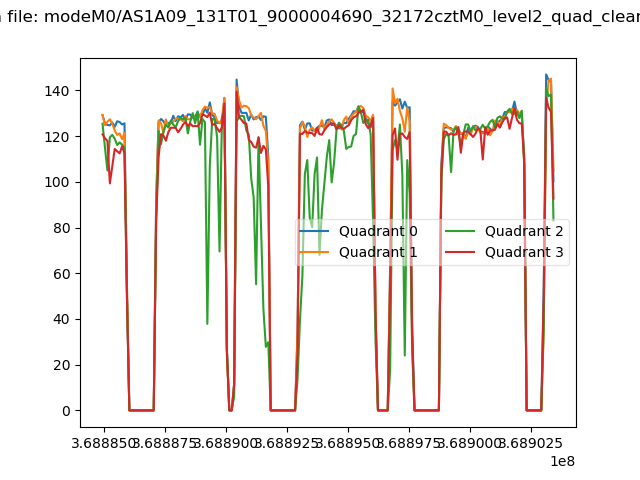 |
|
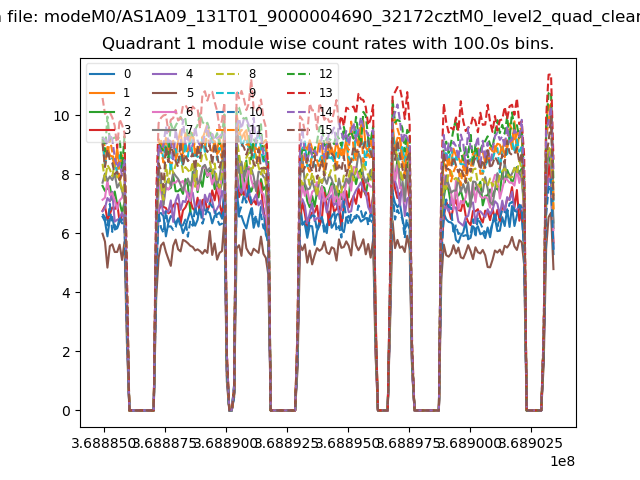
| Module-wise count rates for Quadrant A Data is divided into 100 sec bins |
 |
 |
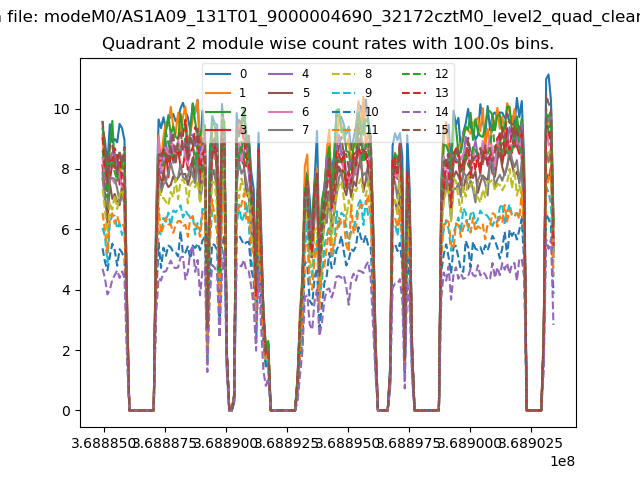
| Module-wise count rates for Quadrant B Data is divided into 100 sec bins |
 |
 |
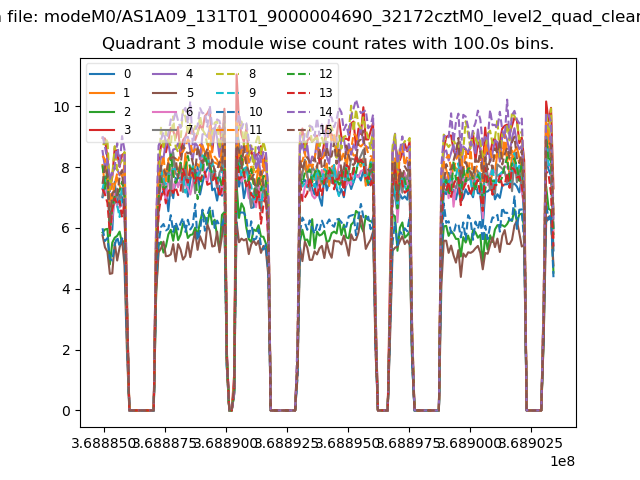
| Module-wise count rates for Quadrant C Data is divided into 100 sec bins |
 |
 |
| Module-wise count rates for Quadrant D Data is divided into 100 sec bins |
 |
 |
| Parameter | Plot |
|---|---|
| CZT HV Monitor | 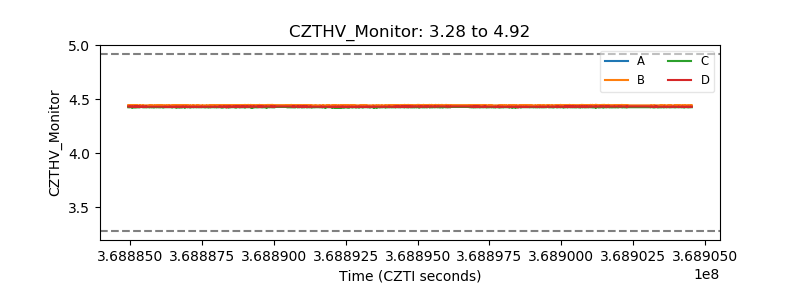 |
| D_VDD | 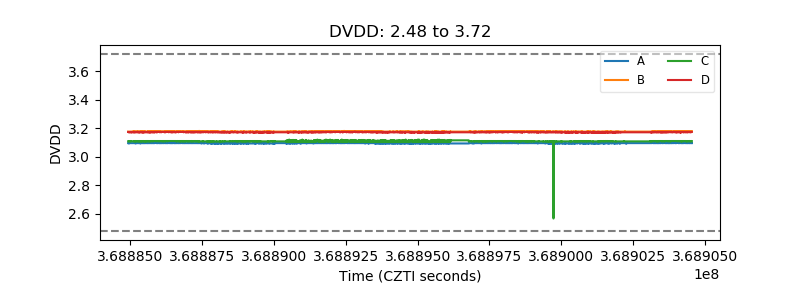 |
| Temperature 1 | 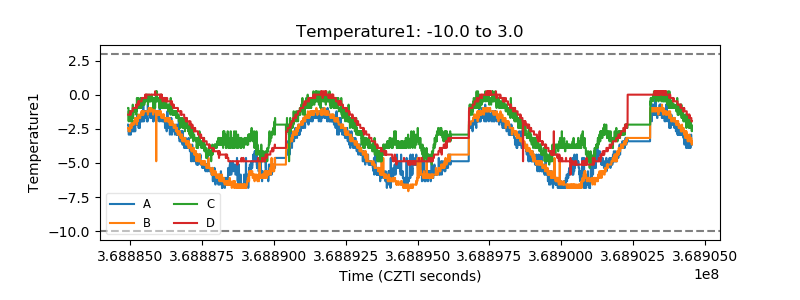 |
| Veto HV Monitor | 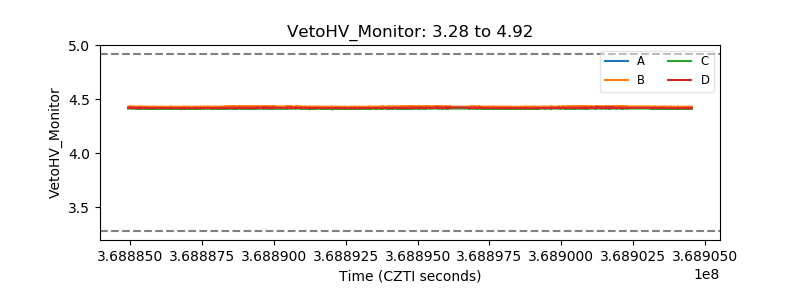 |
| Veto LLD | 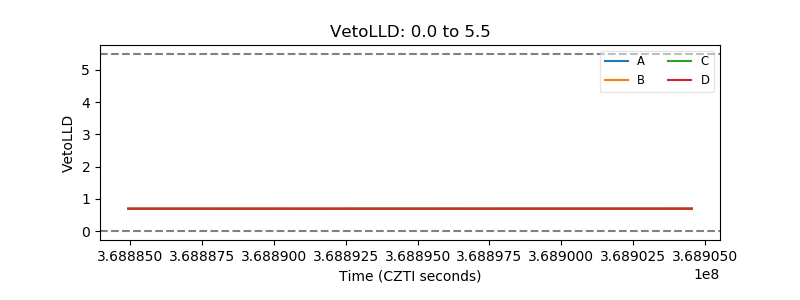 |
| Alpha Counter | 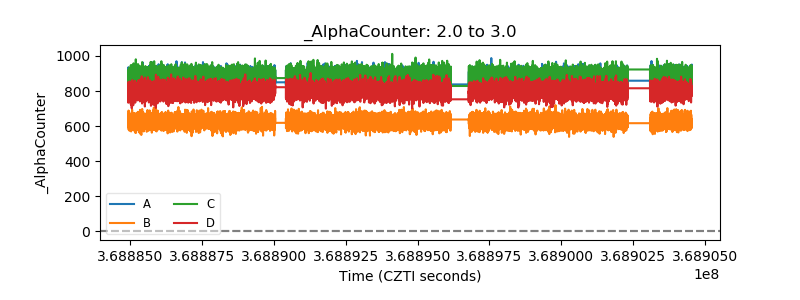 |
| _CPM_Rate | 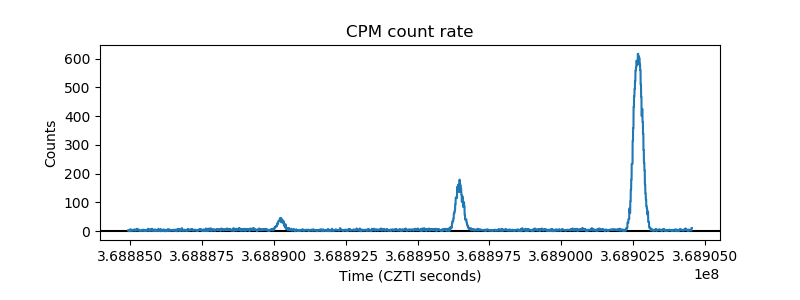 |
| CZT Counter | 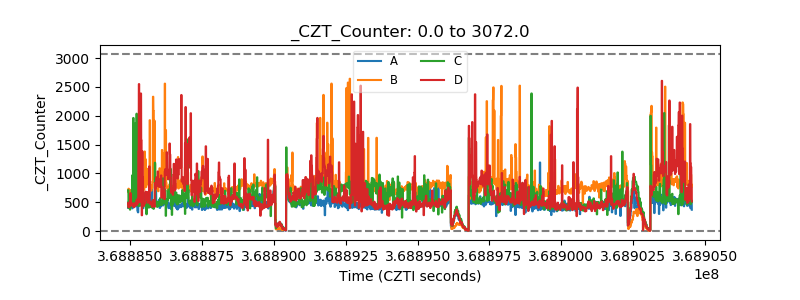 |
| +2.5 Volts monitor |  |
| +5 Volts monitor |  |
| _ROLL_ROT |  |
| _Roll_DEC | 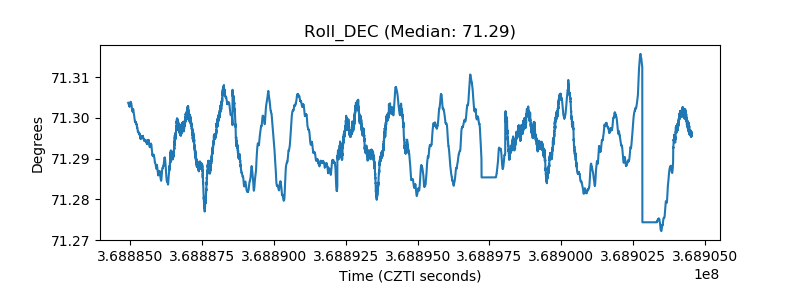 |
| _Roll_RA | 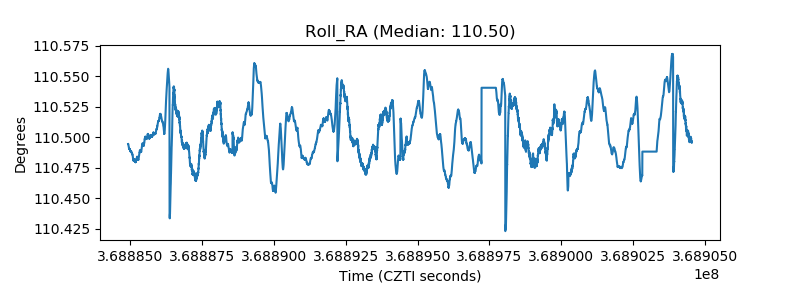 |
| Veto Counter |  |