| Param | Original file | Final file |
|---|---|---|
| Filename | modeM0/AS1A09_131T01_9000004690_32175cztM0_level2.evt | modeM0/AS1A09_131T01_9000004690_32175cztM0_level2_quad_clean.evt |
| Size (bytes) | 574,649,280 | 94,550,400 |
| Size | 548.0 MB | 90.2 MB |
| Events in quadrant A | 3,044,094 | 613,803 |
| Events in quadrant B | 5,227,195 | 615,251 |
| Events in quadrant C | 3,530,079 | 609,370 |
| Events in quadrant D | 5,185,329 | 594,990 |
| Mode SS | |||
|---|---|---|---|
| Quadrant | BADHDUFLAG | Total packets | Discarded packets |
| A | 0 | 126 | 0 |
| B | 0 | 126 | 0 |
| C | 0 | 126 | 0 |
| D | 0 | 126 | 0 |
| Mode M0 | |||
|---|---|---|---|
| Quadrant | BADHDUFLAG | Total packets | Discarded packets |
| A | 0 | 13202 | 2 |
| B | 0 | 20231 | 1 |
| C | 0 | 14615 | 1 |
| D | 0 | 19590 | 1 |
| Mode M9 | |||
|---|---|---|---|
| Quadrant | BADHDUFLAG | Total packets | Discarded packets |
| A | 0 | 11 | 0 |
| B | 0 | 11 | 0 |
| C | 0 | 11 | 0 |
| D | 0 | 11 | 0 |
| Quadrant | Total seconds | Saturated seconds | Saturation percentage |
|---|---|---|---|
| A | 6155 | 31 | 0.503656% |
| B | 6155 | 240 | 3.899269% |
| C | 6155 | 359 | 5.832656% |
| D | 6155 | 177 | 2.875711% |
Noise dominated data is calculated using 1-second bins in cleaned event files. If a bin has >2000 counts, and if more than 50% of those come from <1% of pixels, then it is considered to be noise-dominated and hence unusable.
| Quadrant | # 1 sec bins | Bins with >0 counts | Bins with >2000 counts | High rate bins dominated by noise | Noise dominated (total time) | Noise dominated (detector-on time) | Marked lightcurve |
|---|---|---|---|---|---|---|---|
| A | 7270 | 6156 | 0 | 0 | 0.00% | 0.00% | 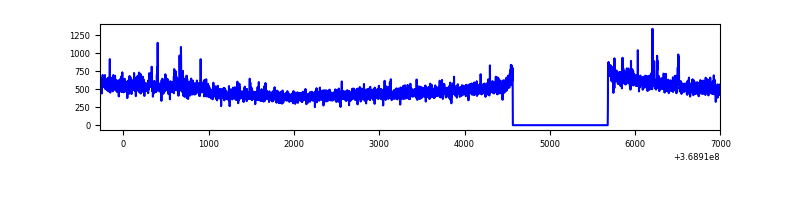 |
| B | 7270 | 6156 | 102 | 102 | 1.40% | 1.66% | 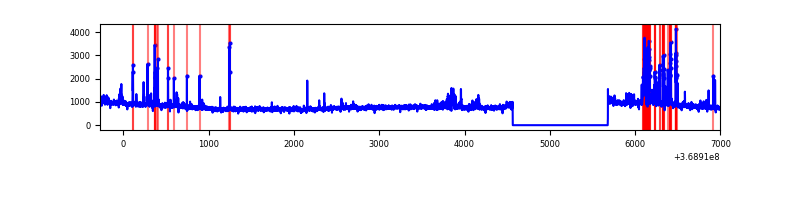 |
| C | 7270 | 6156 | 99 | 99 | 1.36% | 1.61% | 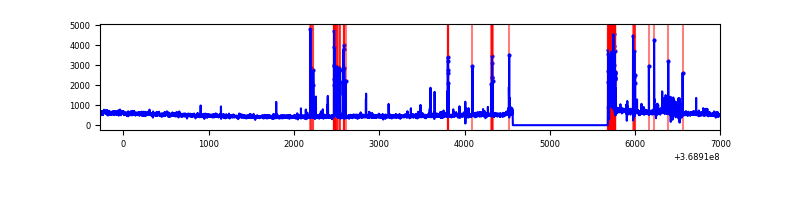 |
| D | 7270 | 6156 | 90 | 90 | 1.24% | 1.46% | 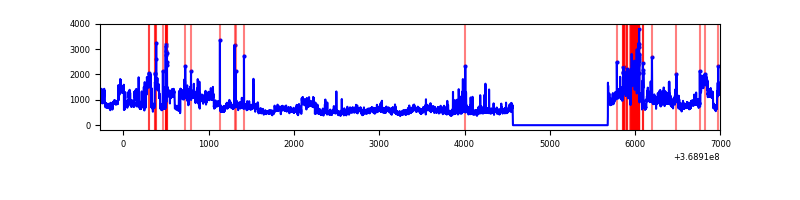 |
Top three noisy pixels from each quadrant. If the there are fewer than three noisy pixels in the level2.evt file, extra rows are filled as -1
| Pixel properties | Quadrant properties | ||||||
|---|---|---|---|---|---|---|---|
| Quadrant | DetID | PixID | Counts | Sigma | Mean | Median | Sigma |
| A | 12 | 189 | 64369 | 417.75 | 761 | 746 | 152.3 |
| A | 13 | 6 | 37987 | 244.53 | 761 | 746 | 152.3 |
| A | 13 | 254 | 11396 | 69.93 | 761 | 746 | 152.3 |
| B | 6 | 159 | 1801250 | 12794.07 | 751 | 732 | 140.7 |
| B | 5 | 172 | 336323 | 2384.63 | 751 | 732 | 140.7 |
| B | 0 | 190 | 117682 | 831.02 | 751 | 732 | 140.7 |
| C | 0 | 10 | 412151 | 2461.55 | 724 | 728 | 167.1 |
| C | 14 | 238 | 152562 | 908.42 | 724 | 728 | 167.1 |
| C | 14 | 254 | 49044 | 289.07 | 724 | 728 | 167.1 |
| D | 8 | 195 | 1994092 | 11182.31 | 742 | 722 | 178.3 |
| D | 12 | 218 | 93267 | 519.15 | 742 | 722 | 178.3 |
| D | 1 | 52 | 91990 | 511.99 | 742 | 722 | 178.3 |
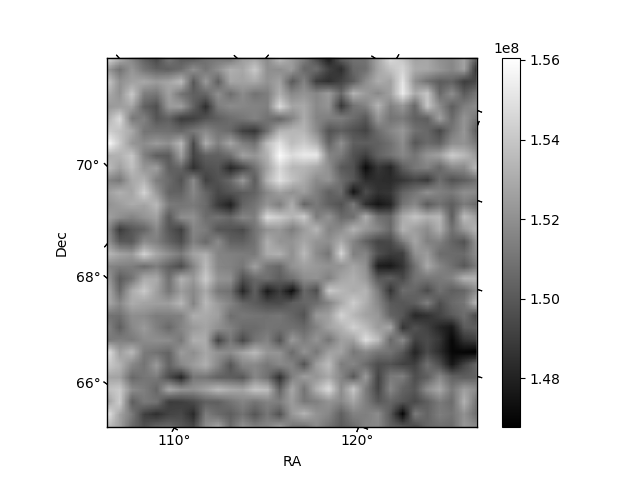
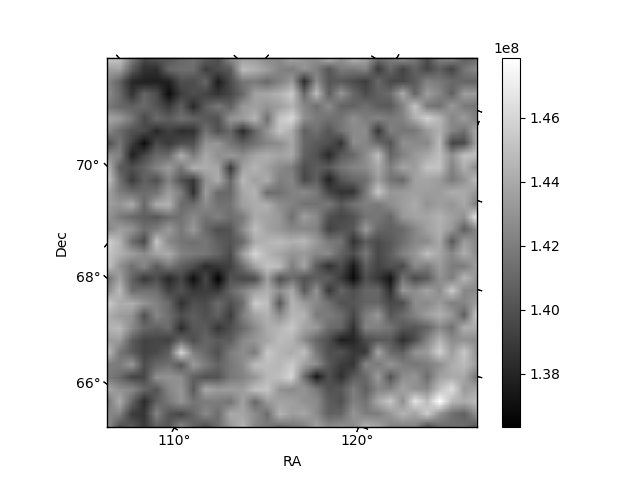
Histogram calculated using DETX and DETY for each event in the final _common_clean file
| Quadrant A | 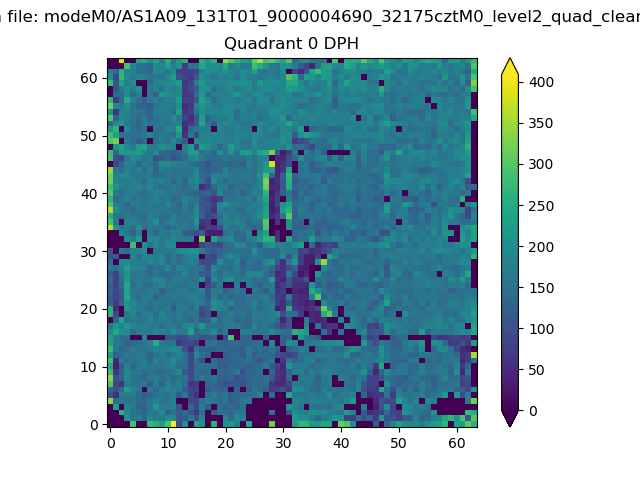 |
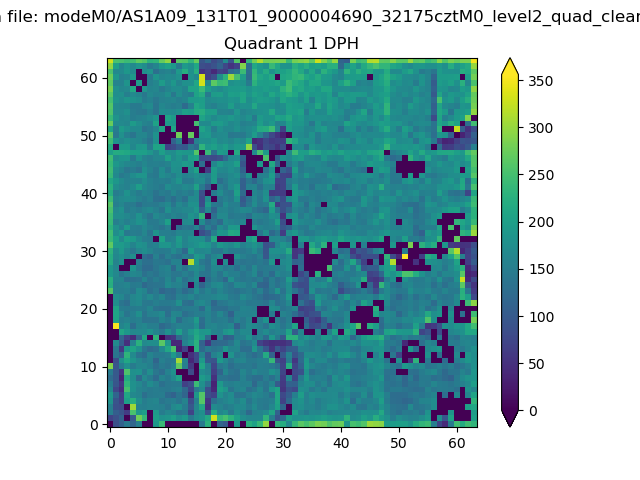 |
Quadrant B |
|---|---|---|---|
| Quadrant D | 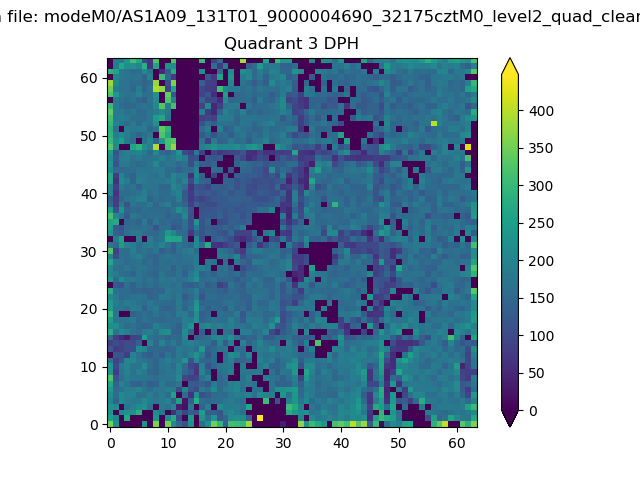 |
 |
Quadrant C |
| Plot type | Count rate plots | Images |
|---|---|---|
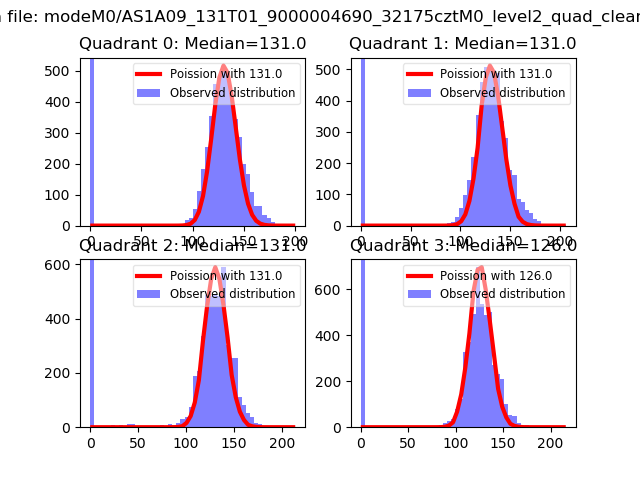
| Comparison with Poisson distribution Blue bars denote a histogram of data divided into 1 sec bins. Red curve is a Poisson curve with rate = median count rate of data. |
 |
 |
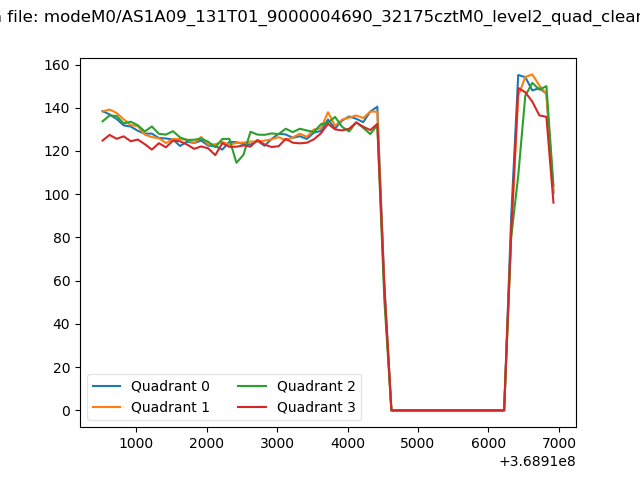
| Quadrant-wise count rates Data is divided into 100 sec bins |
 |
|
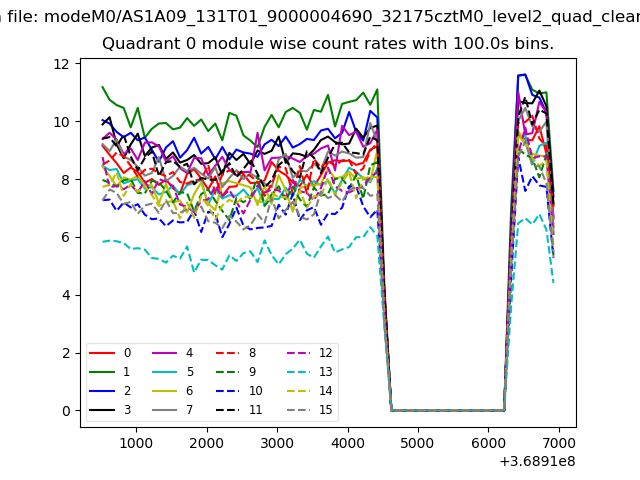
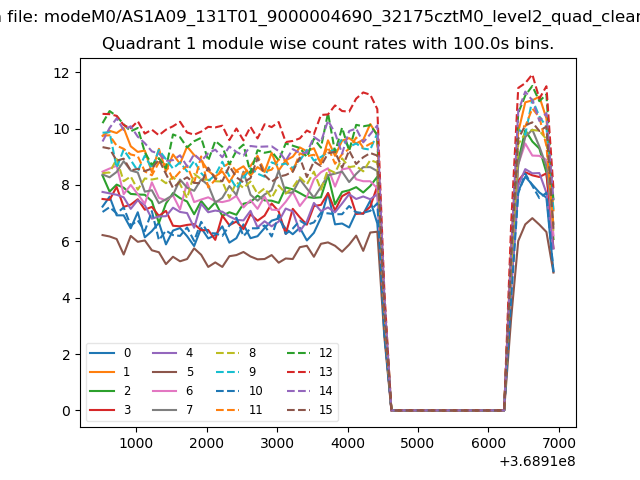
| Module-wise count rates for Quadrant A Data is divided into 100 sec bins |
 |
 |
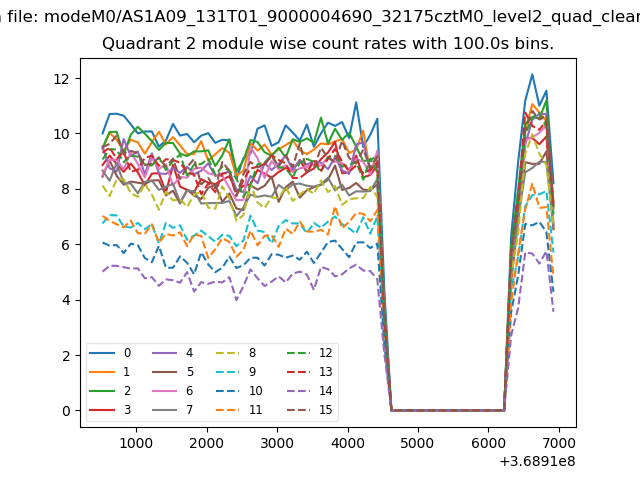
| Module-wise count rates for Quadrant B Data is divided into 100 sec bins |
 |
 |
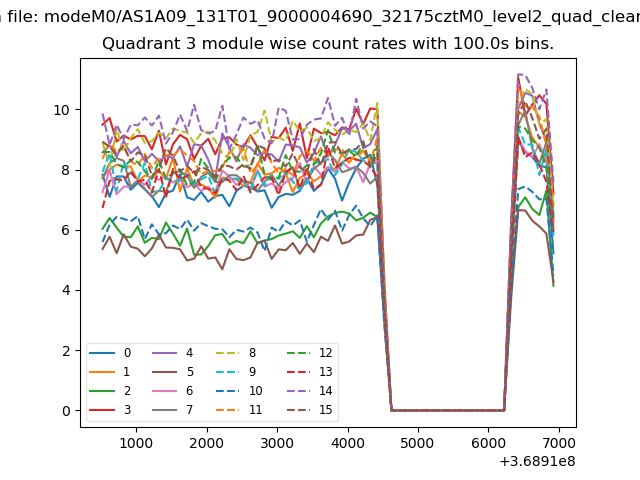
| Module-wise count rates for Quadrant C Data is divided into 100 sec bins |
 |
 |
| Module-wise count rates for Quadrant D Data is divided into 100 sec bins |
 |
 |
| Parameter | Plot |
|---|---|
| CZT HV Monitor | 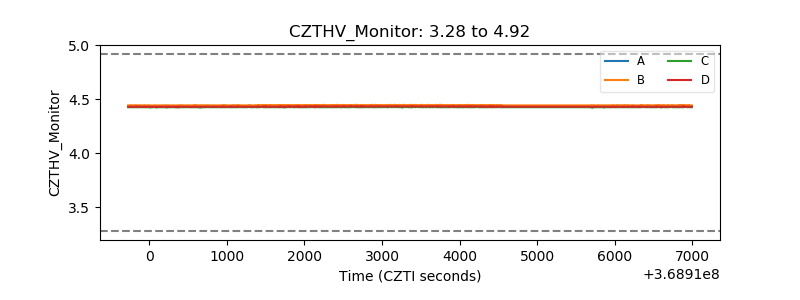 |
| D_VDD | 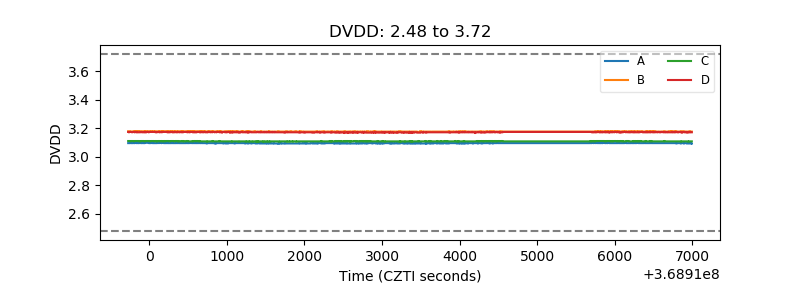 |
| Temperature 1 | 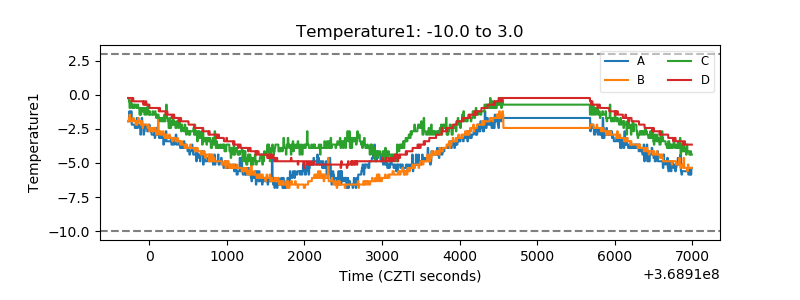 |
| Veto HV Monitor | 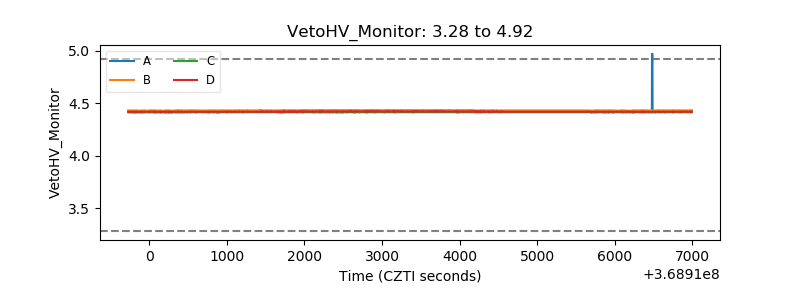 |
| Veto LLD | 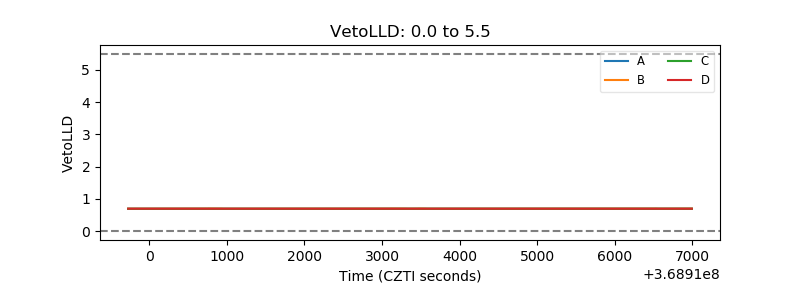 |
| Alpha Counter |  |
| _CPM_Rate | 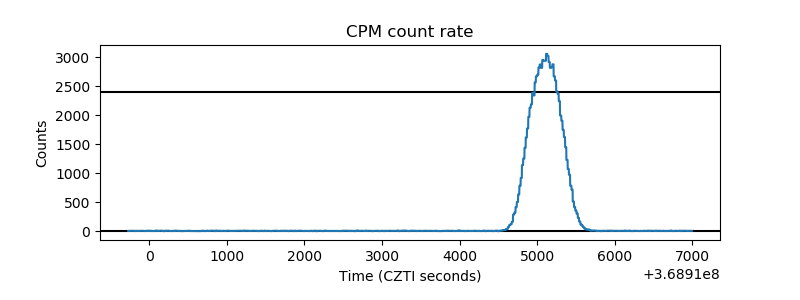 |
| CZT Counter |  |
| +2.5 Volts monitor | 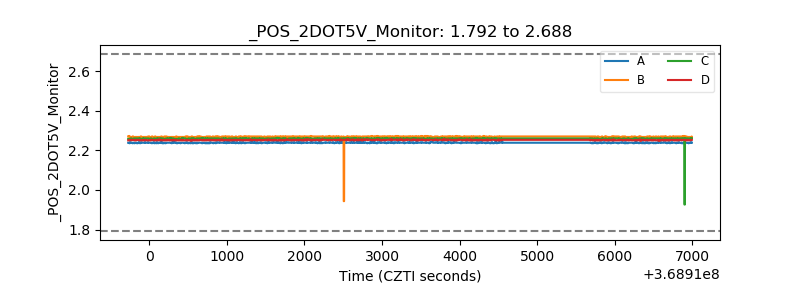 |
| +5 Volts monitor |  |
| _ROLL_ROT | 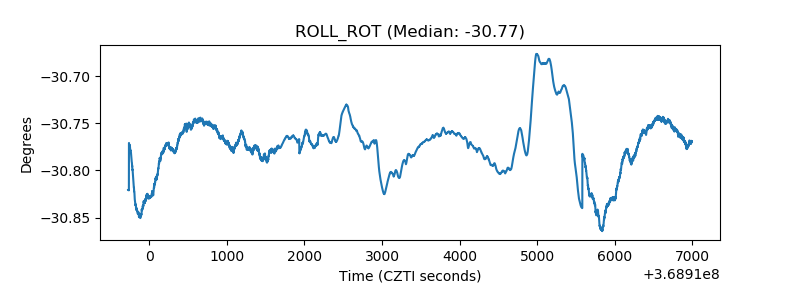 |
| _Roll_DEC | 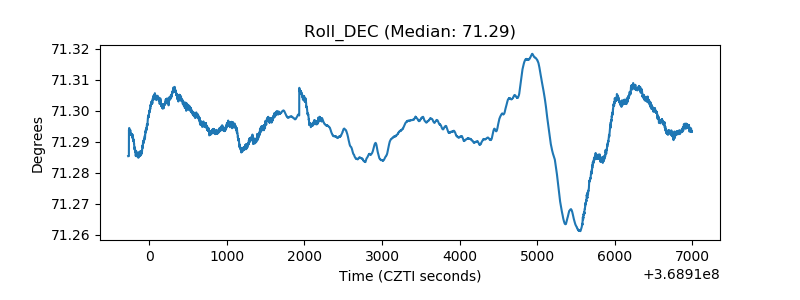 |
| _Roll_RA | 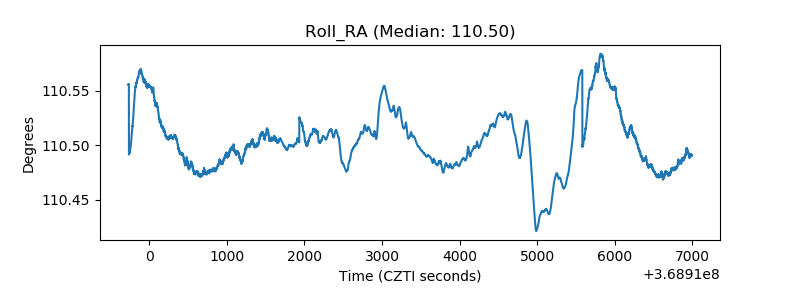 |
| Veto Counter | 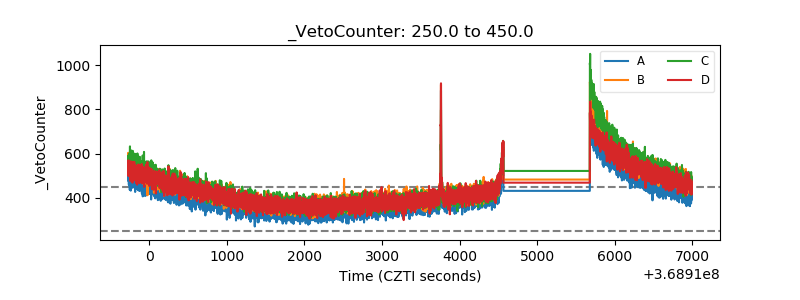 |