| Param | Original file | Final file |
|---|---|---|
| Filename | modeM0/AS1A09_131T01_9000004690_32176cztM0_level2.evt | modeM0/AS1A09_131T01_9000004690_32176cztM0_level2_quad_clean.evt |
| Size (bytes) | 612,544,320 | 113,388,480 |
| Size | 584.2 MB | 108.1 MB |
| Events in quadrant A | 3,196,044 | 754,651 |
| Events in quadrant B | 5,390,810 | 762,874 |
| Events in quadrant C | 3,694,477 | 757,556 |
| Events in quadrant D | 5,844,732 | 720,173 |
| Mode SS | |||
|---|---|---|---|
| Quadrant | BADHDUFLAG | Total packets | Discarded packets |
| A | 0 | 126 | 0 |
| B | 0 | 126 | 0 |
| C | 0 | 126 | 0 |
| D | 0 | 126 | 0 |
| Mode M0 | |||
|---|---|---|---|
| Quadrant | BADHDUFLAG | Total packets | Discarded packets |
| A | 0 | 13737 | 3 |
| B | 0 | 20623 | 2 |
| C | 0 | 15092 | 2 |
| D | 0 | 21732 | 2 |
| Mode M9 | |||
|---|---|---|---|
| Quadrant | BADHDUFLAG | Total packets | Discarded packets |
| A | 0 | 15 | 0 |
| B | 0 | 15 | 0 |
| C | 0 | 15 | 0 |
| D | 0 | 16 | 0 |
| Quadrant | Total seconds | Saturated seconds | Saturation percentage |
|---|---|---|---|
| A | 6295 | 20 | 0.317712% |
| B | 6295 | 258 | 4.098491% |
| C | 6295 | 355 | 5.639396% |
| D | 6295 | 280 | 4.447975% |
Noise dominated data is calculated using 1-second bins in cleaned event files. If a bin has >2000 counts, and if more than 50% of those come from <1% of pixels, then it is considered to be noise-dominated and hence unusable.
| Quadrant | # 1 sec bins | Bins with >0 counts | Bins with >2000 counts | High rate bins dominated by noise | Noise dominated (total time) | Noise dominated (detector-on time) | Marked lightcurve |
|---|---|---|---|---|---|---|---|
| A | 7545 | 6296 | 0 | 0 | 0.00% | 0.00% | 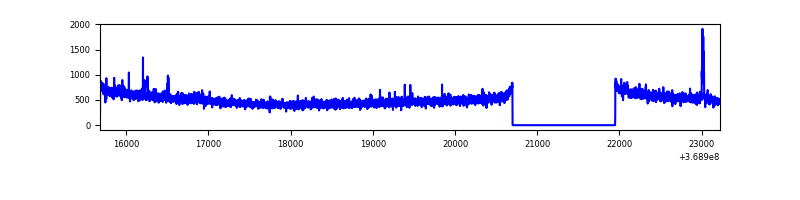 |
| B | 7545 | 6296 | 97 | 97 | 1.29% | 1.54% | 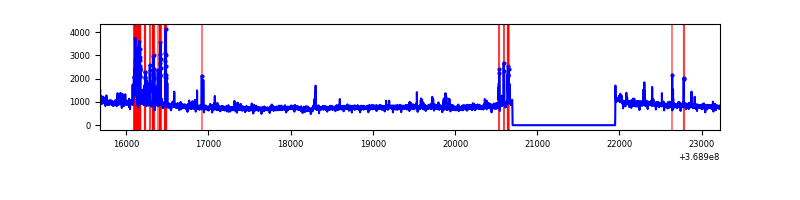 |
| C | 7545 | 6296 | 83 | 83 | 1.10% | 1.32% | 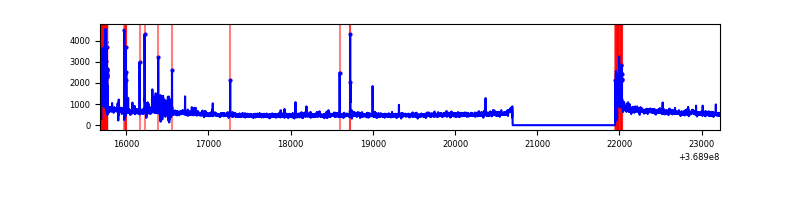 |
| D | 7545 | 6296 | 170 | 170 | 2.25% | 2.70% | 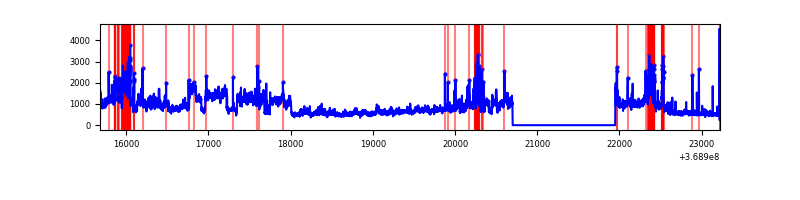 |
Top three noisy pixels from each quadrant. If the there are fewer than three noisy pixels in the level2.evt file, extra rows are filled as -1
| Pixel properties | Quadrant properties | ||||||
|---|---|---|---|---|---|---|---|
| Quadrant | DetID | PixID | Counts | Sigma | Mean | Median | Sigma |
| A | 12 | 189 | 54346 | 332.29 | 809 | 794 | 161.2 |
| A | 13 | 6 | 19895 | 118.52 | 809 | 794 | 161.2 |
| A | 13 | 254 | 12195 | 70.74 | 809 | 794 | 161.2 |
| B | 6 | 159 | 1786680 | 12089.51 | 801 | 783 | 147.7 |
| B | 5 | 172 | 332249 | 2243.84 | 801 | 783 | 147.7 |
| B | 0 | 190 | 70265 | 470.35 | 801 | 783 | 147.7 |
| C | 0 | 10 | 349181 | 1973.27 | 770 | 777 | 176.6 |
| C | 14 | 238 | 156778 | 883.55 | 770 | 777 | 176.6 |
| C | 3 | 233 | 101060 | 567.98 | 770 | 777 | 176.6 |
| D | 8 | 195 | 2280371 | 12285.73 | 784 | 763 | 185.5 |
| D | 12 | 218 | 208221 | 1118.08 | 784 | 763 | 185.5 |
| D | 14 | 52 | 114249 | 611.62 | 784 | 763 | 185.5 |
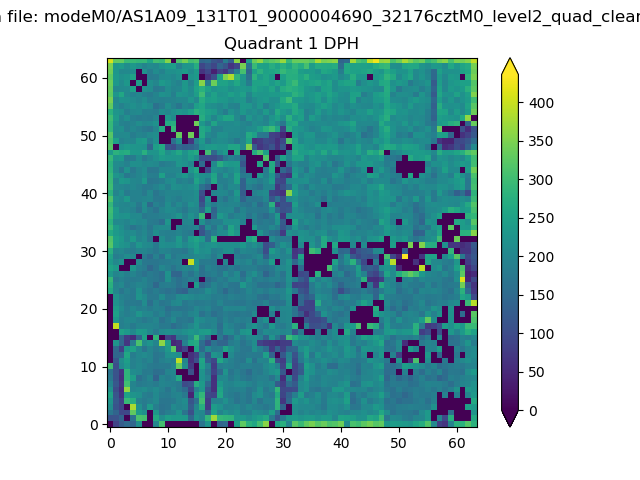
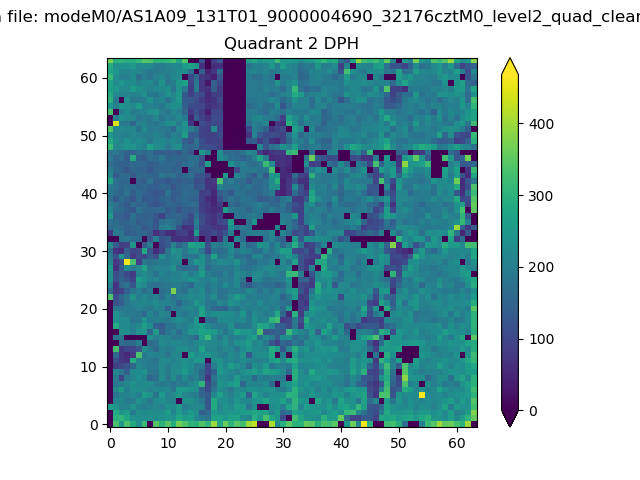
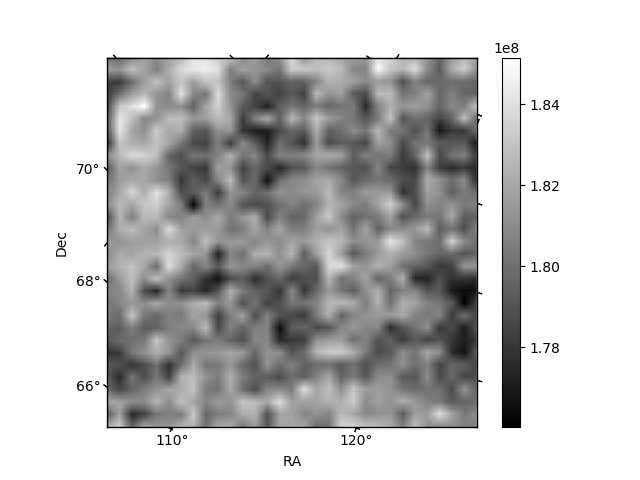
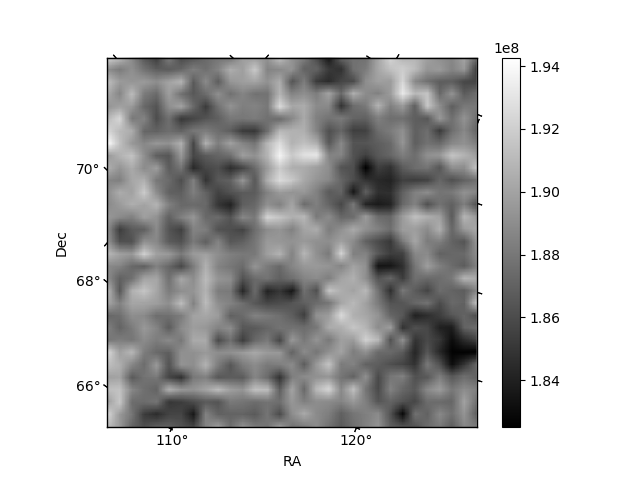
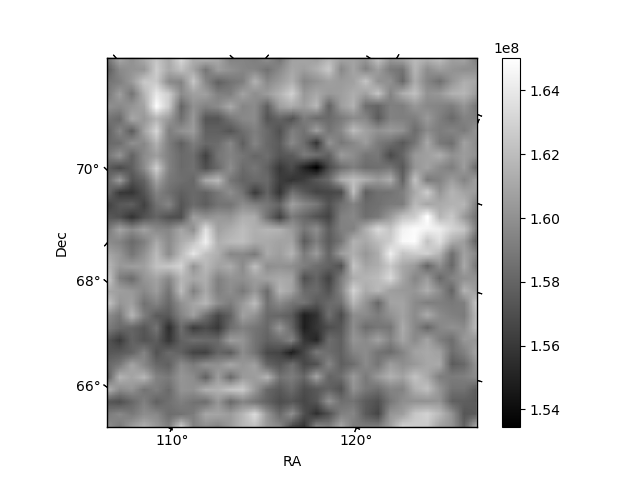
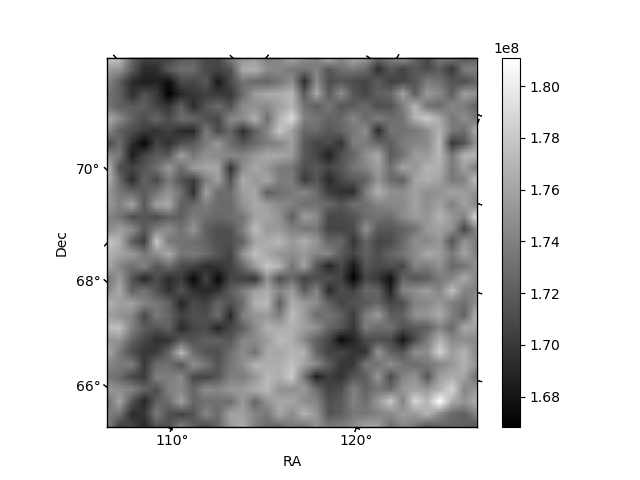
Histogram calculated using DETX and DETY for each event in the final _common_clean file
| Quadrant A |  |
 |
Quadrant B |
|---|---|---|---|
| Quadrant D |  |
 |
Quadrant C |
| Plot type | Count rate plots | Images |
|---|---|---|
| Comparison with Poisson distribution Blue bars denote a histogram of data divided into 1 sec bins. Red curve is a Poisson curve with rate = median count rate of data. |
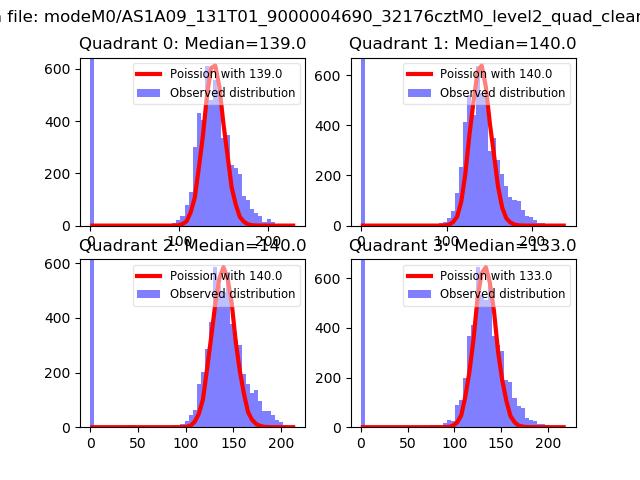 |
 |
| Quadrant-wise count rates Data is divided into 100 sec bins |
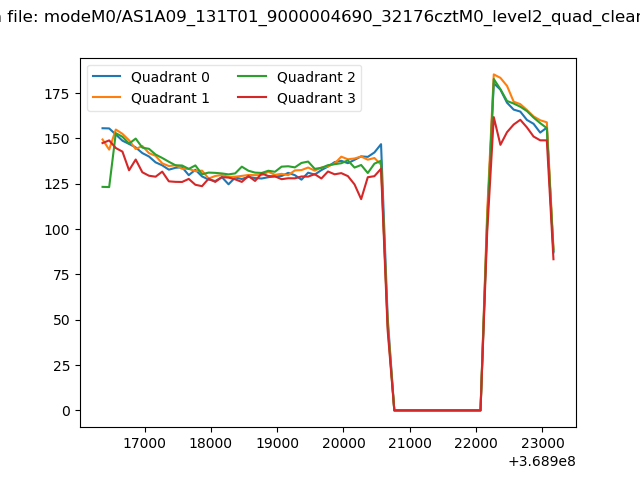 |
|
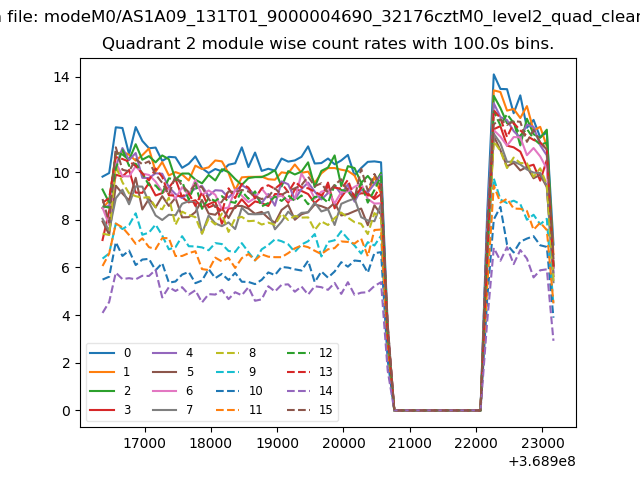
| Module-wise count rates for Quadrant A Data is divided into 100 sec bins |
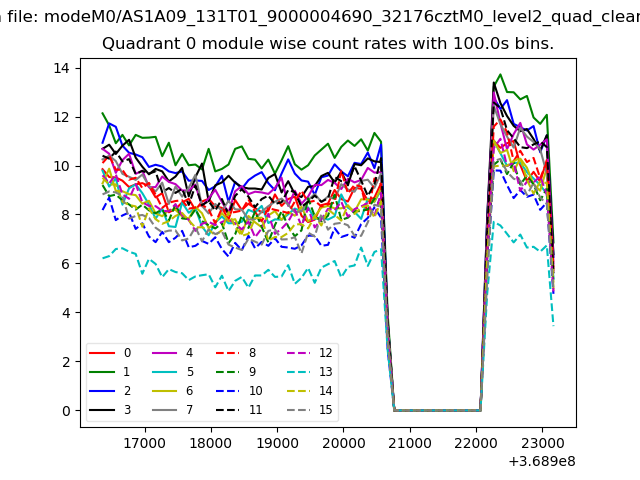 |
 |
| Module-wise count rates for Quadrant B Data is divided into 100 sec bins |
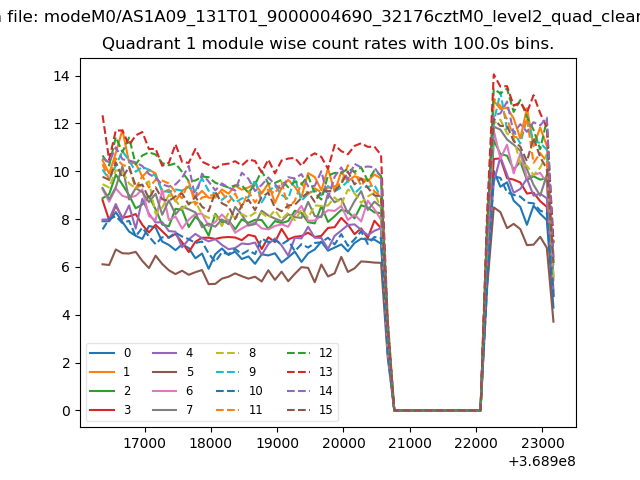 |
 |
| Module-wise count rates for Quadrant C Data is divided into 100 sec bins |
 |
 |
| Module-wise count rates for Quadrant D Data is divided into 100 sec bins |
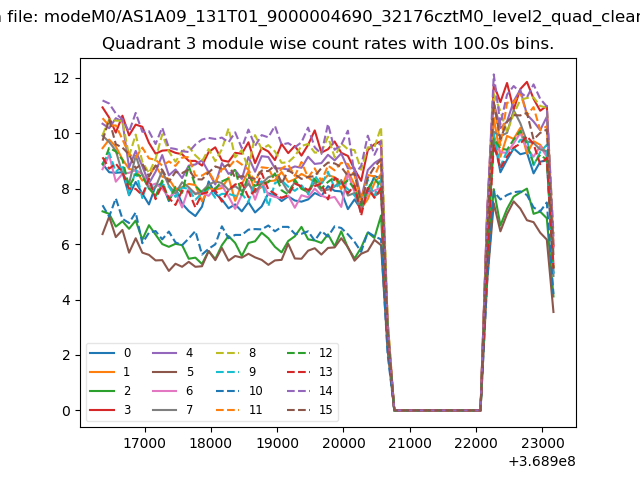 |
 |
| Parameter | Plot |
|---|---|
| CZT HV Monitor | 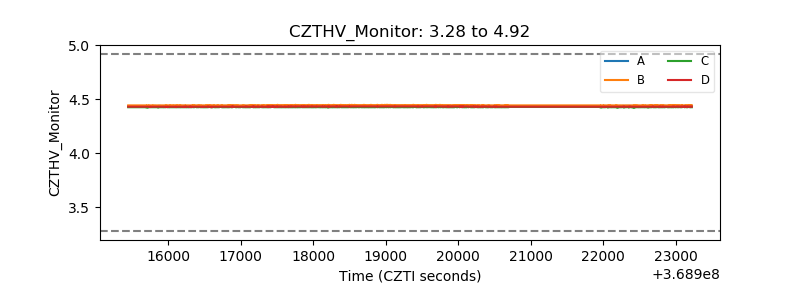 |
| D_VDD | 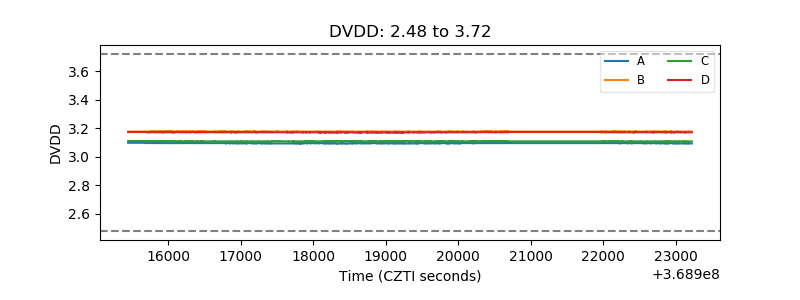 |
| Temperature 1 | 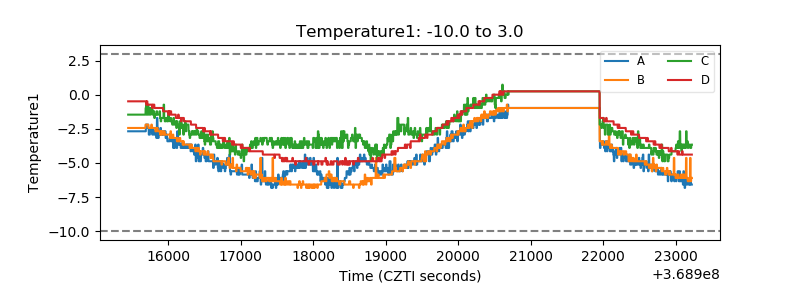 |
| Veto HV Monitor | 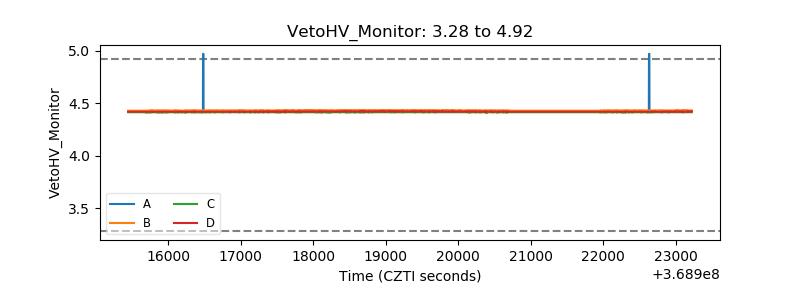 |
| Veto LLD | 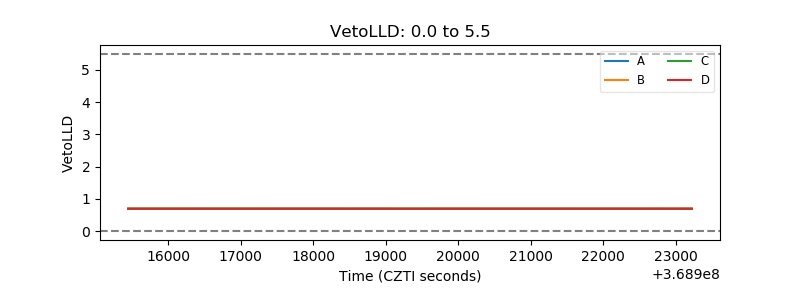 |
| Alpha Counter | 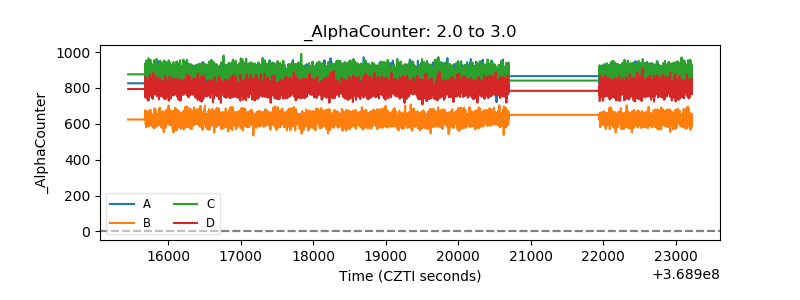 |
| _CPM_Rate | 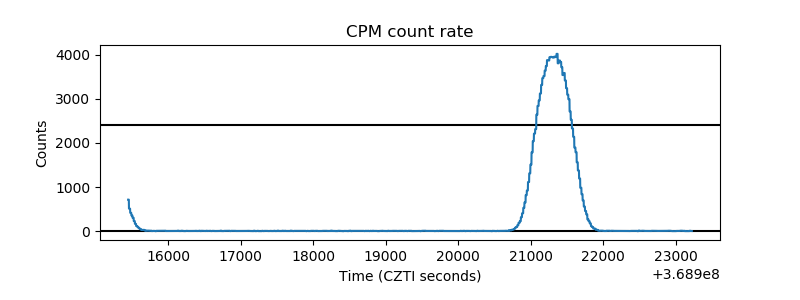 |
| CZT Counter | 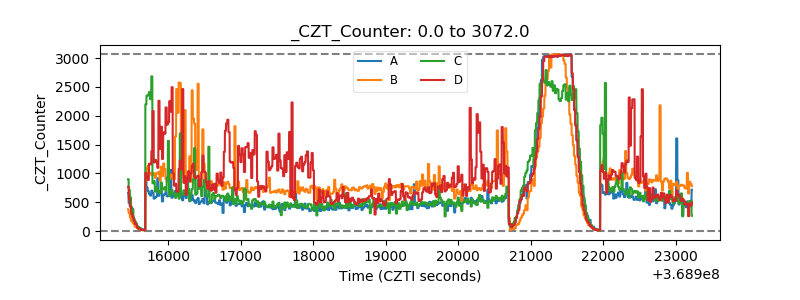 |
| +2.5 Volts monitor |  |
| +5 Volts monitor | 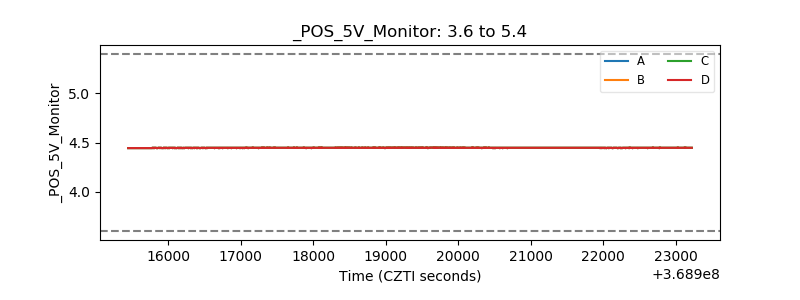 |
| _ROLL_ROT | 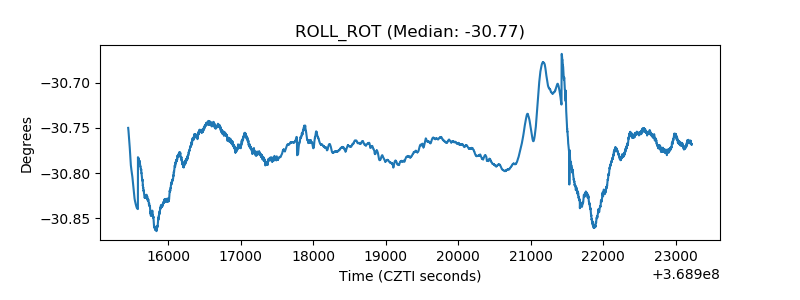 |
| _Roll_DEC | 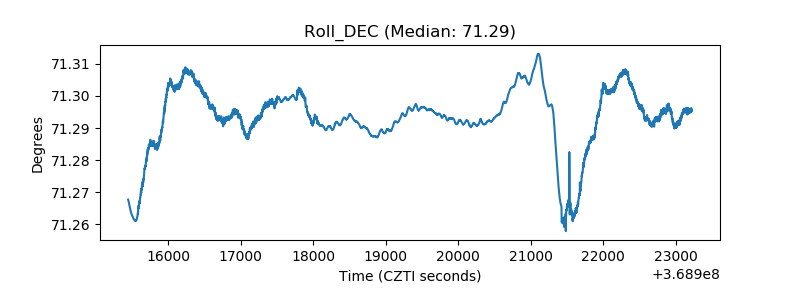 |
| _Roll_RA | 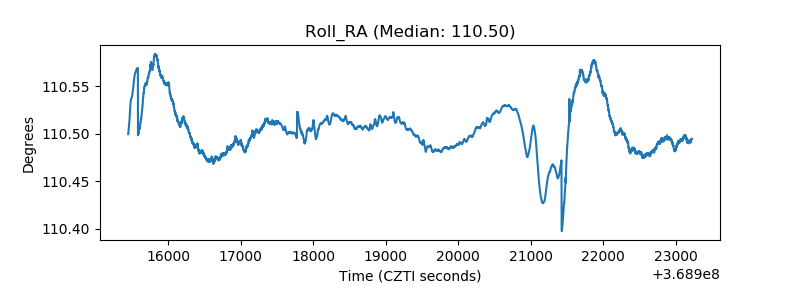 |
| Veto Counter | 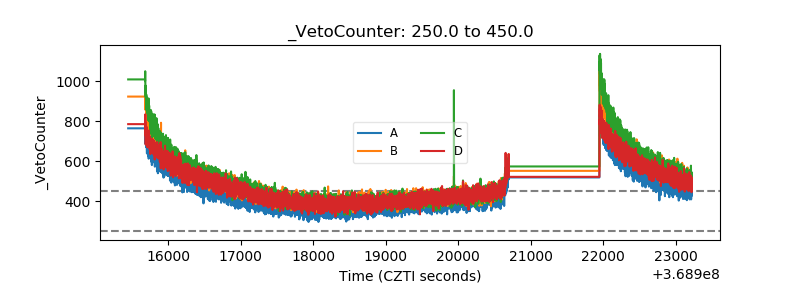 |