| Param | Original file | Final file |
|---|---|---|
| Filename | modeM0/AS1A09_131T01_9000004690_32177cztM0_level2.evt | modeM0/AS1A09_131T01_9000004690_32177cztM0_level2_quad_clean.evt |
| Size (bytes) | 578,695,680 | 132,163,200 |
| Size | 551.9 MB | 126.0 MB |
| Events in quadrant A | 3,244,974 | 904,563 |
| Events in quadrant B | 5,353,816 | 913,608 |
| Events in quadrant C | 3,621,306 | 899,468 |
| Events in quadrant D | 4,881,932 | 847,872 |
| Mode SS | |||
|---|---|---|---|
| Quadrant | BADHDUFLAG | Total packets | Discarded packets |
| A | 0 | 126 | 0 |
| B | 0 | 126 | 0 |
| C | 0 | 126 | 0 |
| D | 0 | 126 | 0 |
| Mode M0 | |||
|---|---|---|---|
| Quadrant | BADHDUFLAG | Total packets | Discarded packets |
| A | 0 | 13692 | 3 |
| B | 0 | 20251 | 2 |
| C | 0 | 14808 | 2 |
| D | 0 | 18613 | 2 |
| Mode M9 | |||
|---|---|---|---|
| Quadrant | BADHDUFLAG | Total packets | Discarded packets |
| A | 0 | 23 | 0 |
| B | 0 | 23 | 0 |
| C | 0 | 23 | 0 |
| D | 0 | 24 | 0 |
| Quadrant | Total seconds | Saturated seconds | Saturation percentage |
|---|---|---|---|
| A | 6273 | 53 | 0.844891% |
| B | 6273 | 234 | 3.730273% |
| C | 6273 | 273 | 4.351985% |
| D | 6273 | 299 | 4.766459% |
Noise dominated data is calculated using 1-second bins in cleaned event files. If a bin has >2000 counts, and if more than 50% of those come from <1% of pixels, then it is considered to be noise-dominated and hence unusable.
| Quadrant | # 1 sec bins | Bins with >0 counts | Bins with >2000 counts | High rate bins dominated by noise | Noise dominated (total time) | Noise dominated (detector-on time) | Marked lightcurve |
|---|---|---|---|---|---|---|---|
| A | 7583 | 6274 | 0 | 0 | 0.00% | 0.00% | 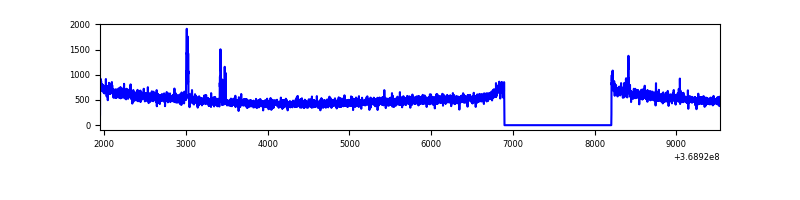 |
| B | 7583 | 6274 | 68 | 68 | 0.90% | 1.08% | 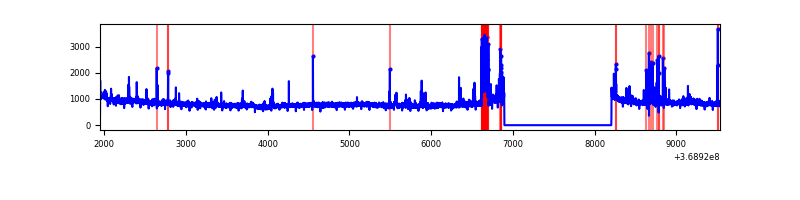 |
| C | 7583 | 6274 | 54 | 54 | 0.71% | 0.86% | 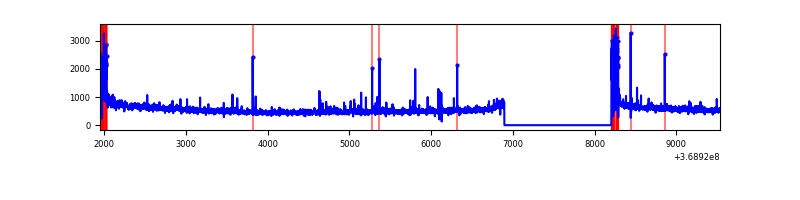 |
| D | 7583 | 6274 | 176 | 176 | 2.32% | 2.81% | 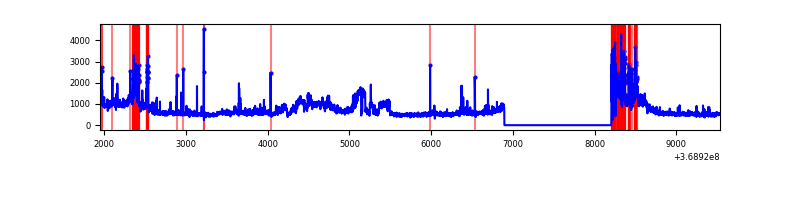 |
Top three noisy pixels from each quadrant. If the there are fewer than three noisy pixels in the level2.evt file, extra rows are filled as -1
| Pixel properties | Quadrant properties | ||||||
|---|---|---|---|---|---|---|---|
| Quadrant | DetID | PixID | Counts | Sigma | Mean | Median | Sigma |
| A | 12 | 189 | 45079 | 273.49 | 821 | 807 | 161.9 |
| A | 15 | 174 | 18100 | 106.83 | 821 | 807 | 161.9 |
| A | 13 | 254 | 14285 | 83.26 | 821 | 807 | 161.9 |
| B | 6 | 159 | 1763244 | 11946.19 | 814 | 797 | 147.5 |
| B | 5 | 172 | 211213 | 1426.24 | 814 | 797 | 147.5 |
| B | 0 | 190 | 61233 | 409.65 | 814 | 797 | 147.5 |
| C | 0 | 10 | 287010 | 1576.09 | 792 | 798 | 181.6 |
| C | 14 | 238 | 147108 | 805.69 | 792 | 798 | 181.6 |
| C | 3 | 233 | 35778 | 192.63 | 792 | 798 | 181.6 |
| D | 8 | 195 | 1359280 | 7303.1 | 786 | 767 | 186.0 |
| D | 12 | 218 | 397003 | 2130.09 | 786 | 767 | 186.0 |
| D | 2 | 250 | 55923 | 296.51 | 786 | 767 | 186.0 |
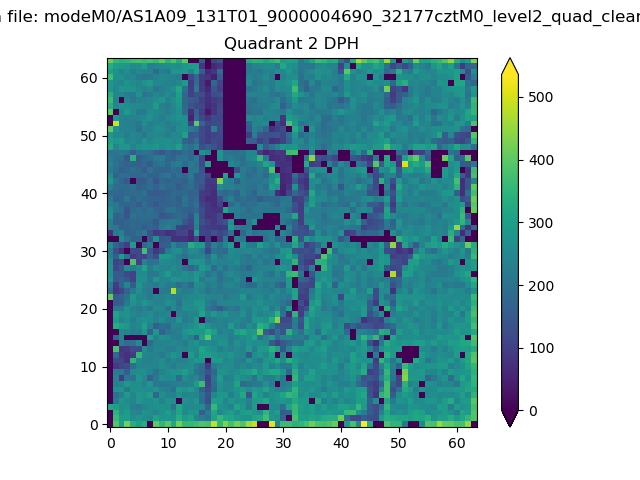
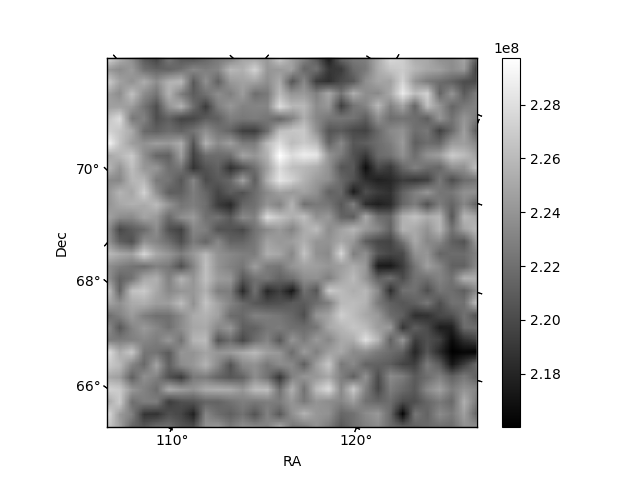
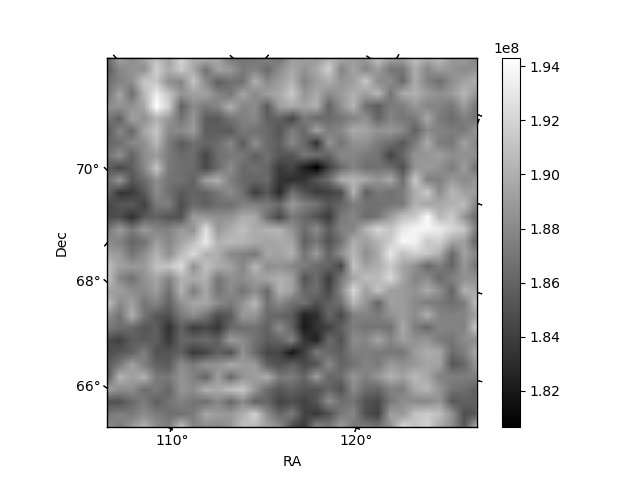
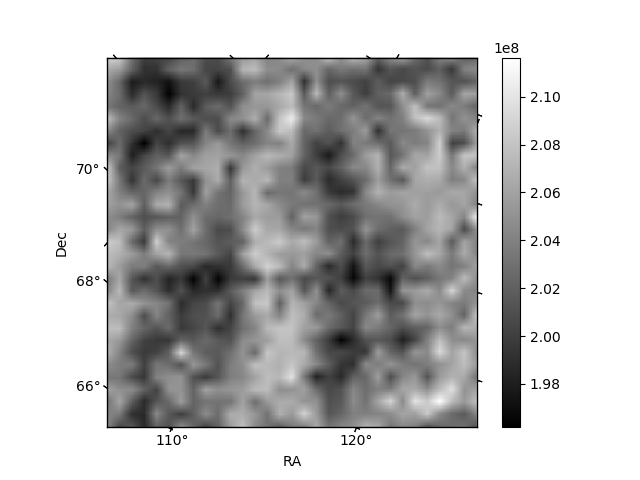
Histogram calculated using DETX and DETY for each event in the final _common_clean file
| Quadrant A | 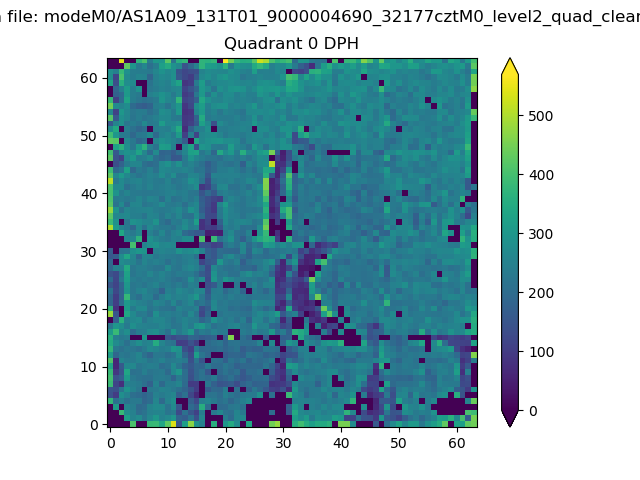 |
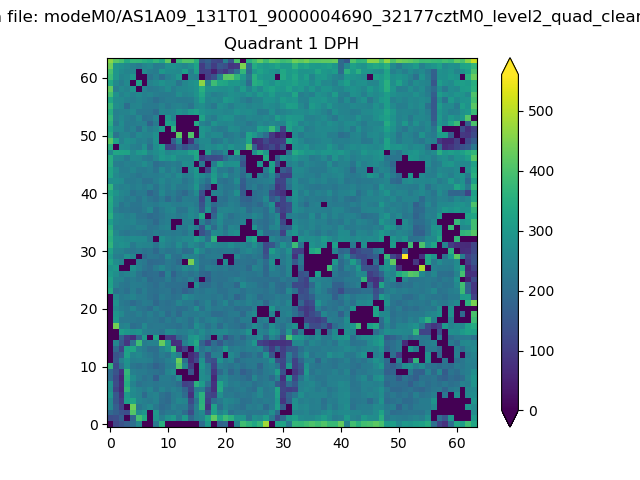 |
Quadrant B |
|---|---|---|---|
| Quadrant D | 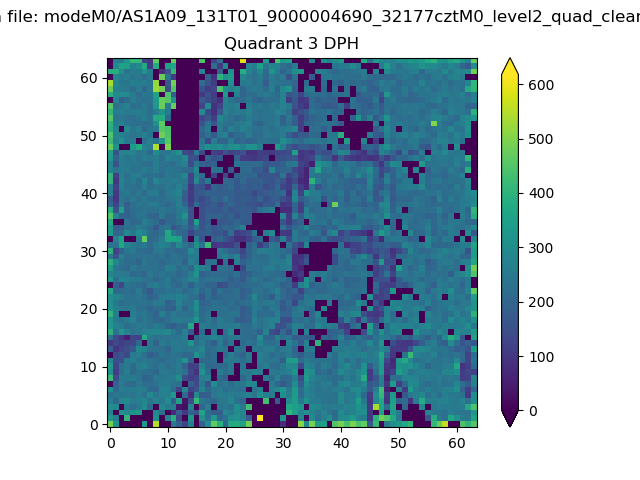 |
 |
Quadrant C |
| Plot type | Count rate plots | Images |
|---|---|---|
| Comparison with Poisson distribution Blue bars denote a histogram of data divided into 1 sec bins. Red curve is a Poisson curve with rate = median count rate of data. |
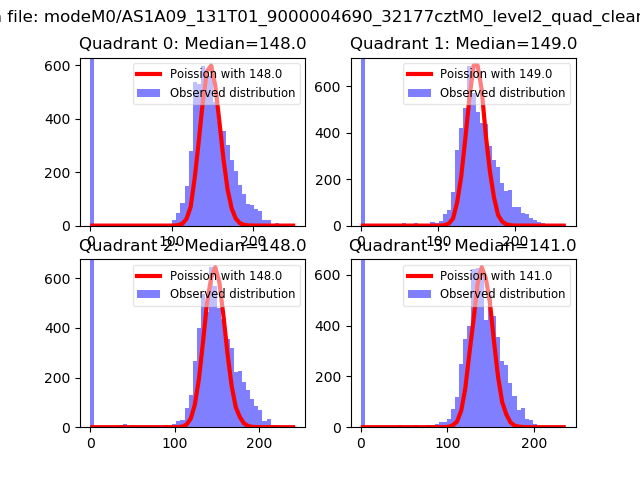 |
 |
| Quadrant-wise count rates Data is divided into 100 sec bins |
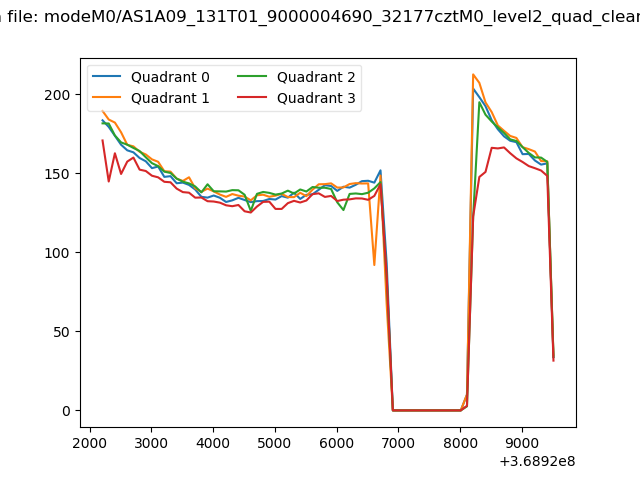 |
|
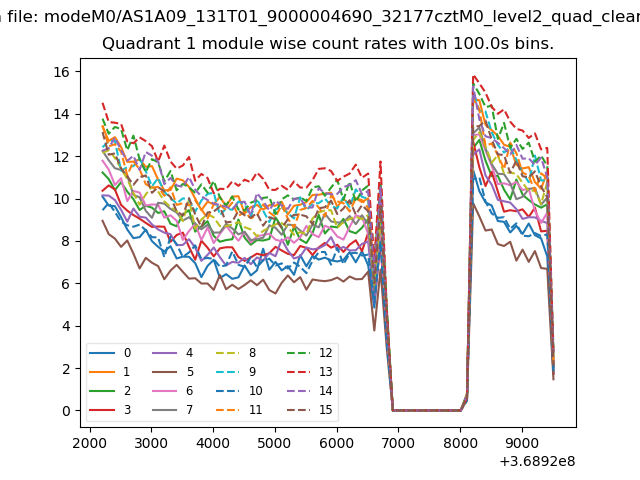
| Module-wise count rates for Quadrant A Data is divided into 100 sec bins |
 |
 |
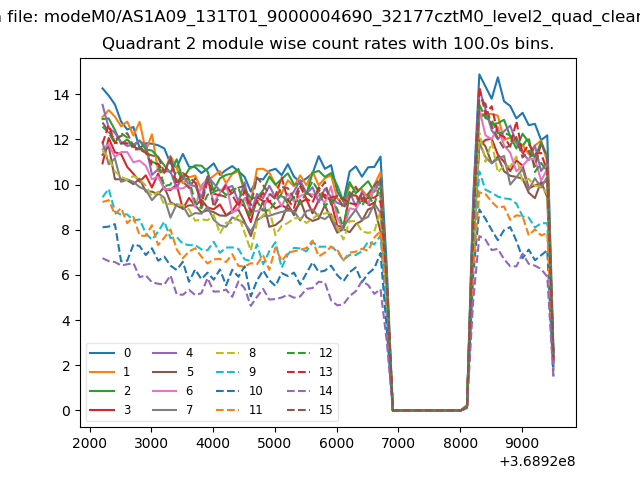
| Module-wise count rates for Quadrant B Data is divided into 100 sec bins |
 |
 |
| Module-wise count rates for Quadrant C Data is divided into 100 sec bins |
 |
 |
| Module-wise count rates for Quadrant D Data is divided into 100 sec bins |
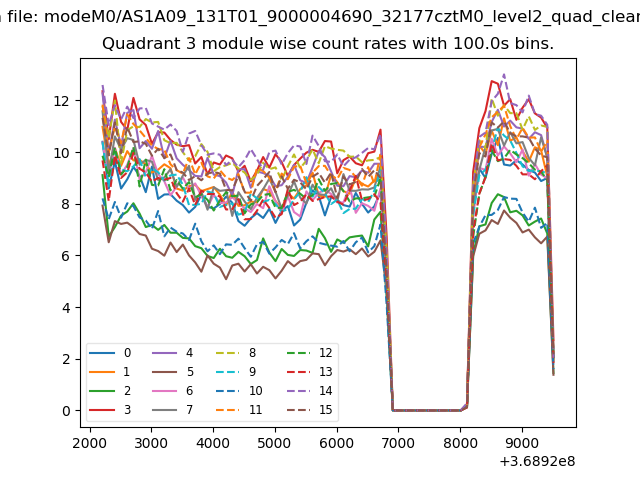 |
 |
| Parameter | Plot |
|---|---|
| CZT HV Monitor | 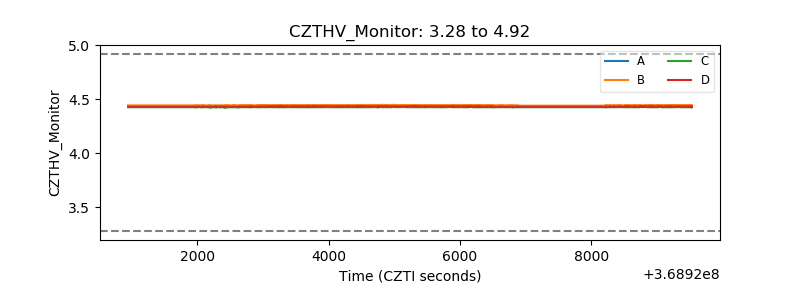 |
| D_VDD |  |
| Temperature 1 |  |
| Veto HV Monitor | 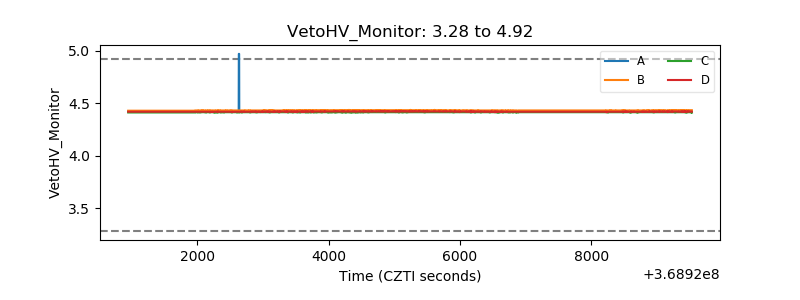 |
| Veto LLD | 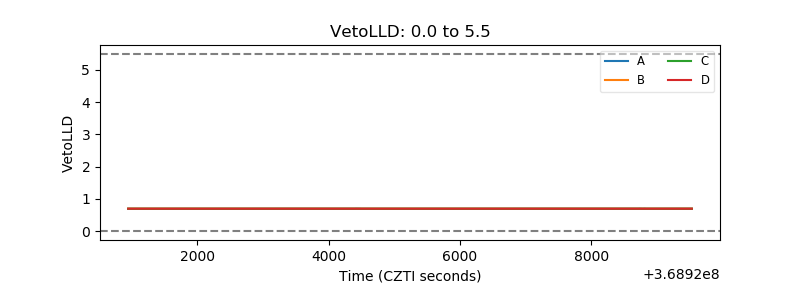 |
| Alpha Counter | 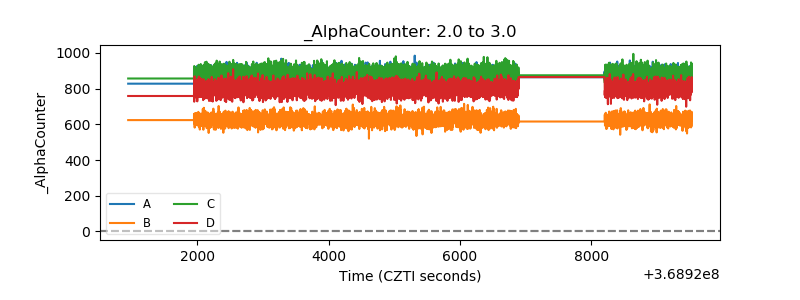 |
| _CPM_Rate | 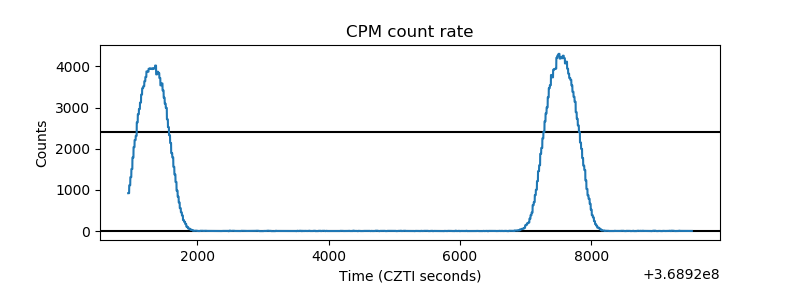 |
| CZT Counter | 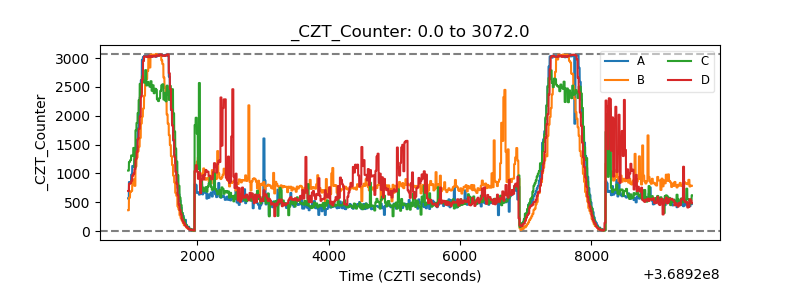 |
| +2.5 Volts monitor |  |
| +5 Volts monitor |  |
| _ROLL_ROT | 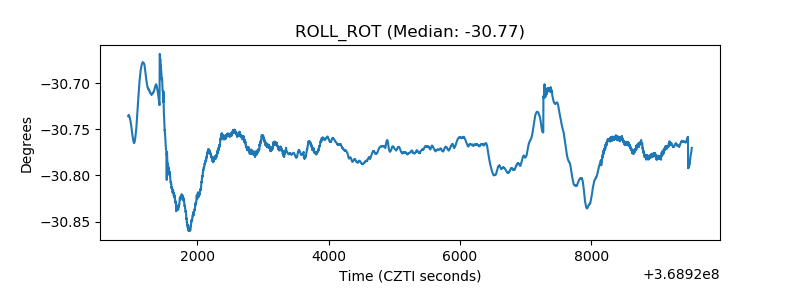 |
| _Roll_DEC | 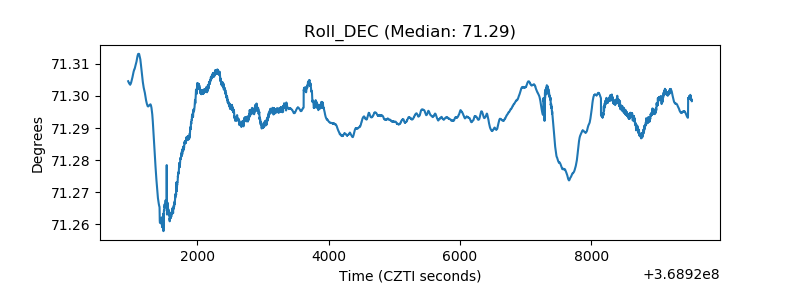 |
| _Roll_RA | 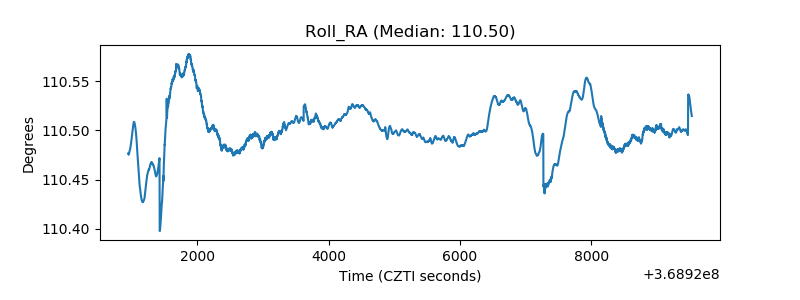 |
| Veto Counter | 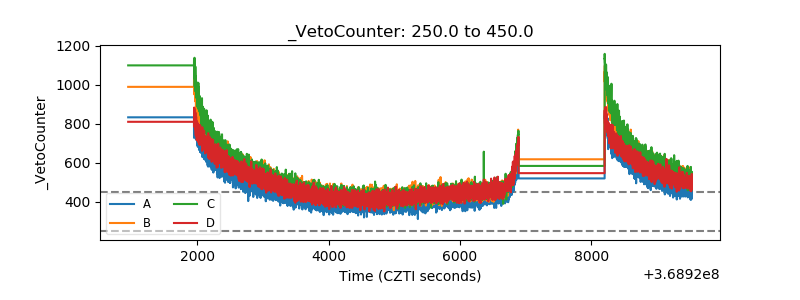 |