| Param | Original file | Final file |
|---|---|---|
| Filename | modeM0/AS1A09_131T01_9000004690_32178cztM0_level2.evt | modeM0/AS1A09_131T01_9000004690_32178cztM0_level2_quad_clean.evt |
| Size (bytes) | 560,151,360 | 134,611,200 |
| Size | 534.2 MB | 128.4 MB |
| Events in quadrant A | 3,234,929 | 930,360 |
| Events in quadrant B | 5,473,300 | 940,458 |
| Events in quadrant C | 3,751,430 | 892,358 |
| Events in quadrant D | 4,073,463 | 869,819 |
| Mode SS | |||
|---|---|---|---|
| Quadrant | BADHDUFLAG | Total packets | Discarded packets |
| A | 0 | 130 | 0 |
| B | 0 | 130 | 0 |
| C | 0 | 130 | 0 |
| D | 0 | 130 | 0 |
| Mode M0 | |||
|---|---|---|---|
| Quadrant | BADHDUFLAG | Total packets | Discarded packets |
| A | 0 | 13605 | 3 |
| B | 0 | 20675 | 2 |
| C | 0 | 15298 | 2 |
| D | 0 | 16413 | 2 |
| Mode M9 | |||
|---|---|---|---|
| Quadrant | BADHDUFLAG | Total packets | Discarded packets |
| A | 0 | 21 | 0 |
| B | 0 | 21 | 0 |
| C | 0 | 21 | 0 |
| D | 0 | 22 | 0 |
| Quadrant | Total seconds | Saturated seconds | Saturation percentage |
|---|---|---|---|
| A | 6361 | 19 | 0.298695% |
| B | 6361 | 249 | 3.914479% |
| C | 6361 | 510 | 8.017607% |
| D | 6361 | 199 | 3.128439% |
Noise dominated data is calculated using 1-second bins in cleaned event files. If a bin has >2000 counts, and if more than 50% of those come from <1% of pixels, then it is considered to be noise-dominated and hence unusable.
| Quadrant | # 1 sec bins | Bins with >0 counts | Bins with >2000 counts | High rate bins dominated by noise | Noise dominated (total time) | Noise dominated (detector-on time) | Marked lightcurve |
|---|---|---|---|---|---|---|---|
| A | 7771 | 6362 | 0 | 0 | 0.00% | 0.00% | 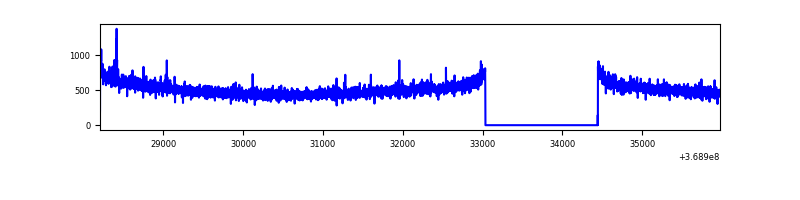 |
| B | 7771 | 6361 | 90 | 90 | 1.16% | 1.41% | 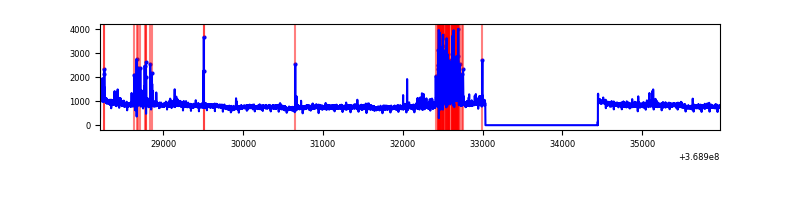 |
| C | 7771 | 6359 | 48 | 48 | 0.62% | 0.75% | 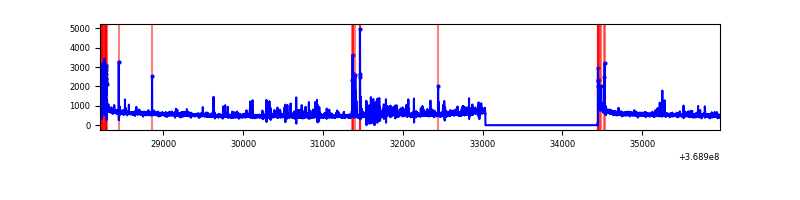 |
| D | 7771 | 6362 | 127 | 127 | 1.63% | 2.00% | 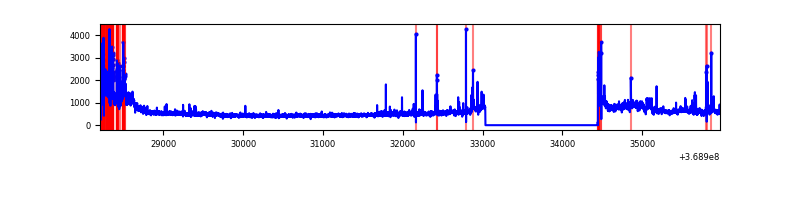 |
Top three noisy pixels from each quadrant. If the there are fewer than three noisy pixels in the level2.evt file, extra rows are filled as -1
| Pixel properties | Quadrant properties | ||||||
|---|---|---|---|---|---|---|---|
| Quadrant | DetID | PixID | Counts | Sigma | Mean | Median | Sigma |
| A | 12 | 189 | 22880 | 134.3 | 828 | 815 | 164.3 |
| A | 13 | 6 | 21543 | 126.16 | 828 | 815 | 164.3 |
| A | 13 | 254 | 11882 | 67.36 | 828 | 815 | 164.3 |
| B | 6 | 159 | 1765325 | 11716.75 | 821 | 801 | 150.6 |
| B | 5 | 172 | 288803 | 1912.38 | 821 | 801 | 150.6 |
| B | 0 | 190 | 70582 | 463.36 | 821 | 801 | 150.6 |
| C | 0 | 10 | 283255 | 1589.26 | 775 | 783 | 177.7 |
| C | 14 | 238 | 236718 | 1327.43 | 775 | 783 | 177.7 |
| C | 14 | 254 | 152256 | 852.23 | 775 | 783 | 177.7 |
| D | 8 | 195 | 663799 | 3553.23 | 786 | 767 | 186.6 |
| D | 12 | 218 | 314115 | 1679.25 | 786 | 767 | 186.6 |
| D | 2 | 250 | 52861 | 279.17 | 786 | 767 | 186.6 |
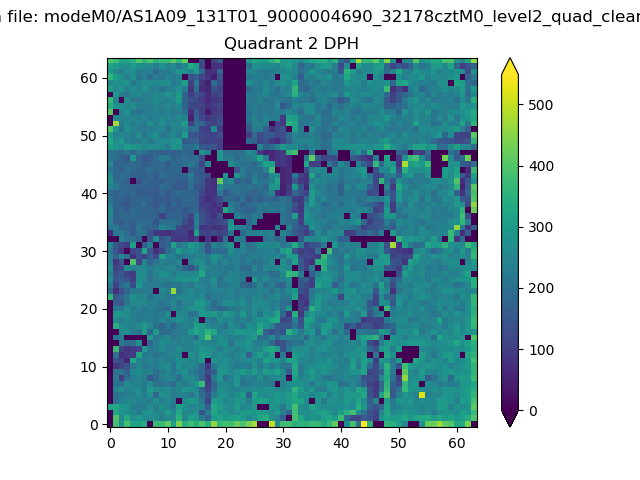
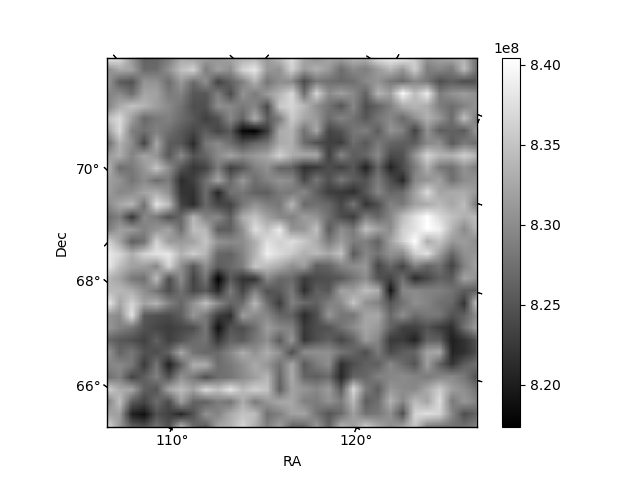
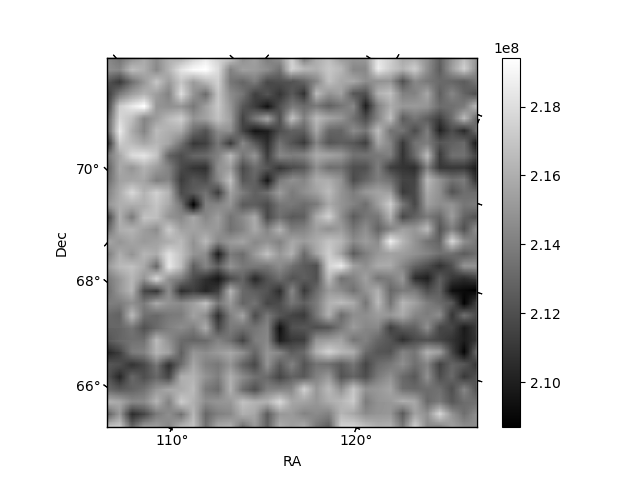
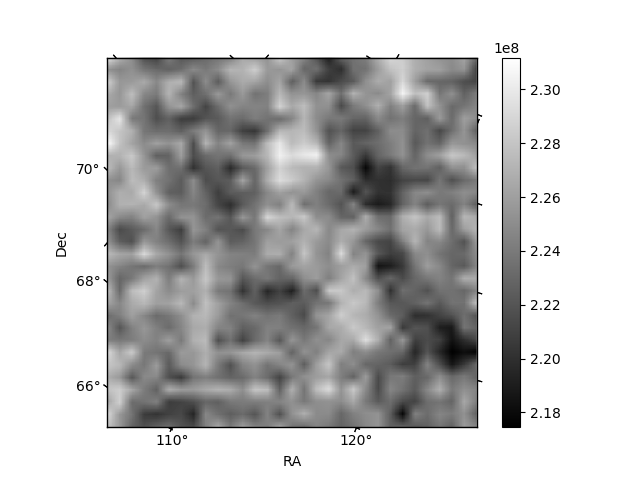
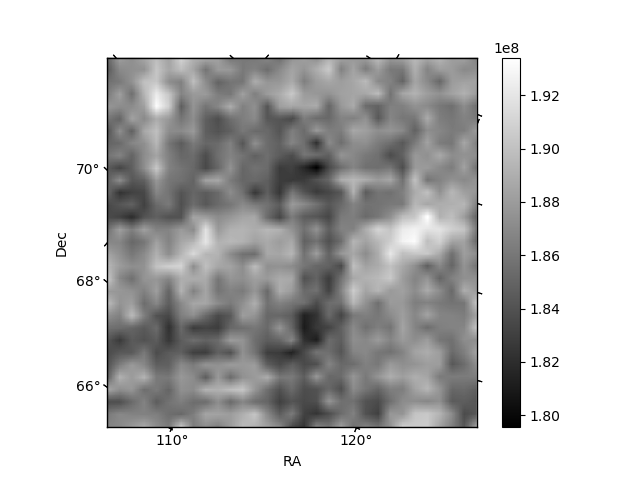
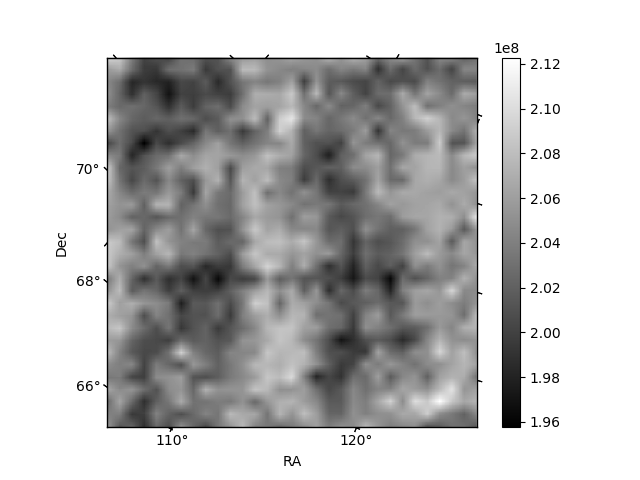
Histogram calculated using DETX and DETY for each event in the final _common_clean file
| Quadrant A | 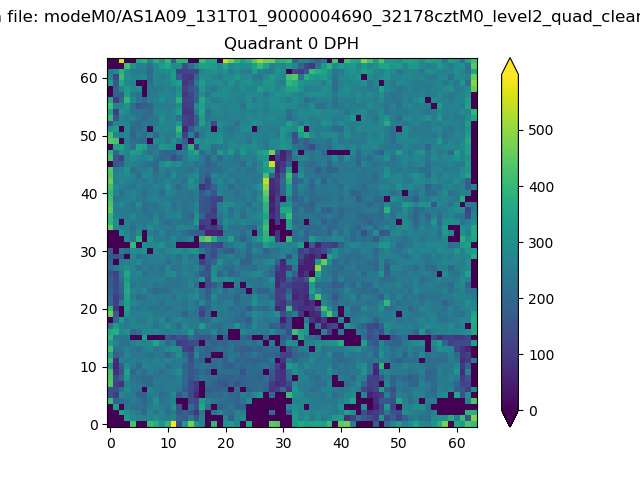 |
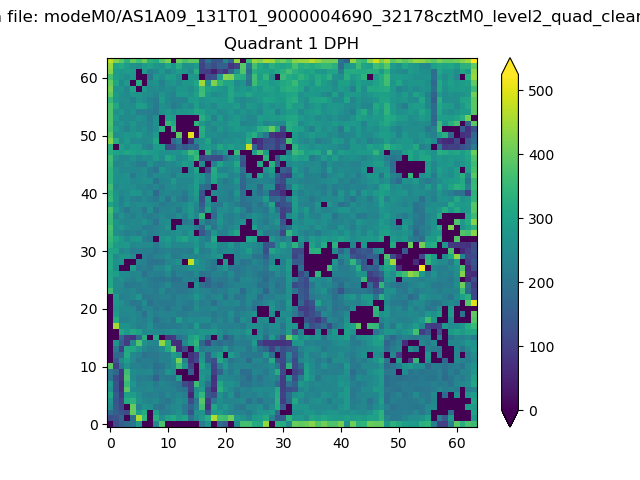 |
Quadrant B |
|---|---|---|---|
| Quadrant D | 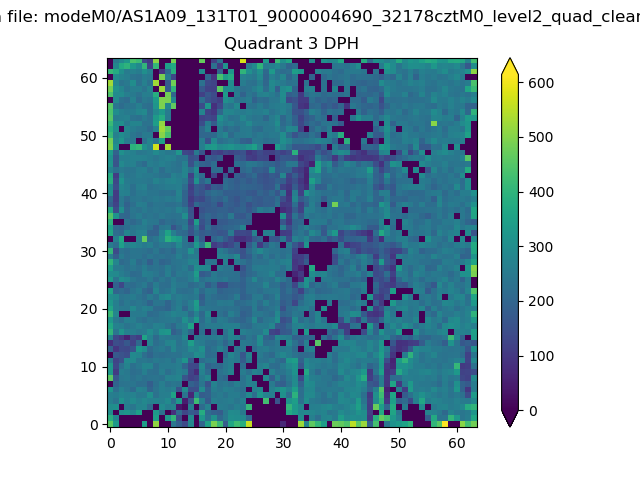 |
 |
Quadrant C |
| Plot type | Count rate plots | Images |
|---|---|---|
| Comparison with Poisson distribution Blue bars denote a histogram of data divided into 1 sec bins. Red curve is a Poisson curve with rate = median count rate of data. |
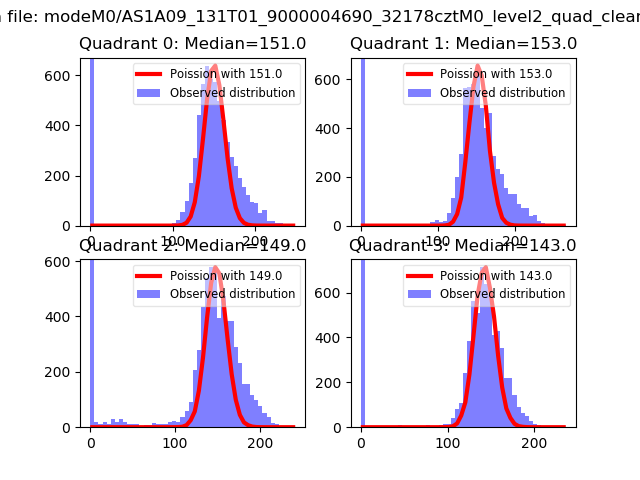 |
 |
| Quadrant-wise count rates Data is divided into 100 sec bins |
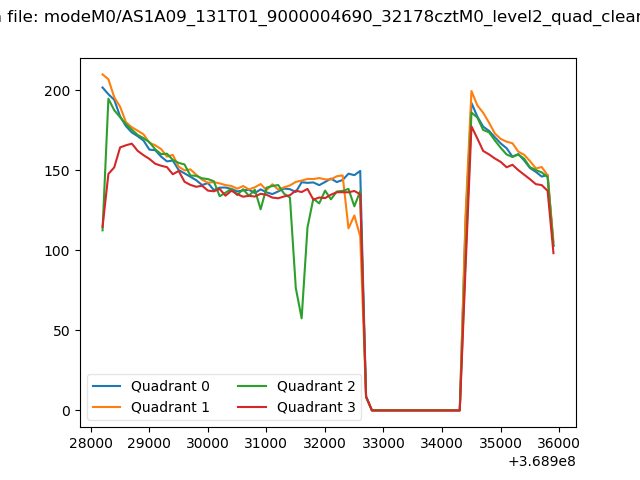 |
|
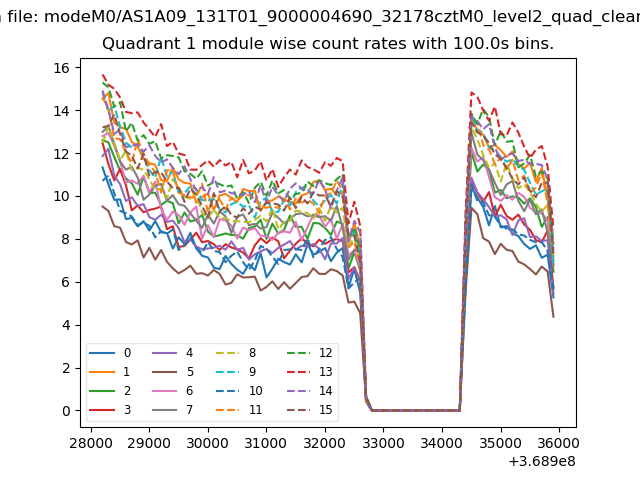
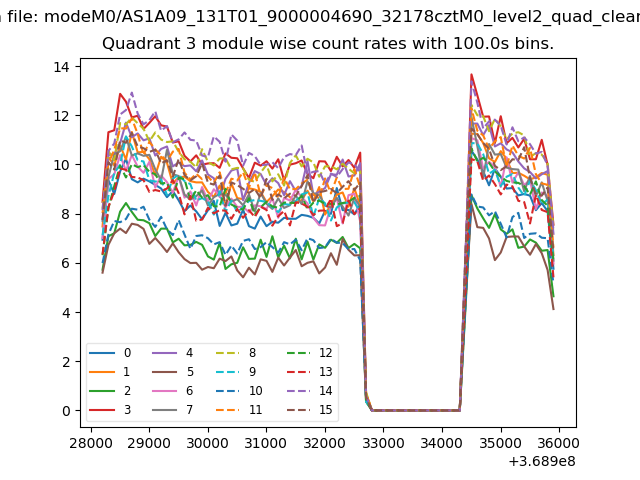
| Module-wise count rates for Quadrant A Data is divided into 100 sec bins |
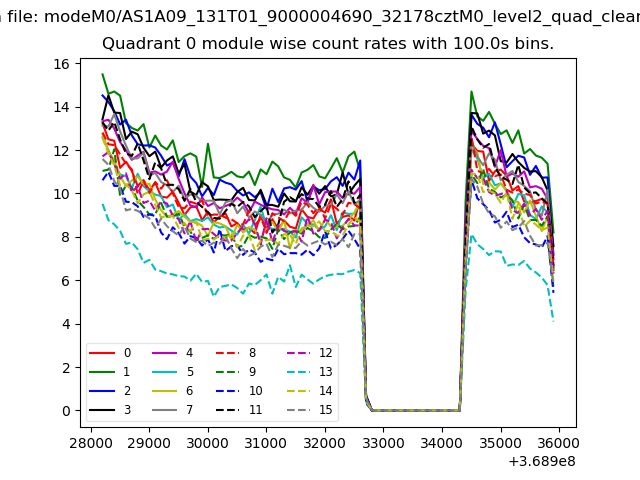 |
 |
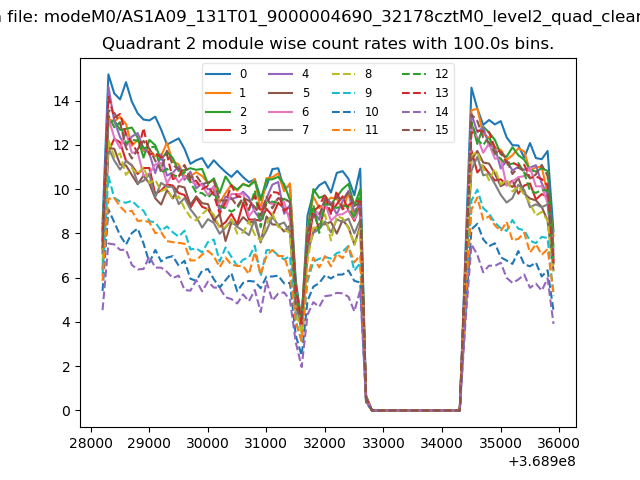
| Module-wise count rates for Quadrant B Data is divided into 100 sec bins |
 |
 |
| Module-wise count rates for Quadrant C Data is divided into 100 sec bins |
 |
 |
| Module-wise count rates for Quadrant D Data is divided into 100 sec bins |
 |
 |
| Parameter | Plot |
|---|---|
| CZT HV Monitor | 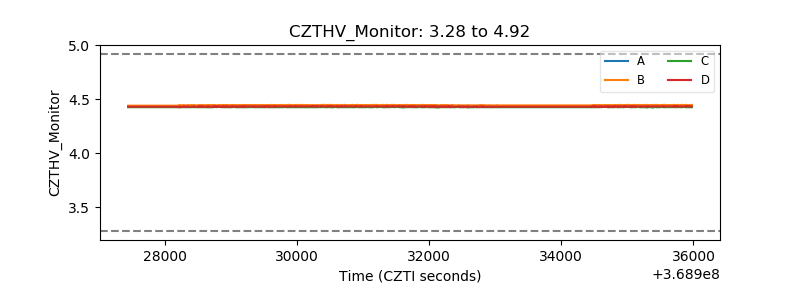 |
| D_VDD | 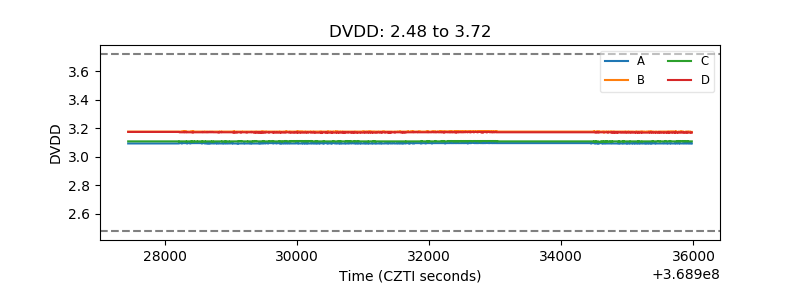 |
| Temperature 1 | 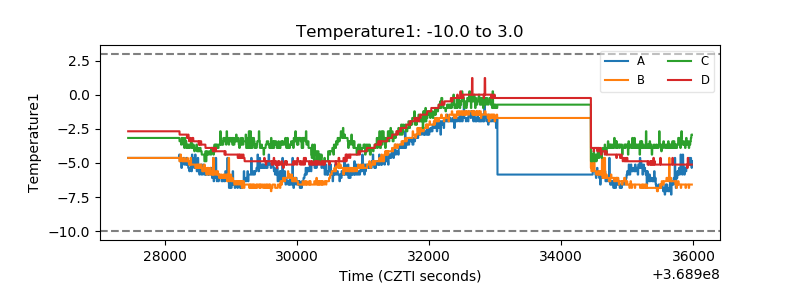 |
| Veto HV Monitor |  |
| Veto LLD | 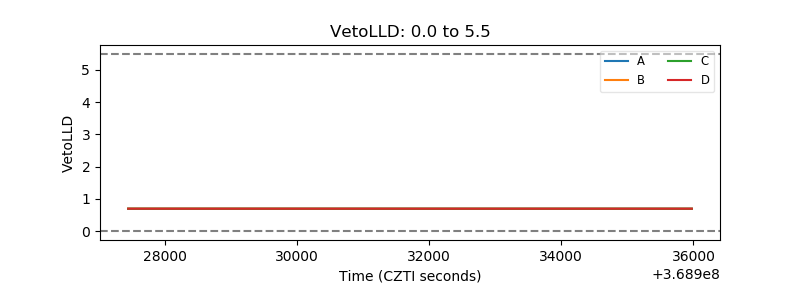 |
| Alpha Counter | 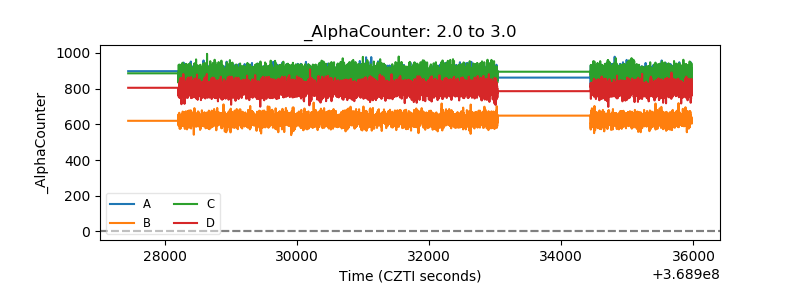 |
| _CPM_Rate | 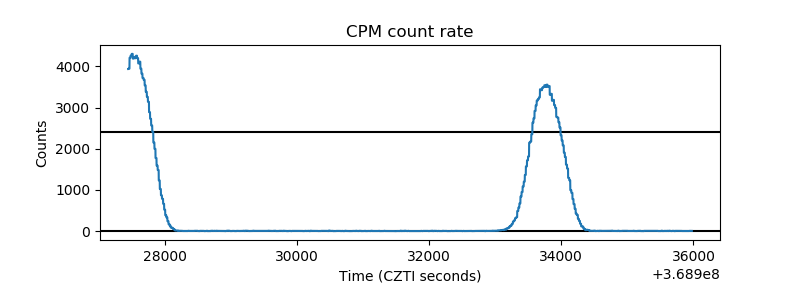 |
| CZT Counter | 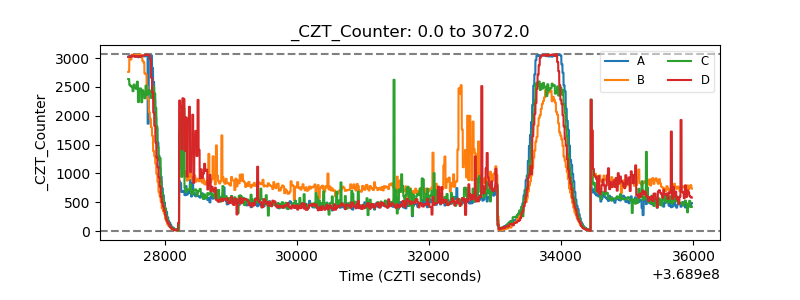 |
| +2.5 Volts monitor | 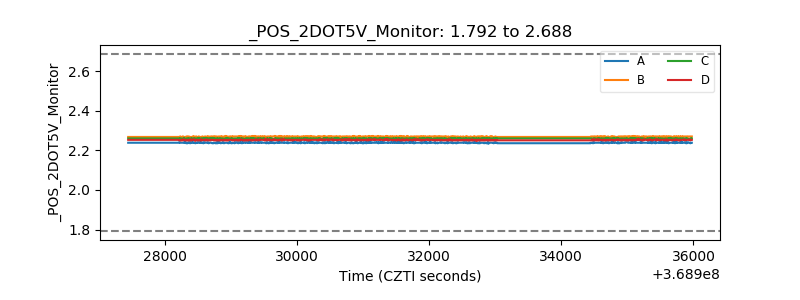 |
| +5 Volts monitor | 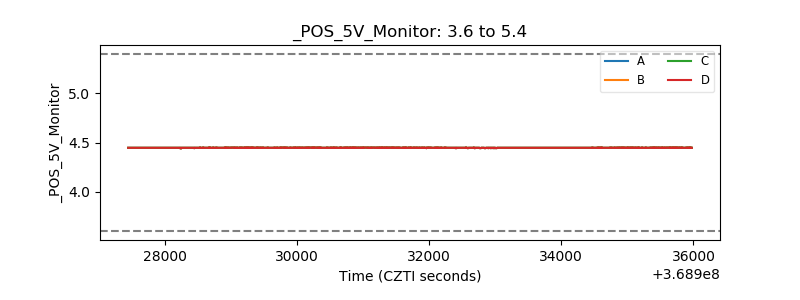 |
| _ROLL_ROT | 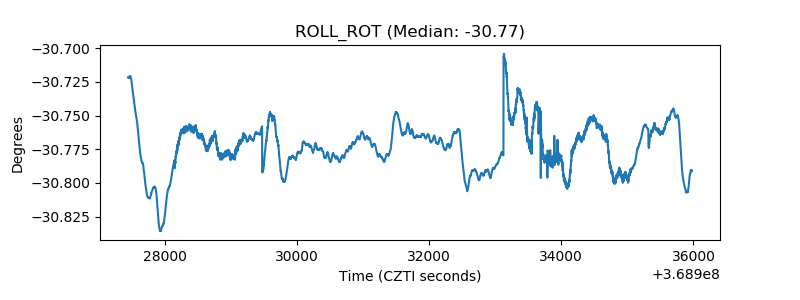 |
| _Roll_DEC | 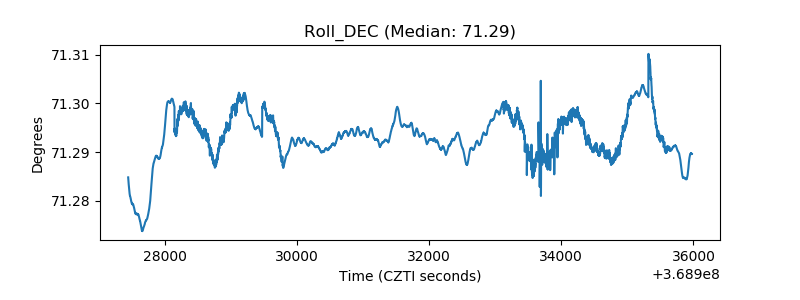 |
| _Roll_RA | 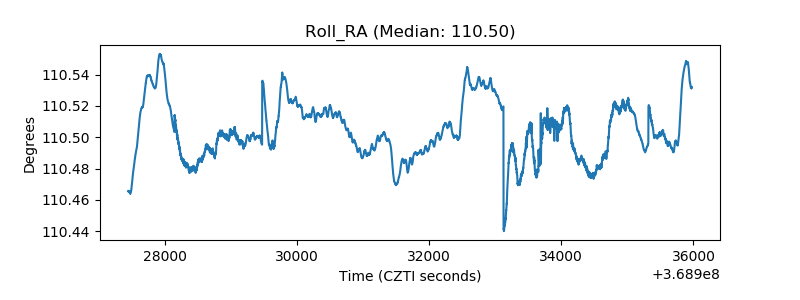 |
| Veto Counter | 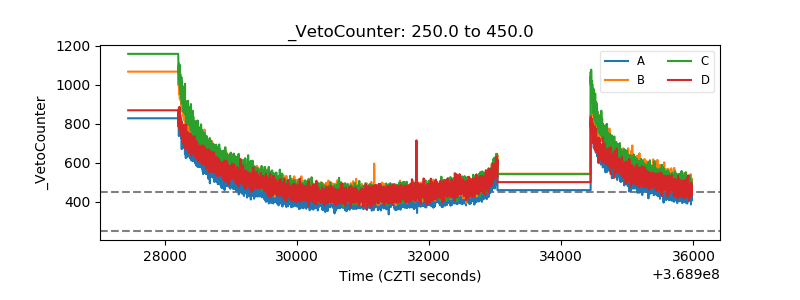 |