| Param | Original file | Final file |
|---|---|---|
| Filename | modeM0/AS1A09_131T01_9000004690_32179cztM0_level2.evt | modeM0/AS1A09_131T01_9000004690_32179cztM0_level2_quad_clean.evt |
| Size (bytes) | 567,912,960 | 117,472,320 |
| Size | 541.6 MB | 112.0 MB |
| Events in quadrant A | 2,958,455 | 802,983 |
| Events in quadrant B | 4,898,880 | 820,515 |
| Events in quadrant C | 3,222,228 | 789,022 |
| Events in quadrant D | 5,718,644 | 731,189 |
| Mode SS | |||
|---|---|---|---|
| Quadrant | BADHDUFLAG | Total packets | Discarded packets |
| A | 0 | 125 | 5 |
| B | 0 | 124 | 2 |
| C | 0 | 126 | 4 |
| D | 0 | 126 | 6 |
| Mode M0 | |||
|---|---|---|---|
| Quadrant | BADHDUFLAG | Total packets | Discarded packets |
| A | 0 | 12802 | 291 |
| B | 0 | 19038 | 401 |
| C | 0 | 13490 | 310 |
| D | 0 | 21846 | 538 |
| Mode M9 | |||
|---|---|---|---|
| Quadrant | BADHDUFLAG | Total packets | Discarded packets |
| A | 0 | 17 | 0 |
| B | 0 | 17 | 0 |
| C | 0 | 17 | 0 |
| D | 0 | 18 | 0 |
| Quadrant | Total seconds | Saturated seconds | Saturation percentage |
|---|---|---|---|
| A | 5931 | 43 | 0.725004% |
| B | 5934 | 189 | 3.185035% |
| C | 5931 | 167 | 2.815714% |
| D | 5915 | 605 | 10.228233% |
Noise dominated data is calculated using 1-second bins in cleaned event files. If a bin has >2000 counts, and if more than 50% of those come from <1% of pixels, then it is considered to be noise-dominated and hence unusable.
| Quadrant | # 1 sec bins | Bins with >0 counts | Bins with >2000 counts | High rate bins dominated by noise | Noise dominated (total time) | Noise dominated (detector-on time) | Marked lightcurve |
|---|---|---|---|---|---|---|---|
| A | 7758 | 5951 | 0 | 0 | 0.00% | 0.00% | 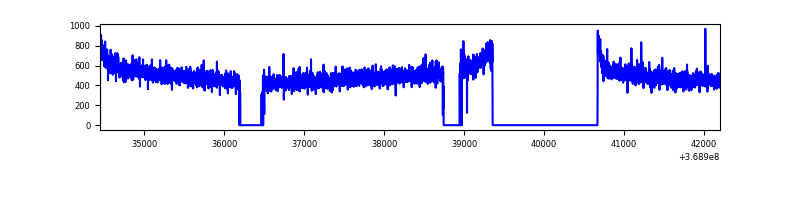 |
| B | 7758 | 5958 | 38 | 38 | 0.49% | 0.64% | 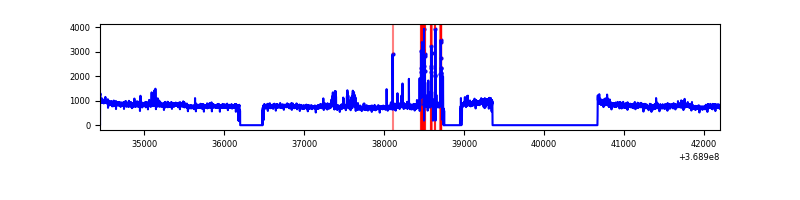 |
| C | 7758 | 5952 | 15 | 15 | 0.19% | 0.25% | 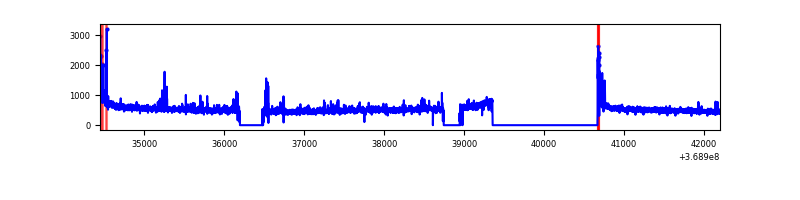 |
| D | 7758 | 5937 | 366 | 366 | 4.72% | 6.16% | 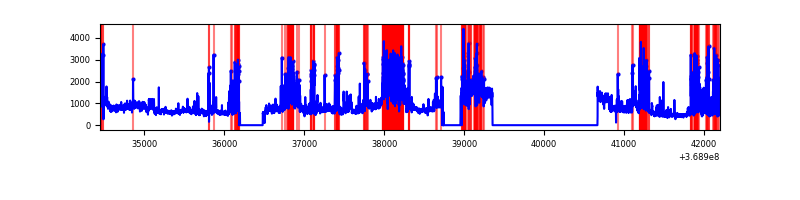 |
Top three noisy pixels from each quadrant. If the there are fewer than three noisy pixels in the level2.evt file, extra rows are filled as -1
| Pixel properties | Quadrant properties | ||||||
|---|---|---|---|---|---|---|---|
| Quadrant | DetID | PixID | Counts | Sigma | Mean | Median | Sigma |
| A | 13 | 6 | 14675 | 92.61 | 761 | 750 | 150.4 |
| A | 13 | 254 | 11394 | 70.79 | 761 | 750 | 150.4 |
| A | 3 | 137 | 7151 | 42.57 | 761 | 750 | 150.4 |
| B | 6 | 159 | 1664567 | 11801.88 | 759 | 740 | 141.0 |
| B | 5 | 172 | 126852 | 894.54 | 759 | 740 | 141.0 |
| B | 0 | 190 | 75820 | 532.56 | 759 | 740 | 141.0 |
| C | 14 | 238 | 157129 | 934.65 | 729 | 734 | 167.3 |
| C | 0 | 10 | 139797 | 831.07 | 729 | 734 | 167.3 |
| C | 14 | 254 | 45415 | 267.02 | 729 | 734 | 167.3 |
| D | 8 | 195 | 1581324 | 9611.13 | 701 | 683 | 164.5 |
| D | 2 | 250 | 1294853 | 7869.24 | 701 | 683 | 164.5 |
| D | 12 | 218 | 126137 | 762.83 | 701 | 683 | 164.5 |
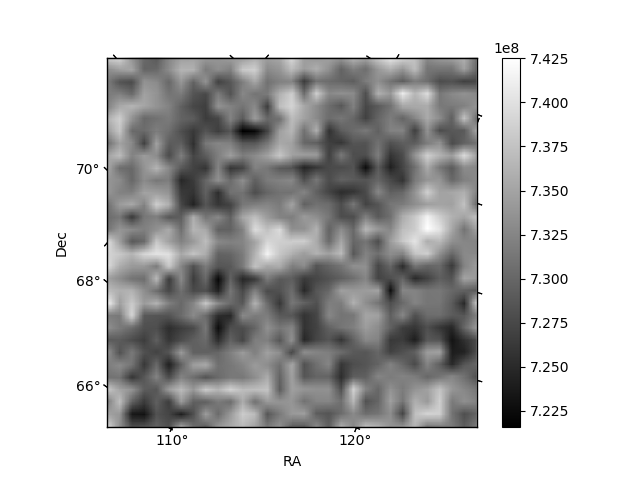
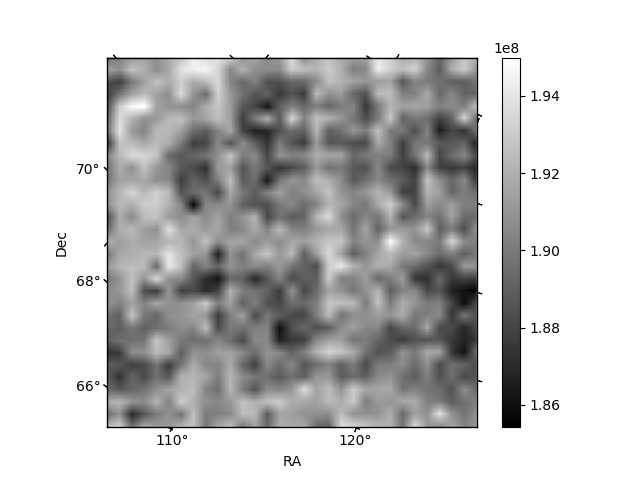
Histogram calculated using DETX and DETY for each event in the final _common_clean file
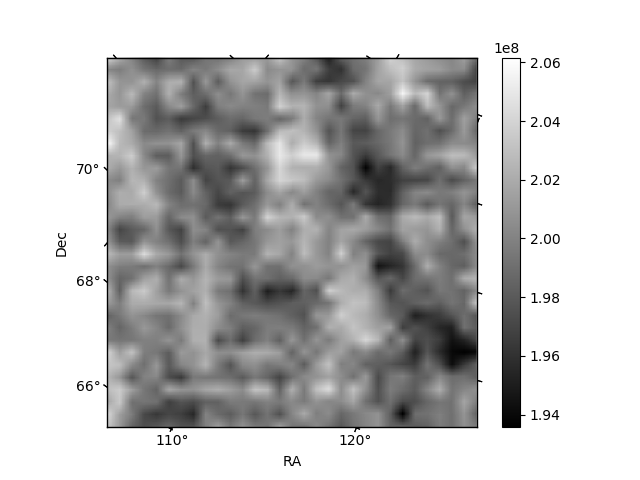
| Quadrant A | 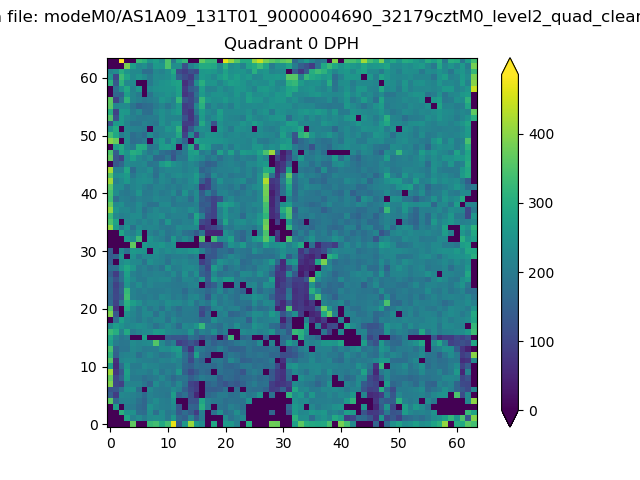 |
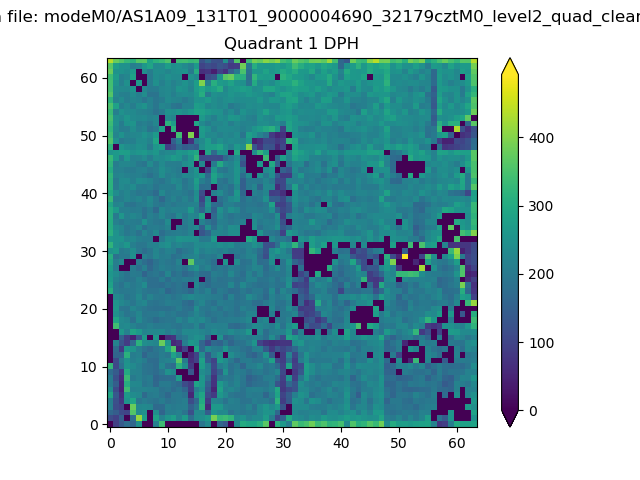 |
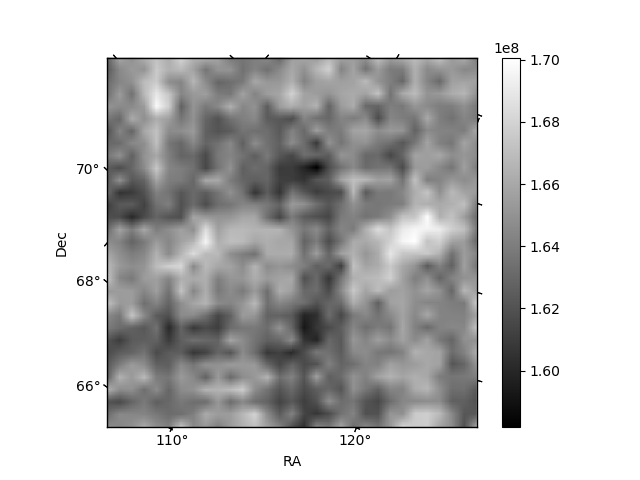
Quadrant B |
|---|---|---|---|
| Quadrant D |  |
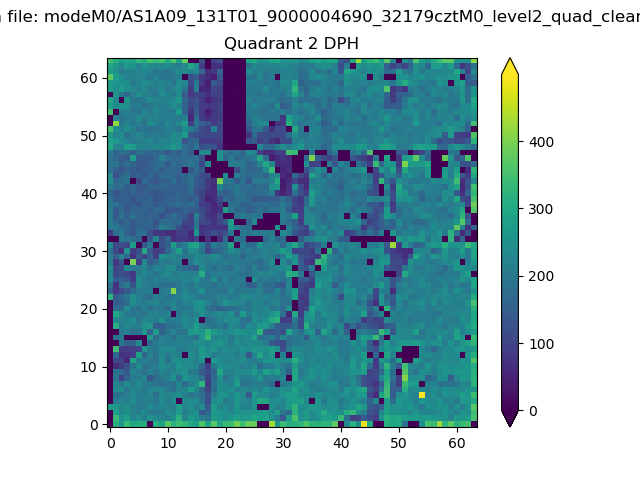 |
Quadrant C |
| Plot type | Count rate plots | Images |
|---|---|---|
| Comparison with Poisson distribution Blue bars denote a histogram of data divided into 1 sec bins. Red curve is a Poisson curve with rate = median count rate of data. |
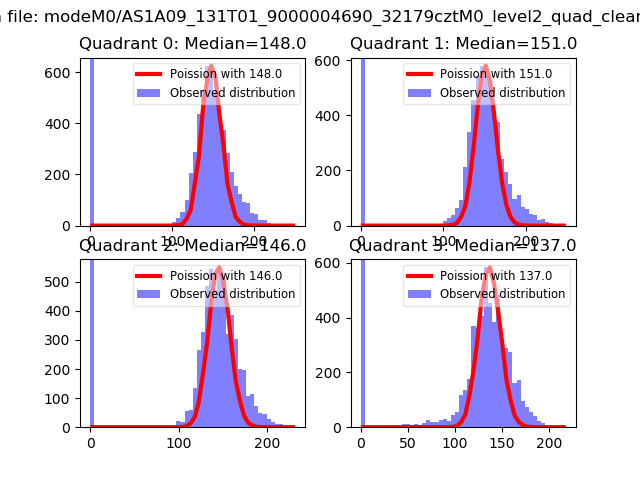 |
 |
| Quadrant-wise count rates Data is divided into 100 sec bins |
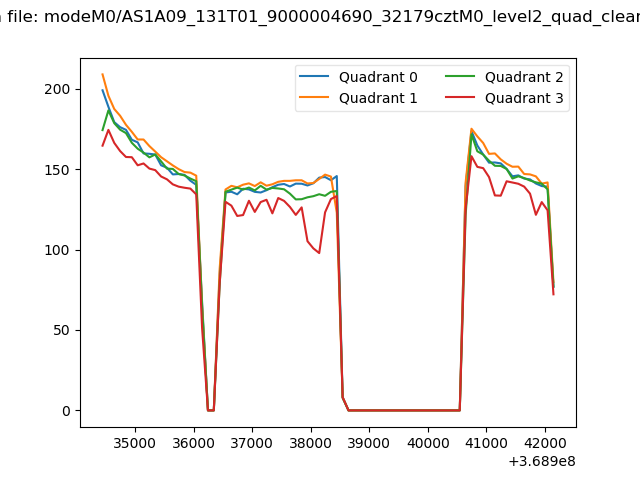 |
|
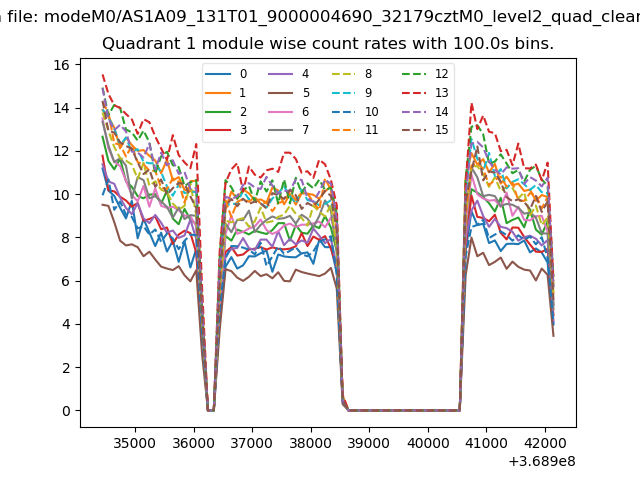
| Module-wise count rates for Quadrant A Data is divided into 100 sec bins |
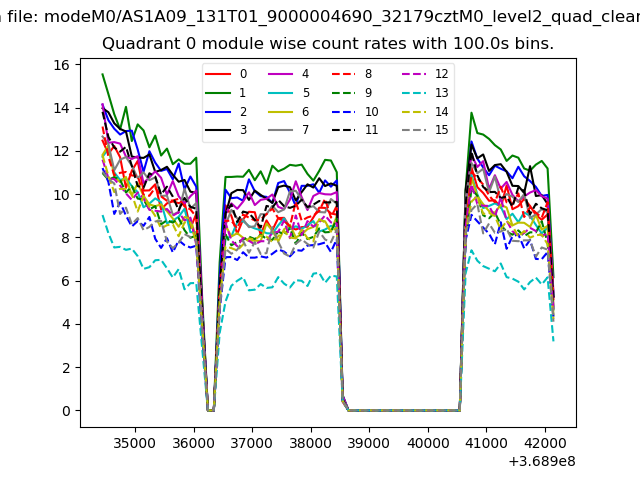 |
 |
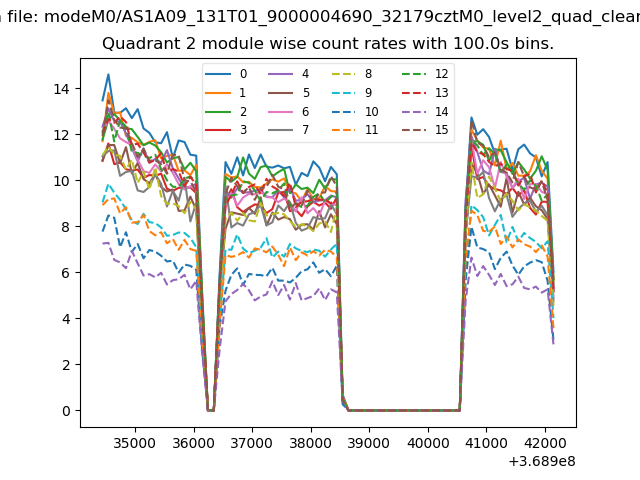
| Module-wise count rates for Quadrant B Data is divided into 100 sec bins |
 |
 |
| Module-wise count rates for Quadrant C Data is divided into 100 sec bins |
 |
 |
| Module-wise count rates for Quadrant D Data is divided into 100 sec bins |
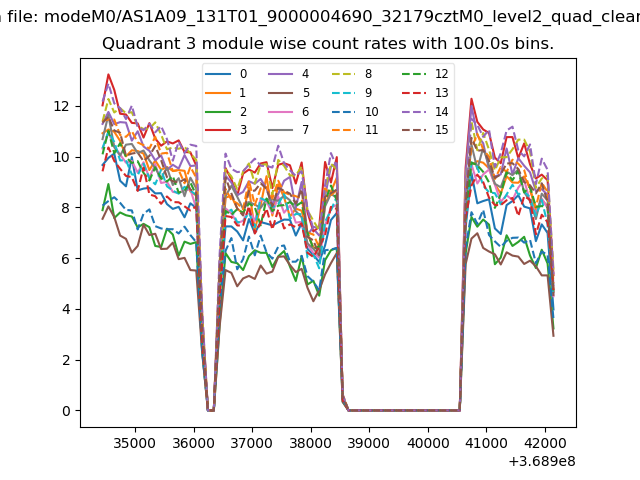 |
 |
| Parameter | Plot |
|---|---|
| CZT HV Monitor |  |
| D_VDD | 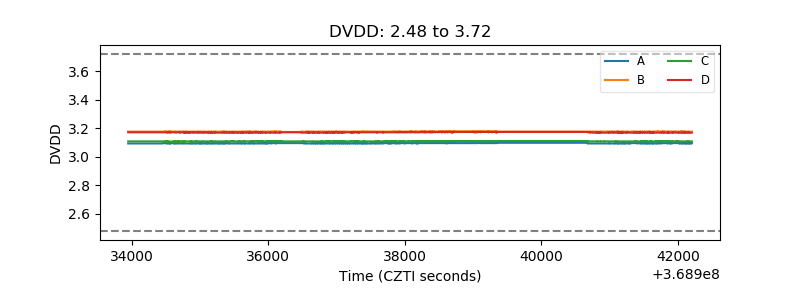 |
| Temperature 1 | 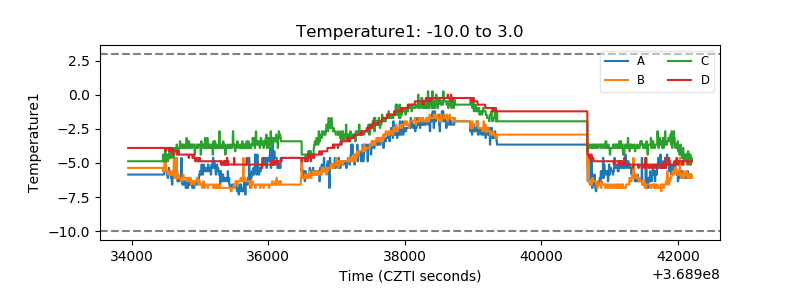 |
| Veto HV Monitor | 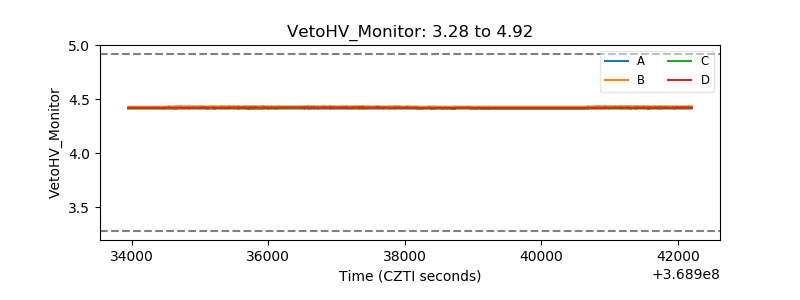 |
| Veto LLD | 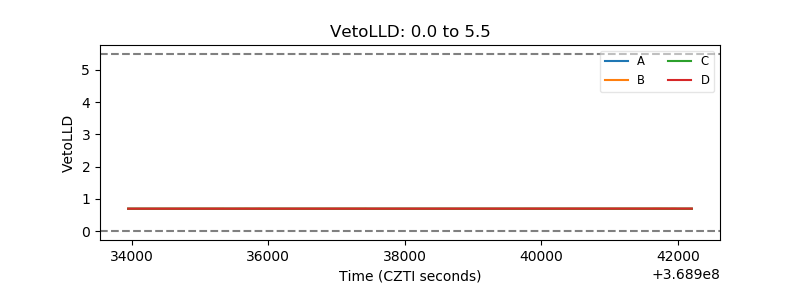 |
| Alpha Counter | 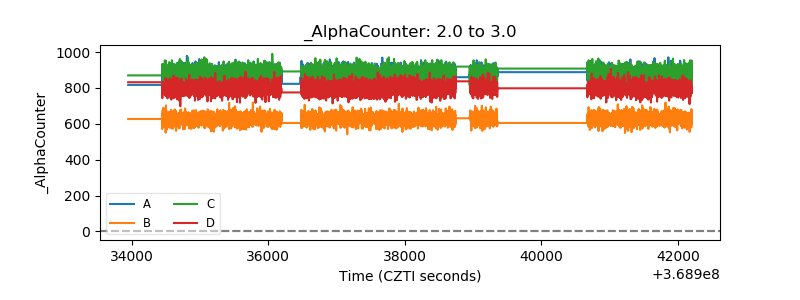 |
| _CPM_Rate | 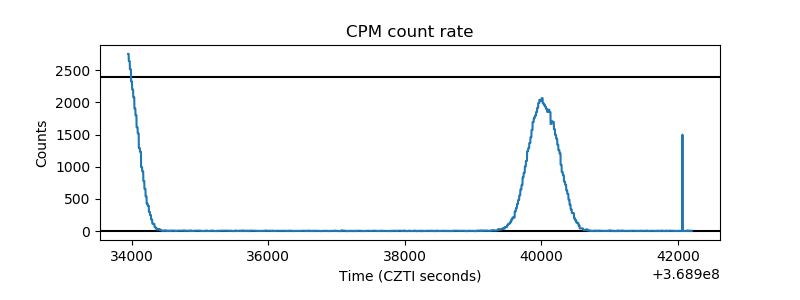 |
| CZT Counter | 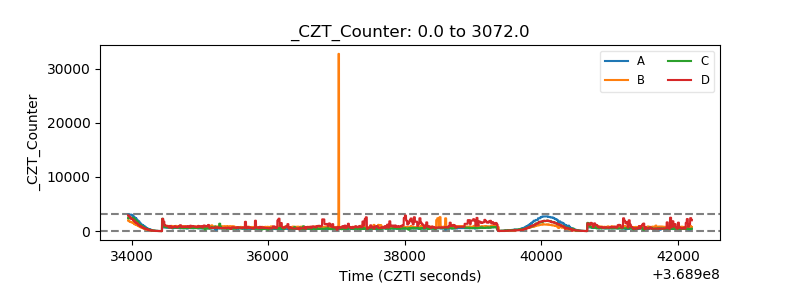 |
| +2.5 Volts monitor |  |
| +5 Volts monitor |  |
| _ROLL_ROT | 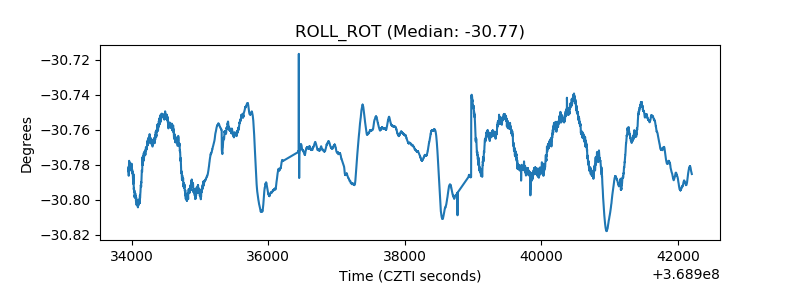 |
| _Roll_DEC | 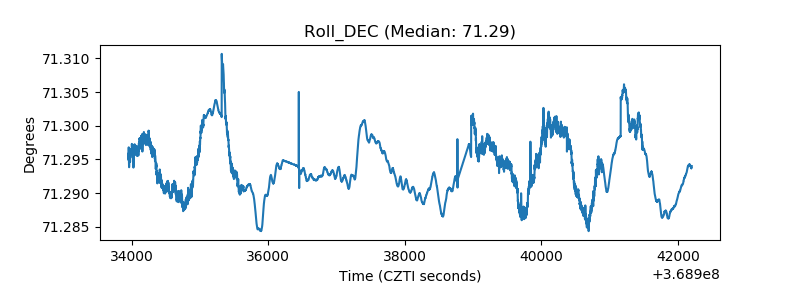 |
| _Roll_RA | 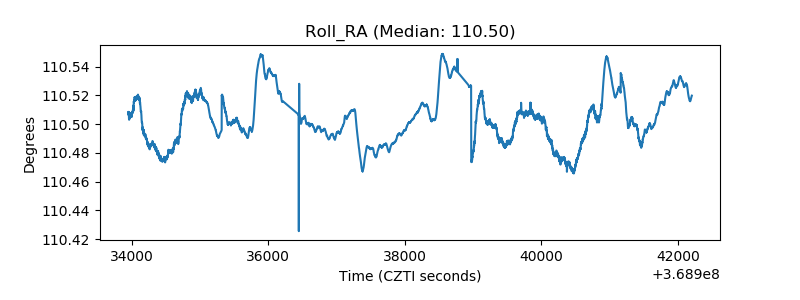 |
| Veto Counter | 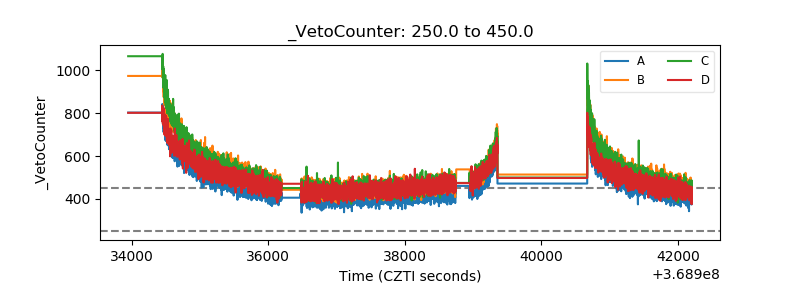 |