| Param | Original file | Final file |
|---|---|---|
| Filename | modeM0/AS1A09_131T01_9000004690_32182cztM0_level2.evt | modeM0/AS1A09_131T01_9000004690_32182cztM0_level2_quad_clean.evt |
| Size (bytes) | 132,197,760 | 19,601,280 |
| Size | 126.1 MB | 18.7 MB |
| Events in quadrant A | 813,664 | 126,567 |
| Events in quadrant B | 1,167,266 | 107,779 |
| Events in quadrant C | 867,182 | 123,589 |
| Events in quadrant D | 1,046,389 | 119,161 |
| Mode SS | |||
|---|---|---|---|
| Quadrant | BADHDUFLAG | Total packets | Discarded packets |
| A | 0 | 179 | 145 |
| B | 0 | 182 | 152 |
| C | 0 | 185 | 149 |
| D | 0 | 183 | 144 |
| Mode M0 | |||
|---|---|---|---|
| Quadrant | BADHDUFLAG | Total packets | Discarded packets |
| A | 0 | 18223 | 14886 |
| B | 0 | 27126 | 22689 |
| C | 0 | 19143 | 15617 |
| D | 0 | 23083 | 18886 |
| Mode M9 | |||
|---|---|---|---|
| Quadrant | BADHDUFLAG | Total packets | Discarded packets |
| A | 0 | 10 | 9 |
| B | 0 | 15 | 15 |
| C | 0 | 11 | 11 |
| D | 0 | 12 | 11 |
| Quadrant | Total seconds | Saturated seconds | Saturation percentage |
|---|---|---|---|
| A | 1614 | 31 | 1.920694% |
| B | 1464 | 33 | 2.254098% |
| C | 1600 | 49 | 3.062500% |
| D | 1559 | 36 | 2.309173% |
Noise dominated data is calculated using 1-second bins in cleaned event files. If a bin has >2000 counts, and if more than 50% of those come from <1% of pixels, then it is considered to be noise-dominated and hence unusable.
| Quadrant | # 1 sec bins | Bins with >0 counts | Bins with >2000 counts | High rate bins dominated by noise | Noise dominated (total time) | Noise dominated (detector-on time) | Marked lightcurve |
|---|---|---|---|---|---|---|---|
| A | 15355 | 1819 | 0 | 0 | 0.00% | 0.00% | 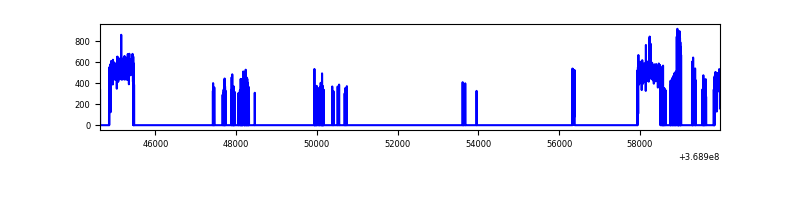 |
| B | 15131 | 1587 | 0 | 0 | 0.00% | 0.00% | 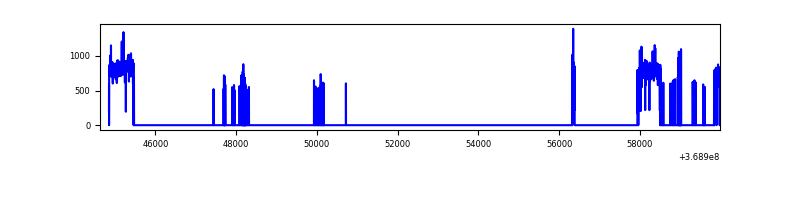 |
| C | 15344 | 1795 | 0 | 0 | 0.00% | 0.00% | 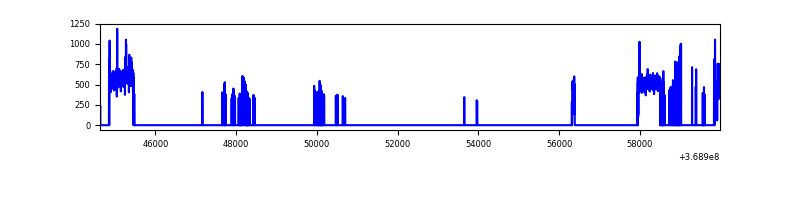 |
| D | 15125 | 1740 | 13 | 13 | 0.09% | 0.75% | 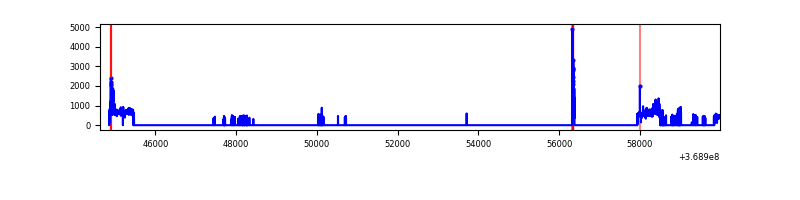 |
Top three noisy pixels from each quadrant. If the there are fewer than three noisy pixels in the level2.evt file, extra rows are filled as -1
| Pixel properties | Quadrant properties | ||||||
|---|---|---|---|---|---|---|---|
| Quadrant | DetID | PixID | Counts | Sigma | Mean | Median | Sigma |
| A | 15 | 174 | 8356 | 186.97 | 207 | 203 | 43.6 |
| A | 13 | 6 | 3341 | 71.96 | 207 | 203 | 43.6 |
| A | 13 | 254 | 3165 | 67.93 | 207 | 203 | 43.6 |
| B | 6 | 159 | 402093 | 10481.36 | 189 | 184 | 38.3 |
| B | 0 | 190 | 9461 | 241.93 | 189 | 184 | 38.3 |
| B | 0 | 245 | 4963 | 124.63 | 189 | 184 | 38.3 |
| C | 14 | 238 | 38717 | 799.37 | 200 | 200 | 48.2 |
| C | 0 | 10 | 17397 | 356.9 | 200 | 200 | 48.2 |
| C | 3 | 233 | 15516 | 317.86 | 200 | 200 | 48.2 |
| D | 8 | 195 | 103899 | 2131.9 | 196 | 190 | 48.6 |
| D | 14 | 52 | 101295 | 2078.37 | 196 | 190 | 48.6 |
| D | 12 | 218 | 74647 | 1530.58 | 196 | 190 | 48.6 |
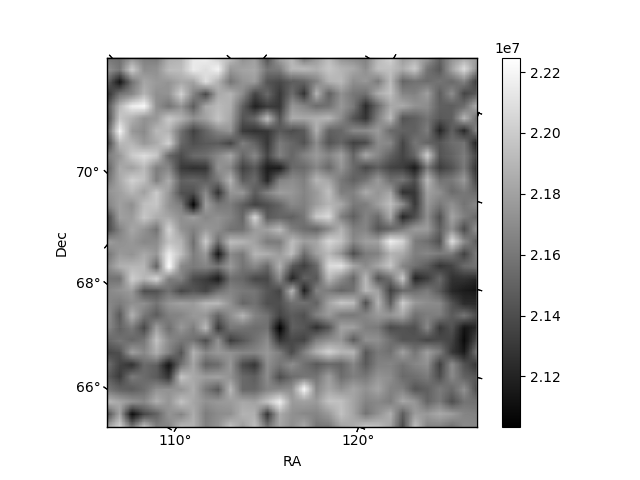
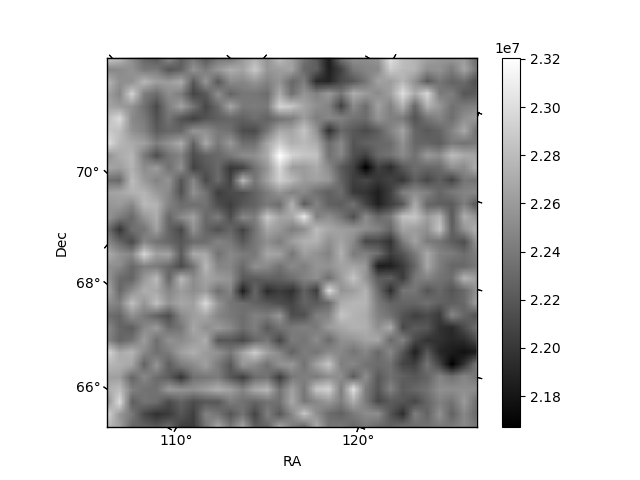
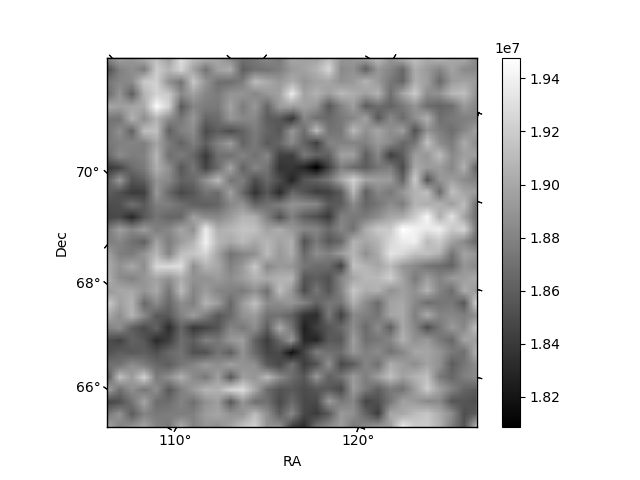
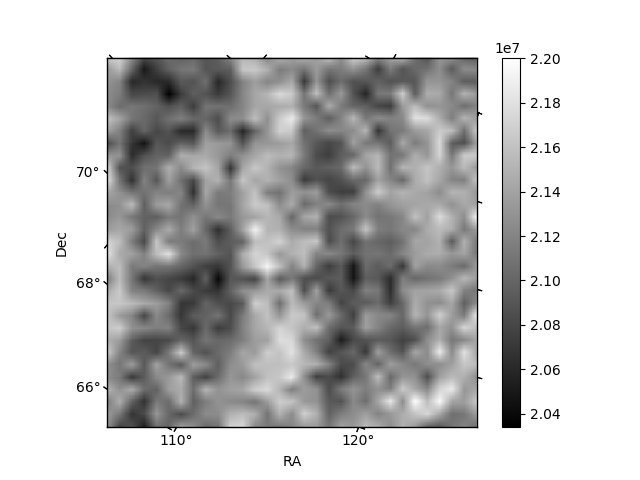
Histogram calculated using DETX and DETY for each event in the final _common_clean file
| Quadrant A | 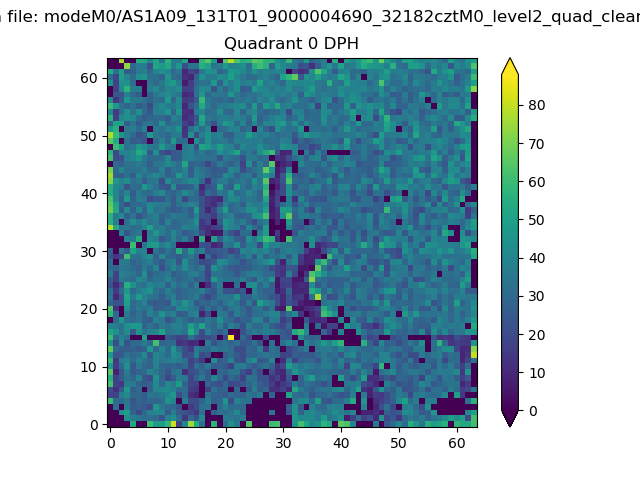 |
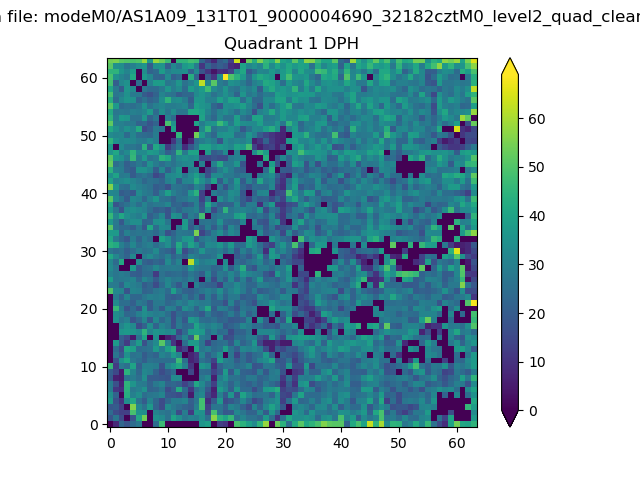 |
Quadrant B |
|---|---|---|---|
| Quadrant D | 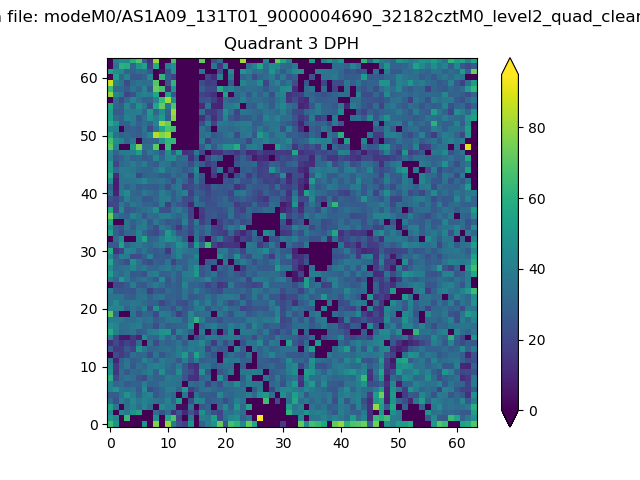 |
 |
Quadrant C |
| Plot type | Count rate plots | Images |
|---|---|---|
| Comparison with Poisson distribution Blue bars denote a histogram of data divided into 1 sec bins. Red curve is a Poisson curve with rate = median count rate of data. |
 |
 |
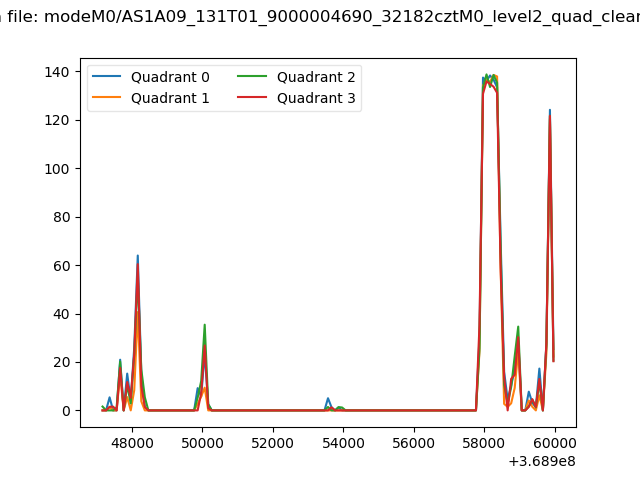
| Quadrant-wise count rates Data is divided into 100 sec bins |
 |
|
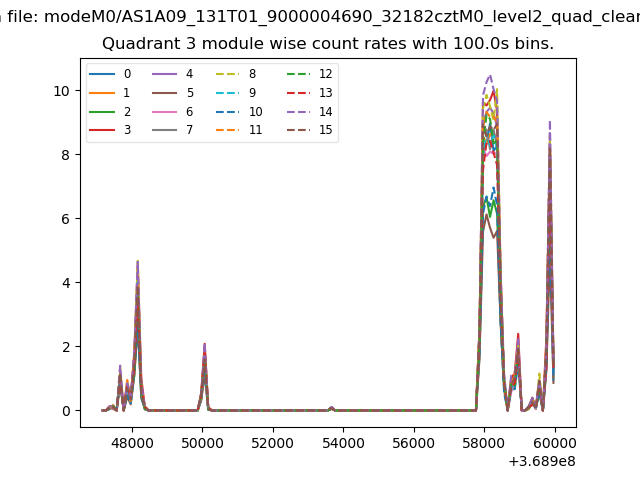
| Module-wise count rates for Quadrant A Data is divided into 100 sec bins |
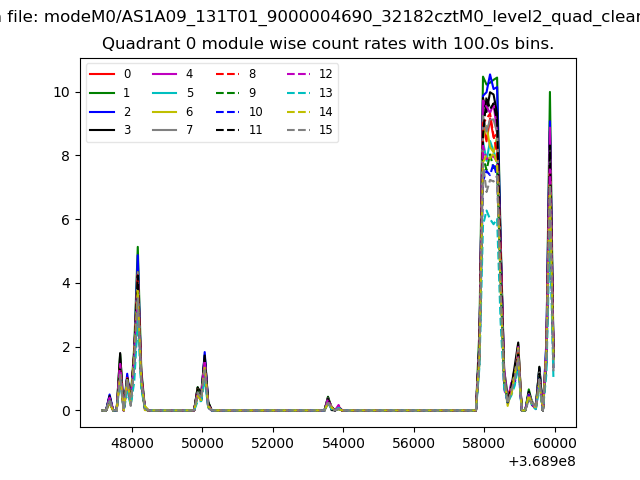 |
 |
| Module-wise count rates for Quadrant B Data is divided into 100 sec bins |
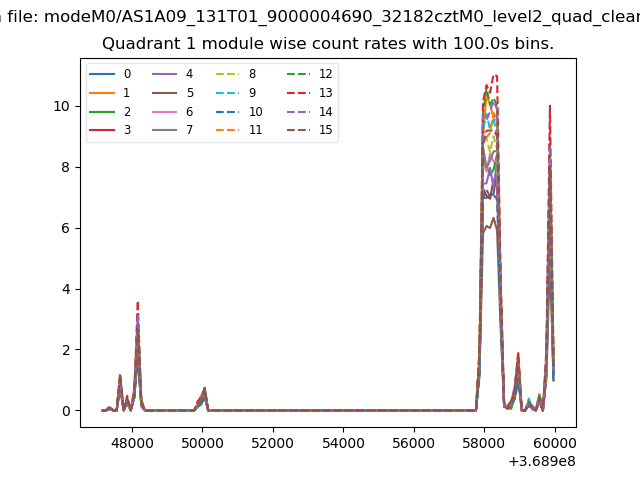 |
 |
| Module-wise count rates for Quadrant C Data is divided into 100 sec bins |
 |
 |
| Module-wise count rates for Quadrant D Data is divided into 100 sec bins |
 |
 |
| Parameter | Plot |
|---|---|
| CZT HV Monitor | 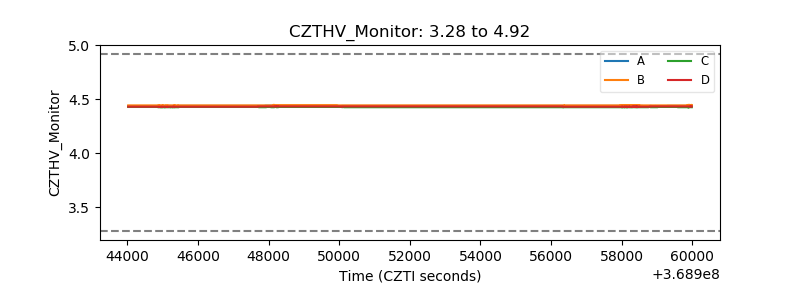 |
| D_VDD | 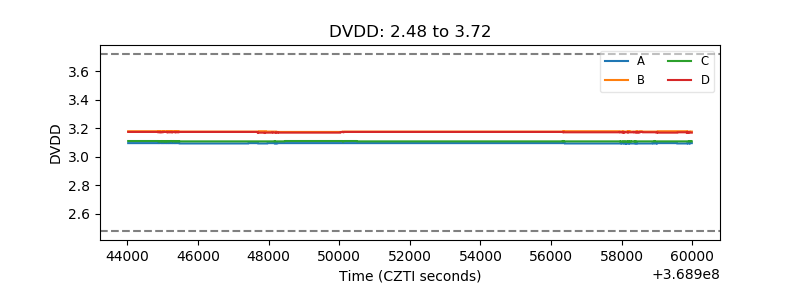 |
| Temperature 1 | 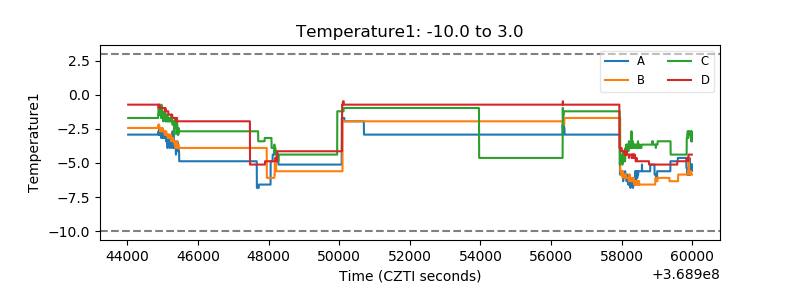 |
| Veto HV Monitor | 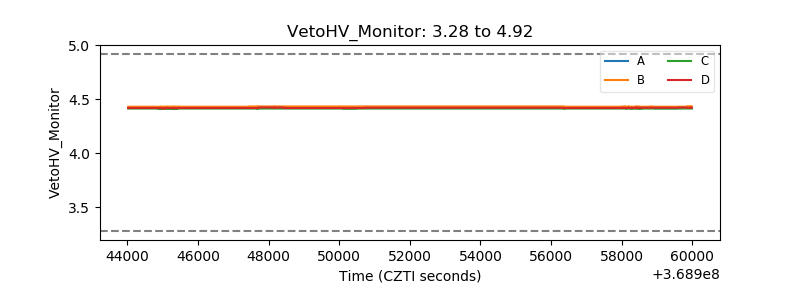 |
| Veto LLD |  |
| Alpha Counter |  |
| _CPM_Rate | 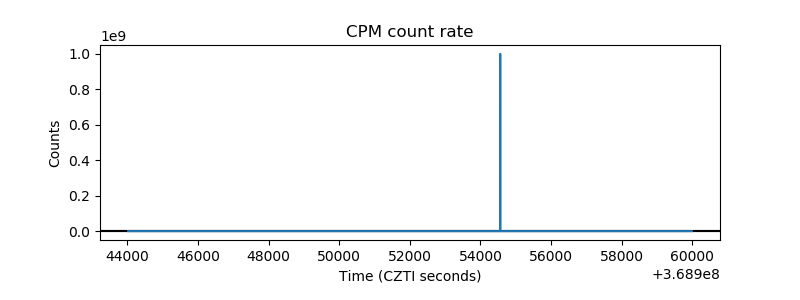 |
| CZT Counter | 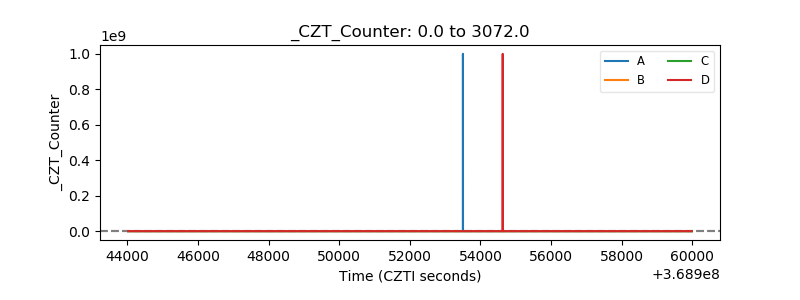 |
| +2.5 Volts monitor |  |
| +5 Volts monitor |  |
| _ROLL_ROT | 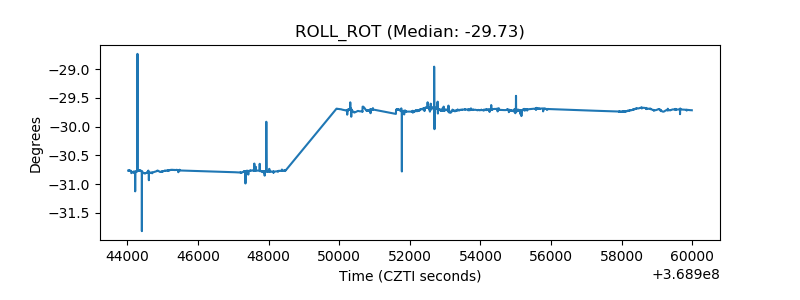 |
| _Roll_DEC | 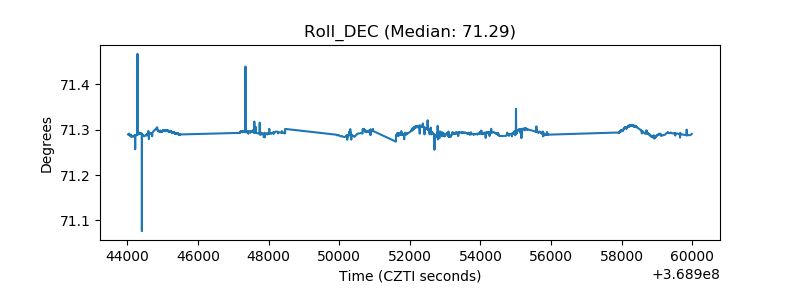 |
| _Roll_RA |  |
| Veto Counter | 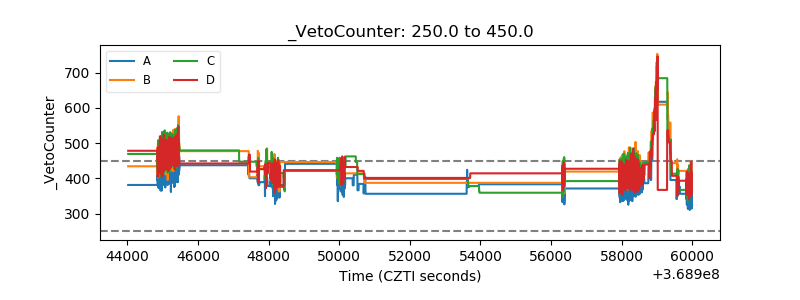 |