| Param | Original file | Final file |
|---|---|---|
| Filename | modeM0/AS1A09_131T01_9000004690_32184cztM0_level2.evt | modeM0/AS1A09_131T01_9000004690_32184cztM0_level2_quad_clean.evt |
| Size (bytes) | 611,144,640 | 111,934,080 |
| Size | 582.8 MB | 106.7 MB |
| Events in quadrant A | 3,248,016 | 746,768 |
| Events in quadrant B | 5,549,689 | 737,983 |
| Events in quadrant C | 4,045,540 | 708,044 |
| Events in quadrant D | 5,188,860 | 706,836 |
| Mode SS | |||
|---|---|---|---|
| Quadrant | BADHDUFLAG | Total packets | Discarded packets |
| A | 0 | 142 | 0 |
| B | 0 | 142 | 0 |
| C | 0 | 142 | 0 |
| D | 0 | 142 | 0 |
| Mode M0 | |||
|---|---|---|---|
| Quadrant | BADHDUFLAG | Total packets | Discarded packets |
| A | 0 | 14275 | 2 |
| B | 0 | 22098 | 1 |
| C | 0 | 16524 | 1 |
| D | 0 | 20210 | 8 |
| Mode M9 | |||
|---|---|---|---|
| Quadrant | BADHDUFLAG | Total packets | Discarded packets |
| A | 0 | 3 | 0 |
| B | 0 | 3 | 0 |
| C | 0 | 3 | 0 |
| D | 0 | 3 | 0 |
| Quadrant | Total seconds | Saturated seconds | Saturation percentage |
|---|---|---|---|
| A | 7040 | 62 | 0.880682% |
| B | 7040 | 268 | 3.806818% |
| C | 7040 | 470 | 6.676136% |
| D | 7039 | 261 | 3.707913% |
Noise dominated data is calculated using 1-second bins in cleaned event files. If a bin has >2000 counts, and if more than 50% of those come from <1% of pixels, then it is considered to be noise-dominated and hence unusable.
| Quadrant | # 1 sec bins | Bins with >0 counts | Bins with >2000 counts | High rate bins dominated by noise | Noise dominated (total time) | Noise dominated (detector-on time) | Marked lightcurve |
|---|---|---|---|---|---|---|---|
| A | 7335 | 7041 | 0 | 0 | 0.00% | 0.00% | 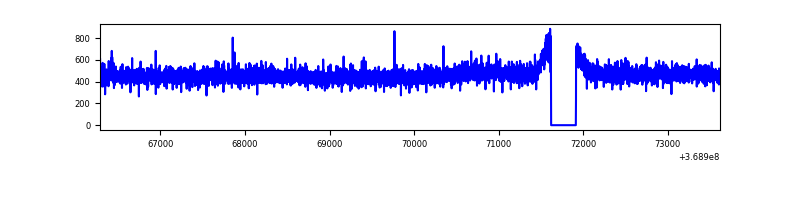 |
| B | 7335 | 7041 | 97 | 97 | 1.32% | 1.38% | 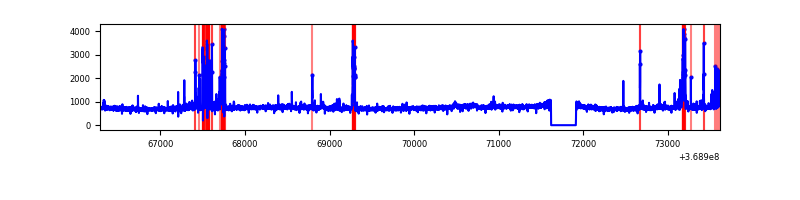 |
| C | 7335 | 7041 | 5 | 5 | 0.07% | 0.07% | 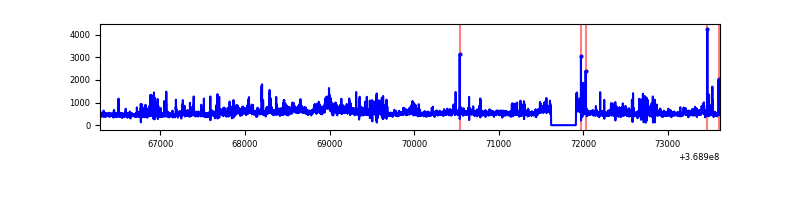 |
| D | 7335 | 7041 | 168 | 168 | 2.29% | 2.39% | 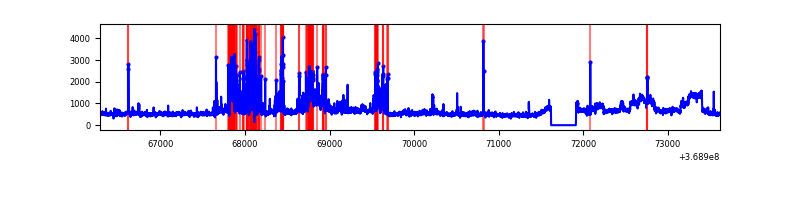 |
Top three noisy pixels from each quadrant. If the there are fewer than three noisy pixels in the level2.evt file, extra rows are filled as -1
| Pixel properties | Quadrant properties | ||||||
|---|---|---|---|---|---|---|---|
| Quadrant | DetID | PixID | Counts | Sigma | Mean | Median | Sigma |
| A | 13 | 6 | 18711 | 106.28 | 836 | 819 | 168.3 |
| A | 13 | 254 | 14272 | 79.91 | 836 | 819 | 168.3 |
| A | 3 | 137 | 8504 | 45.65 | 836 | 819 | 168.3 |
| B | 6 | 159 | 1850653 | 11803.27 | 818 | 796 | 156.7 |
| B | 5 | 172 | 359967 | 2291.74 | 818 | 796 | 156.7 |
| B | 0 | 190 | 68659 | 433.01 | 818 | 796 | 156.7 |
| C | 3 | 233 | 405997 | 2204.6 | 782 | 784 | 183.8 |
| C | 14 | 238 | 245036 | 1328.88 | 782 | 784 | 183.8 |
| C | 14 | 254 | 159323 | 862.55 | 782 | 784 | 183.8 |
| D | 8 | 195 | 1216248 | 6379.22 | 799 | 776 | 190.5 |
| D | 12 | 218 | 390526 | 2045.54 | 799 | 776 | 190.5 |
| D | 7 | 38 | 182360 | 953.01 | 799 | 776 | 190.5 |
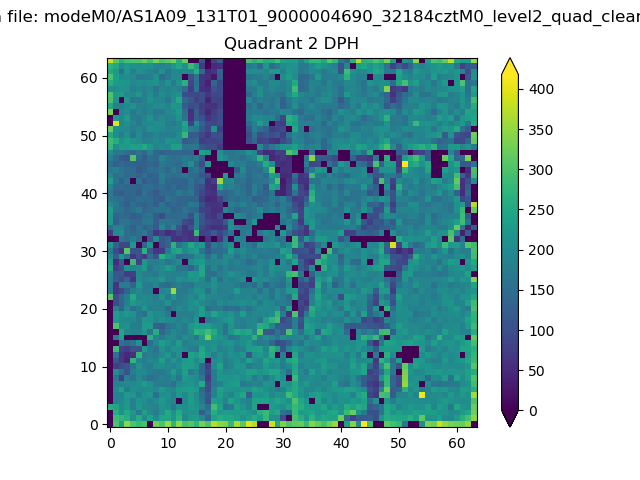
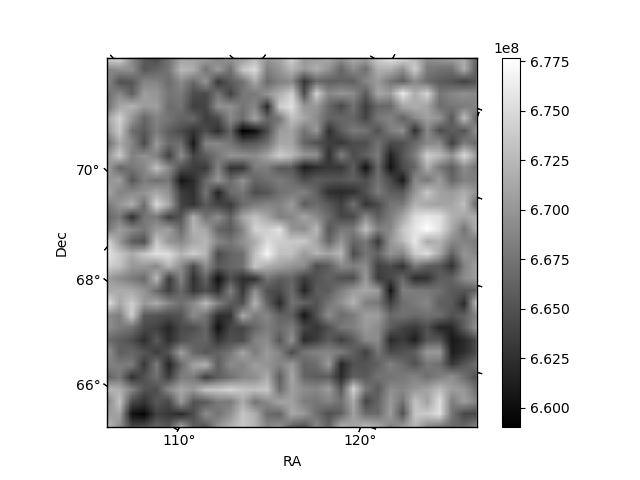
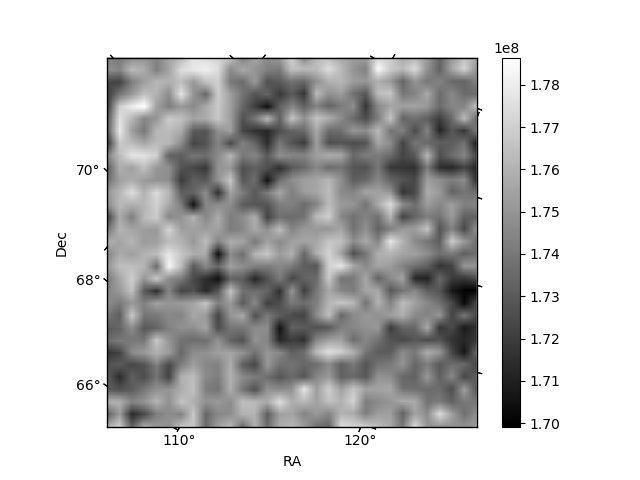
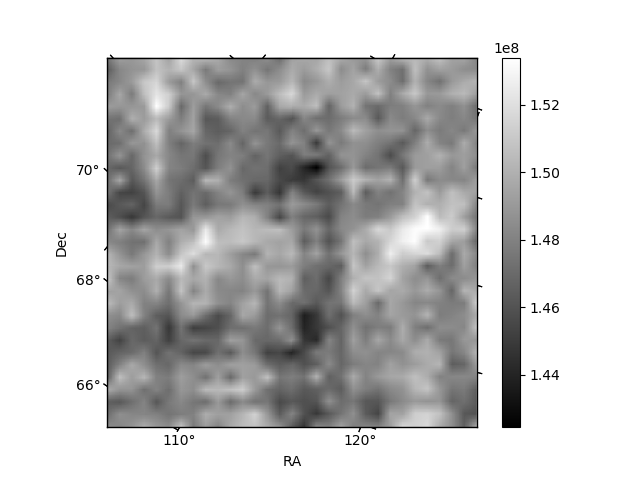
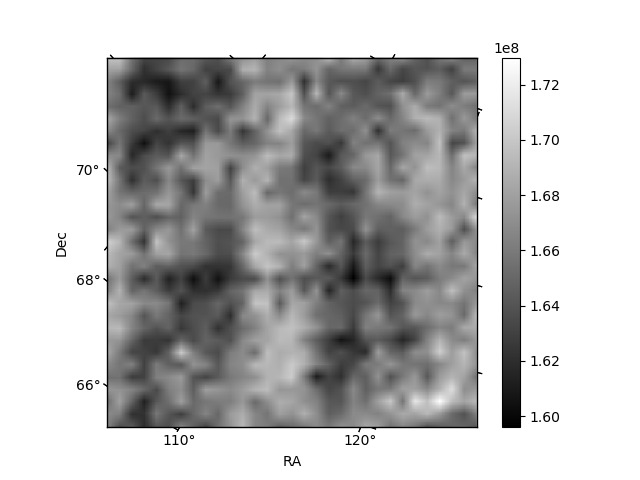
Histogram calculated using DETX and DETY for each event in the final _common_clean file
| Quadrant A | 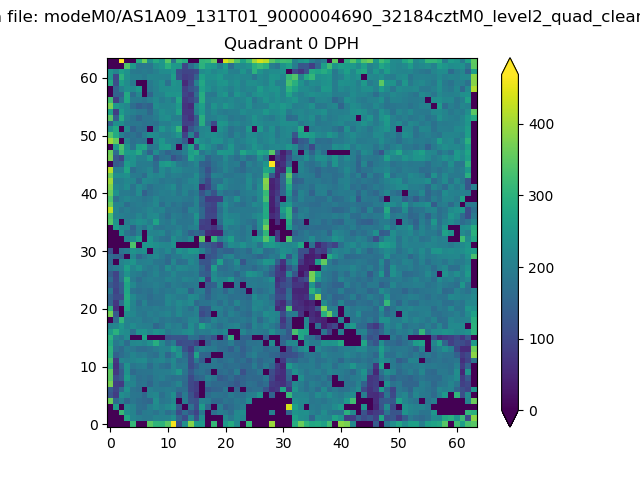 |
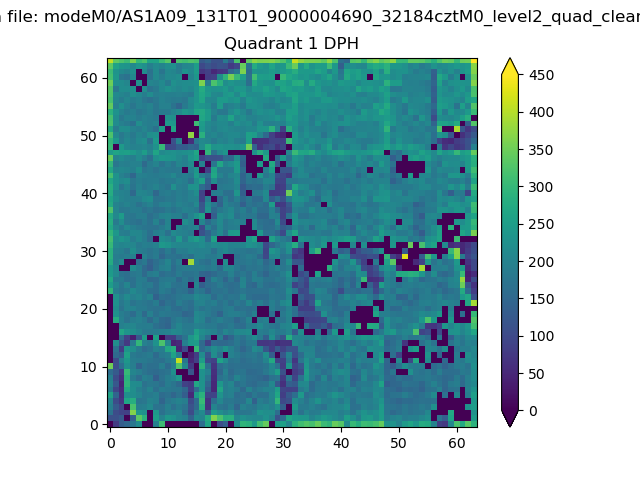 |
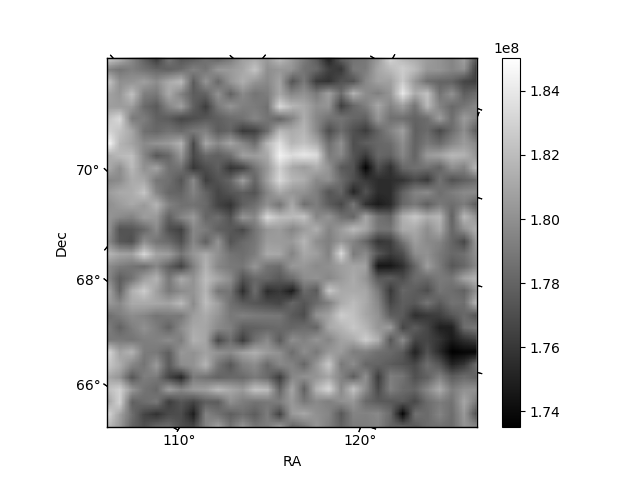
Quadrant B |
|---|---|---|---|
| Quadrant D | 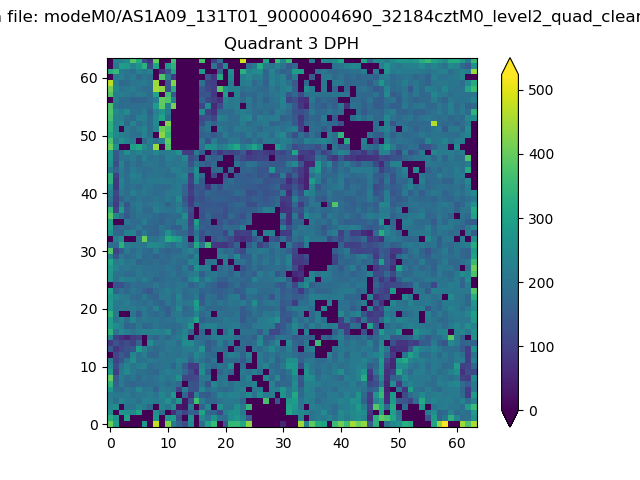 |
 |
Quadrant C |
| Plot type | Count rate plots | Images |
|---|---|---|
| Comparison with Poisson distribution Blue bars denote a histogram of data divided into 1 sec bins. Red curve is a Poisson curve with rate = median count rate of data. |
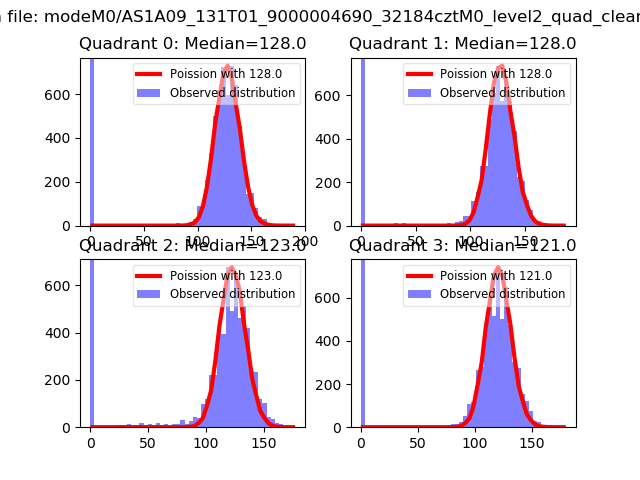 |
 |
| Quadrant-wise count rates Data is divided into 100 sec bins |
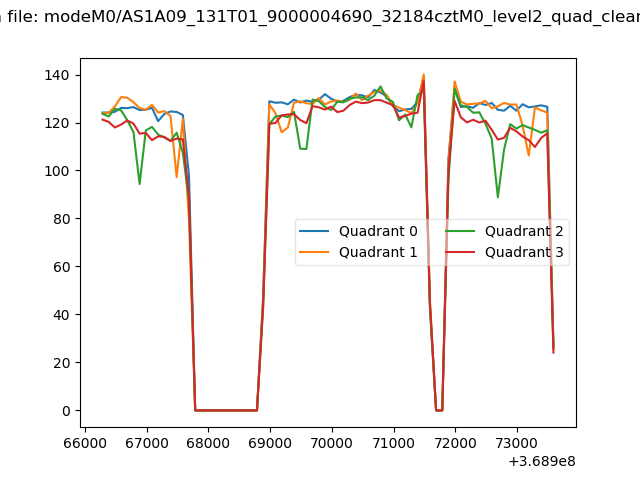 |
|
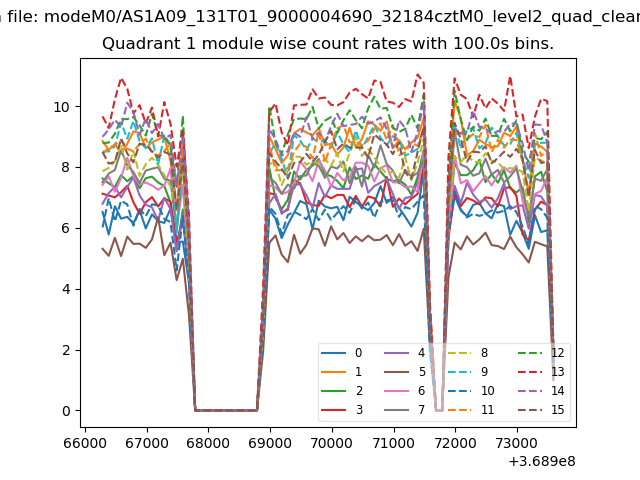
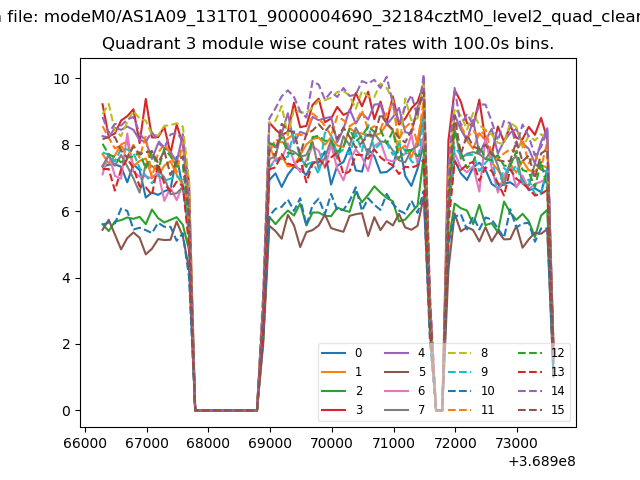
| Module-wise count rates for Quadrant A Data is divided into 100 sec bins |
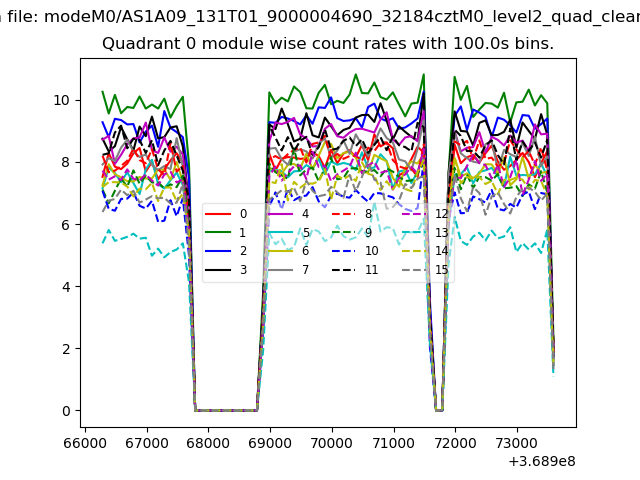 |
 |
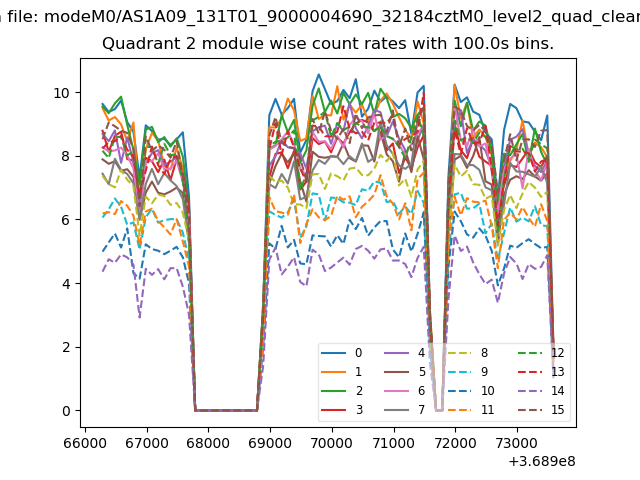
| Module-wise count rates for Quadrant B Data is divided into 100 sec bins |
 |
 |
| Module-wise count rates for Quadrant C Data is divided into 100 sec bins |
 |
 |
| Module-wise count rates for Quadrant D Data is divided into 100 sec bins |
 |
 |
| Parameter | Plot |
|---|---|
| CZT HV Monitor | 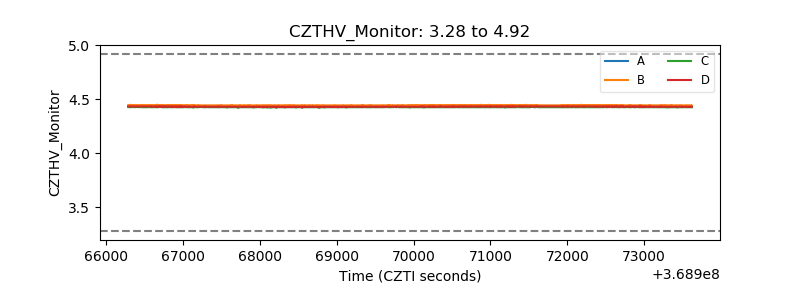 |
| D_VDD | 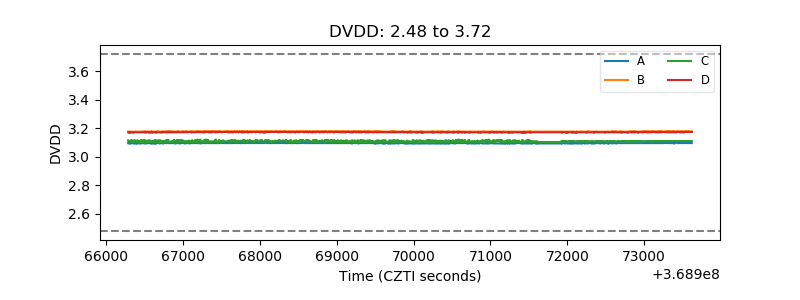 |
| Temperature 1 | 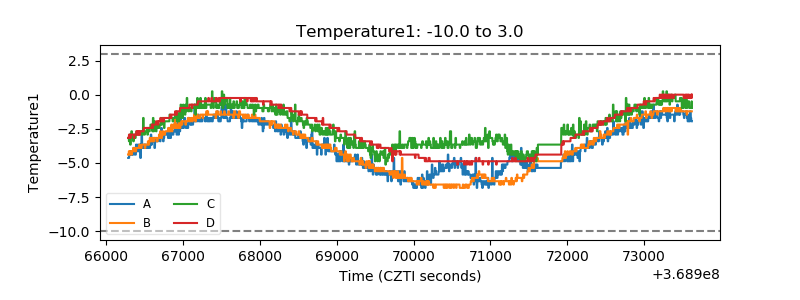 |
| Veto HV Monitor | 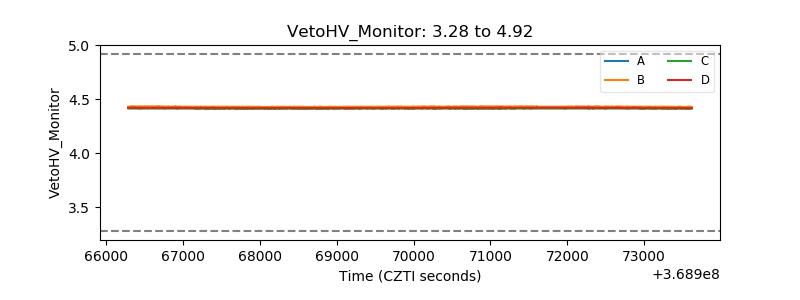 |
| Veto LLD | 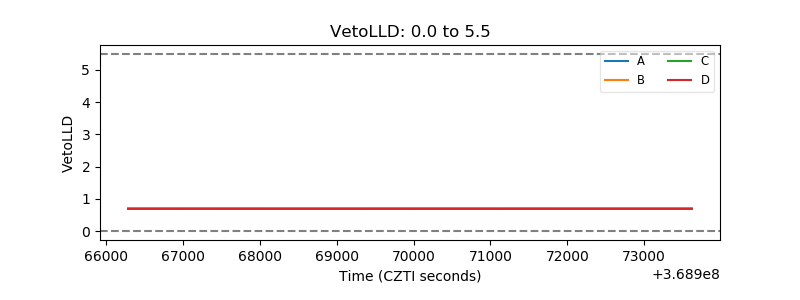 |
| Alpha Counter | 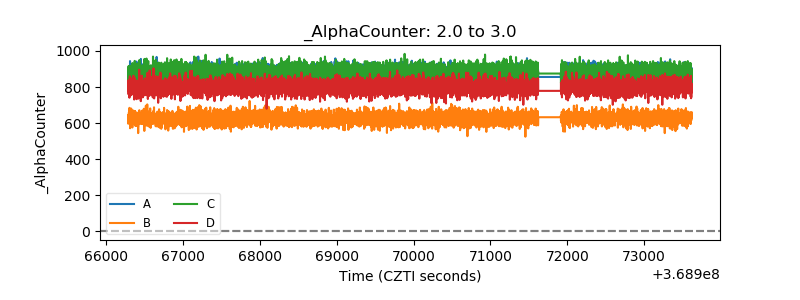 |
| _CPM_Rate | 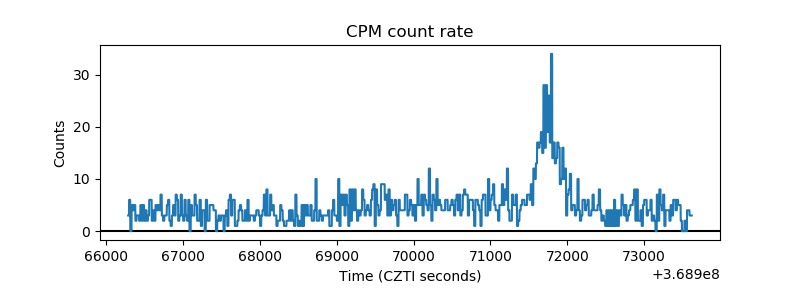 |
| CZT Counter | 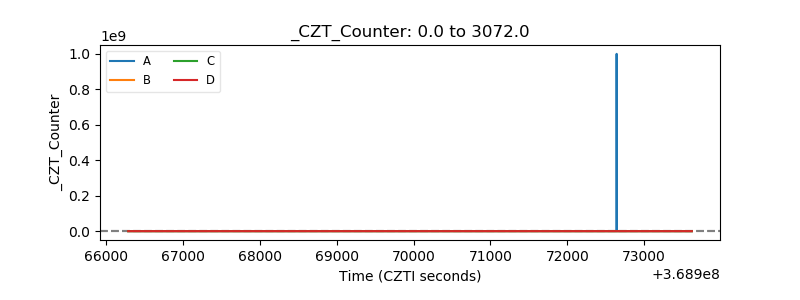 |
| +2.5 Volts monitor |  |
| +5 Volts monitor |  |
| _ROLL_ROT | 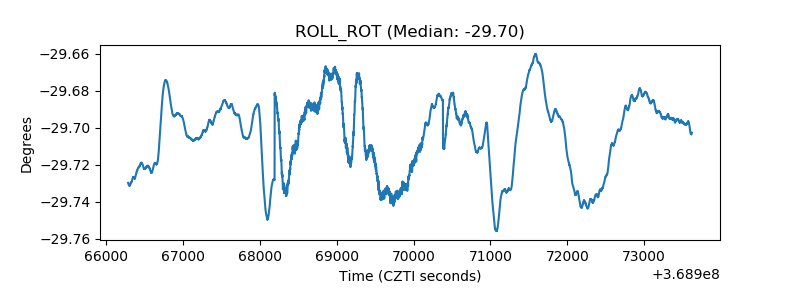 |
| _Roll_DEC | 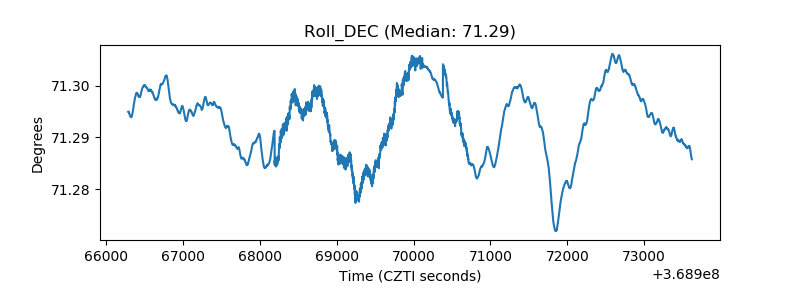 |
| _Roll_RA | 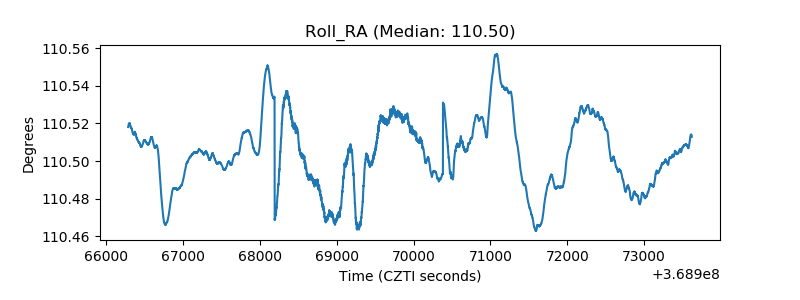 |
| Veto Counter | 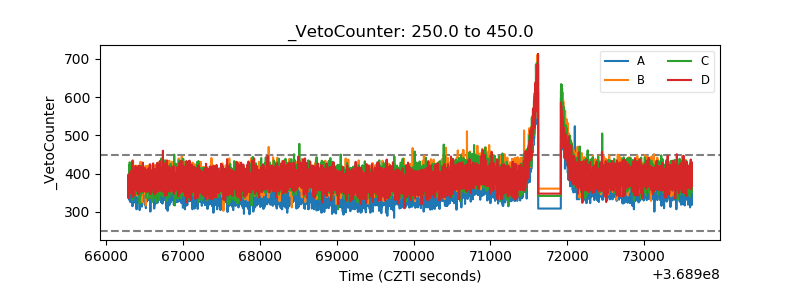 |