| Param | Original file | Final file |
|---|---|---|
| Filename | modeM0/AS1A09_131T01_9000004690_32186cztM0_level2.evt | modeM0/AS1A09_131T01_9000004690_32186cztM0_level2_quad_clean.evt |
| Size (bytes) | 1,124,807,040 | 179,046,720 |
| Size | 1.0 GB | 170.8 MB |
| Events in quadrant A | 5,795,969 | 1,172,746 |
| Events in quadrant B | 10,235,100 | 1,157,678 |
| Events in quadrant C | 7,747,869 | 1,121,950 |
| Events in quadrant D | 9,447,901 | 1,110,575 |
| Mode SS | |||
|---|---|---|---|
| Quadrant | BADHDUFLAG | Total packets | Discarded packets |
| A | 0 | 254 | 0 |
| B | 0 | 254 | 0 |
| C | 0 | 254 | 0 |
| D | 0 | 254 | 0 |
| Mode M0 | |||
|---|---|---|---|
| Quadrant | BADHDUFLAG | Total packets | Discarded packets |
| A | 0 | 25263 | 3 |
| B | 0 | 39611 | 2 |
| C | 0 | 31054 | 2 |
| D | 0 | 36650 | 2 |
| Mode M9 | |||
|---|---|---|---|
| Quadrant | BADHDUFLAG | Total packets | Discarded packets |
| A | 0 | 11 | 0 |
| B | 0 | 11 | 0 |
| C | 0 | 11 | 0 |
| D | 0 | 11 | 0 |
| Quadrant | Total seconds | Saturated seconds | Saturation percentage |
|---|---|---|---|
| A | 12429 | 120 | 0.965484% |
| B | 12429 | 506 | 4.071124% |
| C | 12429 | 641 | 5.157293% |
| D | 12429 | 352 | 2.832086% |
Noise dominated data is calculated using 1-second bins in cleaned event files. If a bin has >2000 counts, and if more than 50% of those come from <1% of pixels, then it is considered to be noise-dominated and hence unusable.
| Quadrant | # 1 sec bins | Bins with >0 counts | Bins with >2000 counts | High rate bins dominated by noise | Noise dominated (total time) | Noise dominated (detector-on time) | Marked lightcurve |
|---|---|---|---|---|---|---|---|
| A | 13589 | 12431 | 0 | 0 | 0.00% | 0.00% | 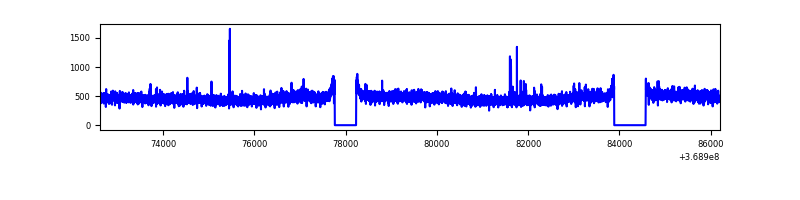 |
| B | 13589 | 12429 | 167 | 167 | 1.23% | 1.34% | 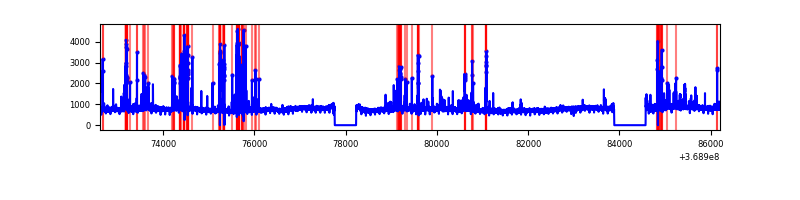 |
| C | 13589 | 12431 | 13 | 13 | 0.10% | 0.10% | 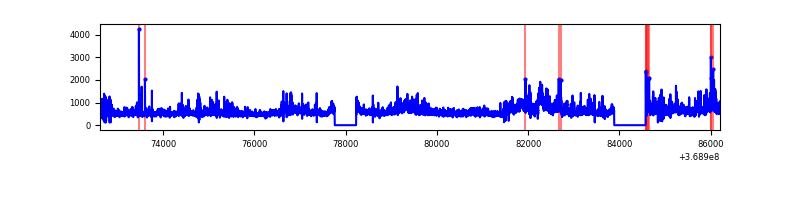 |
| D | 13589 | 12431 | 198 | 198 | 1.46% | 1.59% | 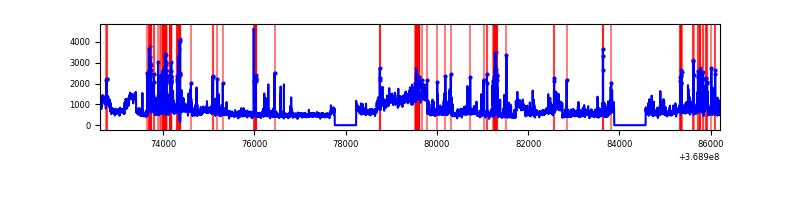 |
Top three noisy pixels from each quadrant. If the there are fewer than three noisy pixels in the level2.evt file, extra rows are filled as -1
| Pixel properties | Quadrant properties | ||||||
|---|---|---|---|---|---|---|---|
| Quadrant | DetID | PixID | Counts | Sigma | Mean | Median | Sigma |
| A | 13 | 6 | 31231 | 99.99 | 1486 | 1453 | 297.8 |
| A | 13 | 254 | 24128 | 76.14 | 1486 | 1453 | 297.8 |
| A | 12 | 96 | 15858 | 48.37 | 1486 | 1453 | 297.8 |
| B | 6 | 159 | 3466508 | 12501.25 | 1454 | 1416 | 277.2 |
| B | 5 | 172 | 602793 | 2169.63 | 1454 | 1416 | 277.2 |
| B | 0 | 190 | 186409 | 667.41 | 1454 | 1416 | 277.2 |
| C | 3 | 233 | 1384486 | 4223.71 | 1400 | 1407 | 327.5 |
| C | 14 | 238 | 351768 | 1069.95 | 1400 | 1407 | 327.5 |
| C | 0 | 10 | 309354 | 940.42 | 1400 | 1407 | 327.5 |
| D | 8 | 195 | 2675470 | 7850.6 | 1431 | 1389 | 340.6 |
| D | 12 | 218 | 532960 | 1560.59 | 1431 | 1389 | 340.6 |
| D | 14 | 52 | 237431 | 692.97 | 1431 | 1389 | 340.6 |
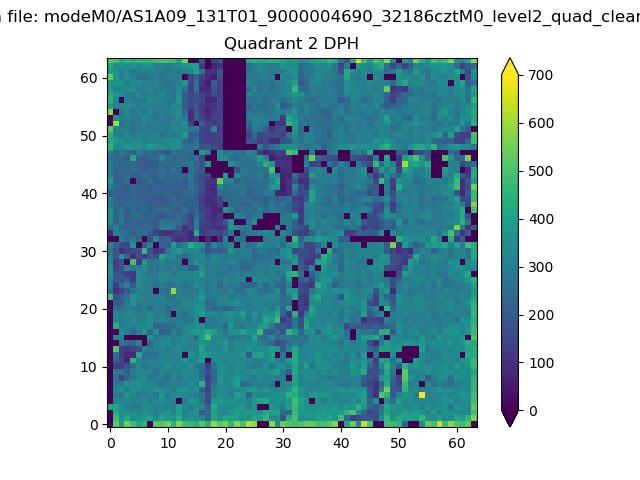
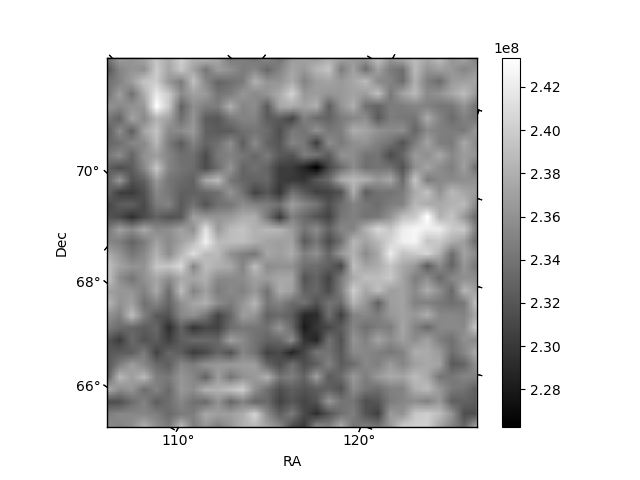
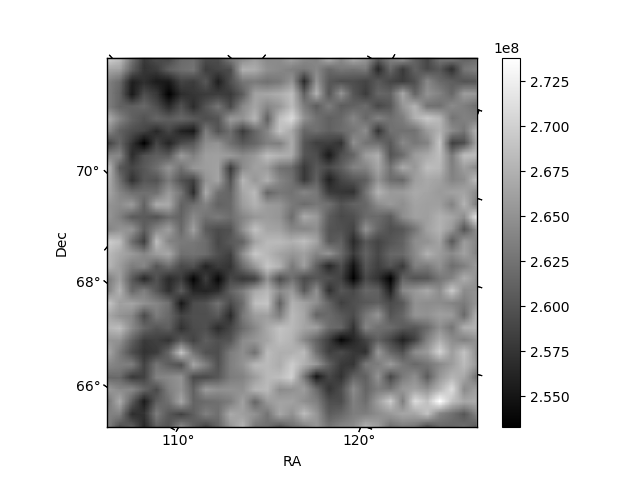
Histogram calculated using DETX and DETY for each event in the final _common_clean file
| Quadrant A | 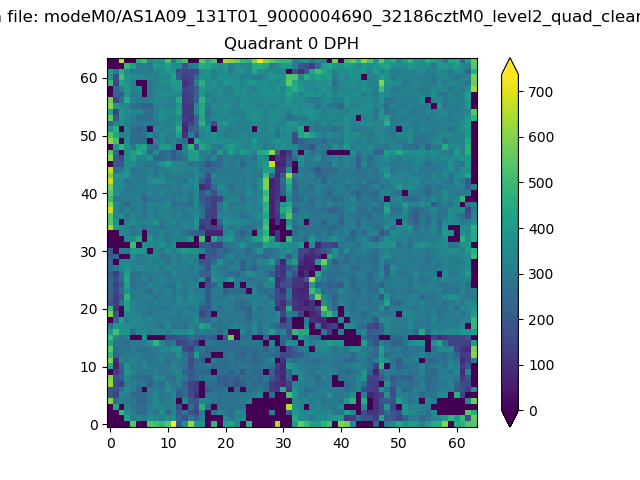 |
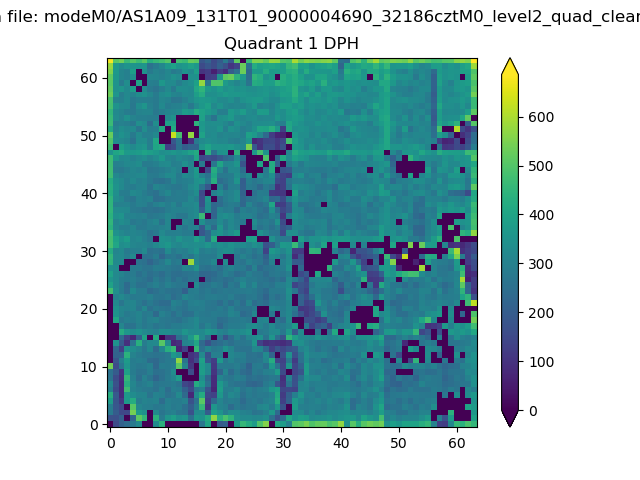 |
Quadrant B |
|---|---|---|---|
| Quadrant D | 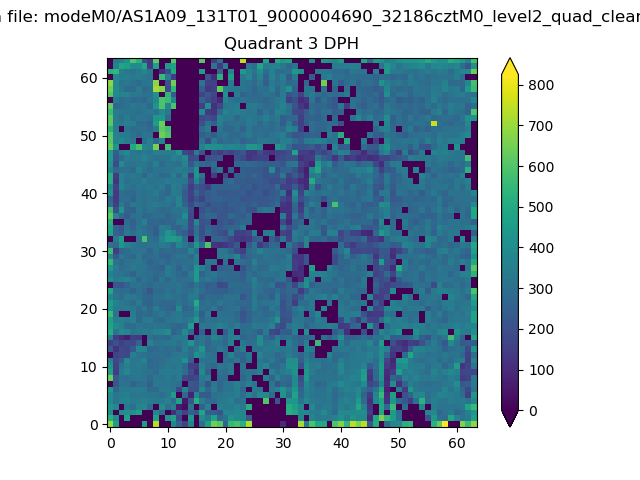 |
 |
Quadrant C |
| Plot type | Count rate plots | Images |
|---|---|---|
| Comparison with Poisson distribution Blue bars denote a histogram of data divided into 1 sec bins. Red curve is a Poisson curve with rate = median count rate of data. |
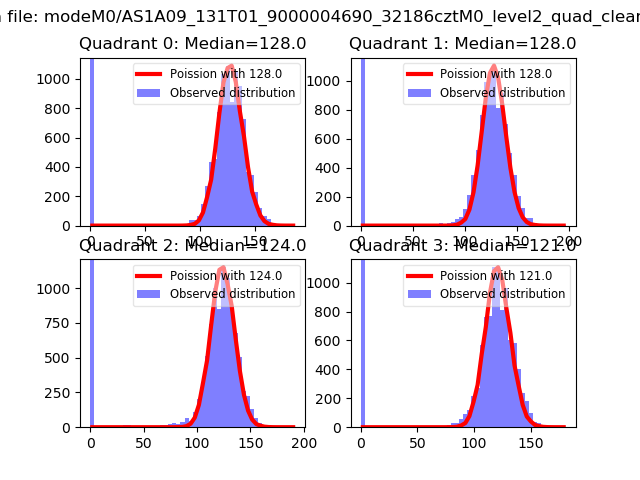 |
 |
| Quadrant-wise count rates Data is divided into 100 sec bins |
 |
|
| Module-wise count rates for Quadrant A Data is divided into 100 sec bins |
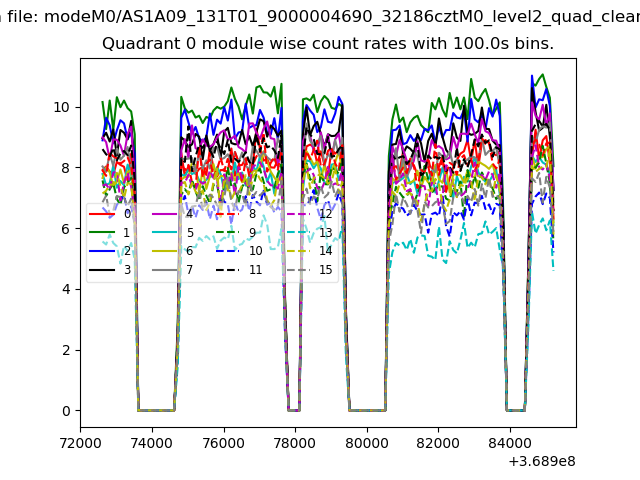 |
 |
| Module-wise count rates for Quadrant B Data is divided into 100 sec bins |
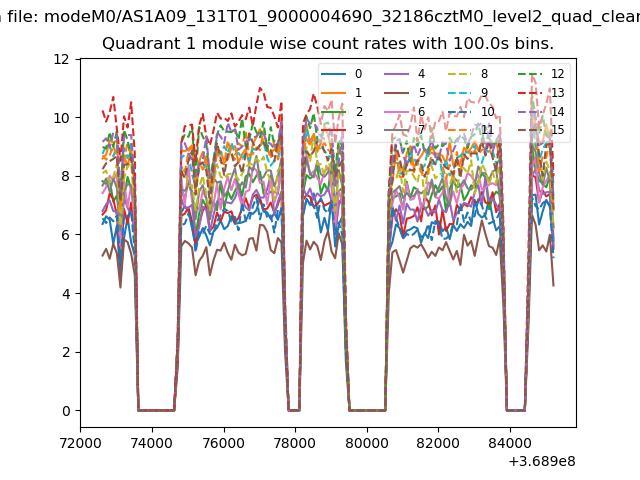 |
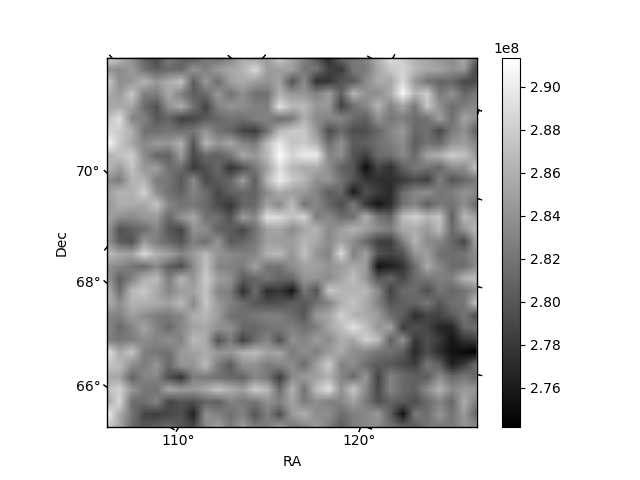 |
| Module-wise count rates for Quadrant C Data is divided into 100 sec bins |
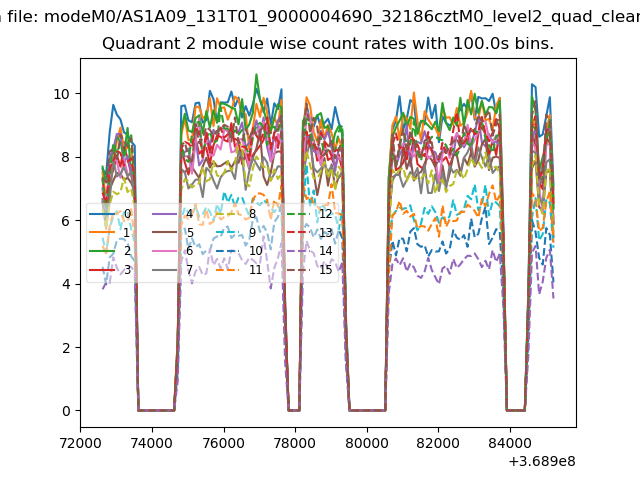 |
 |
| Module-wise count rates for Quadrant D Data is divided into 100 sec bins |
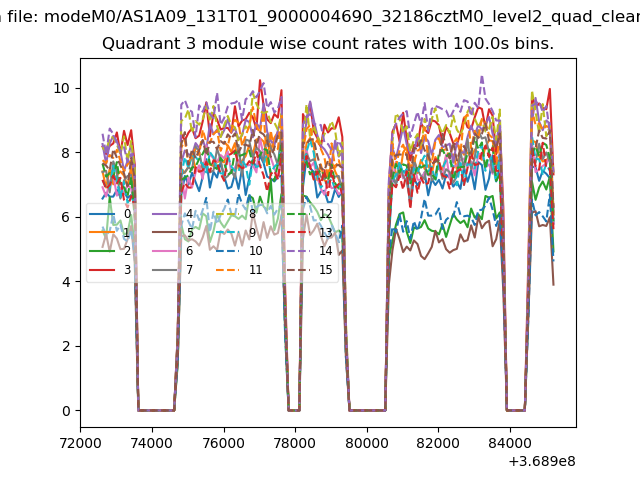 |
 |
| Parameter | Plot |
|---|---|
| CZT HV Monitor | 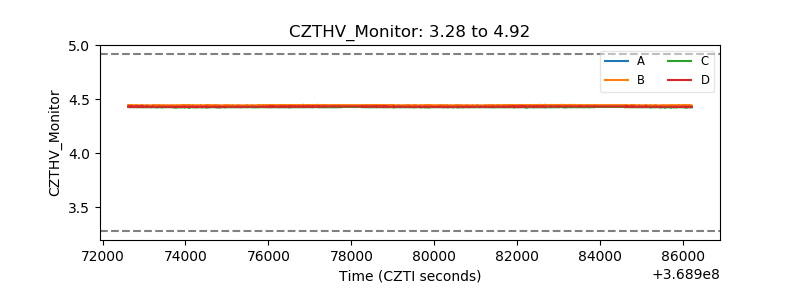 |
| D_VDD | 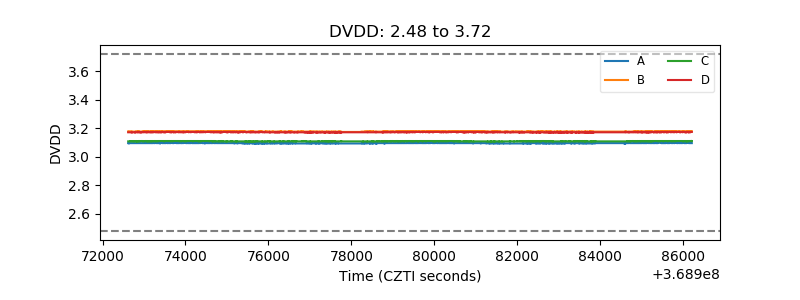 |
| Temperature 1 | 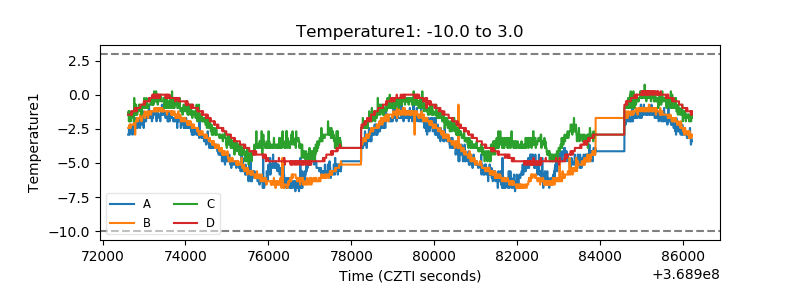 |
| Veto HV Monitor | 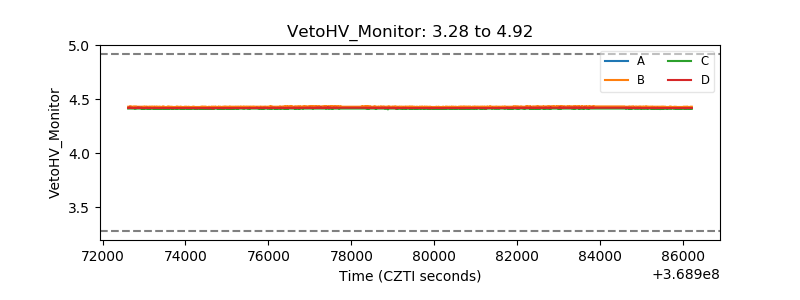 |
| Veto LLD | 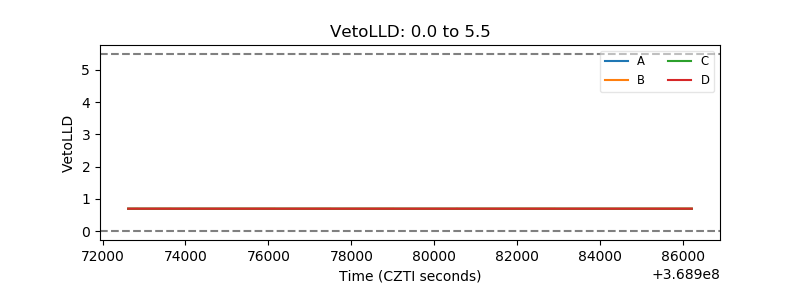 |
| Alpha Counter | 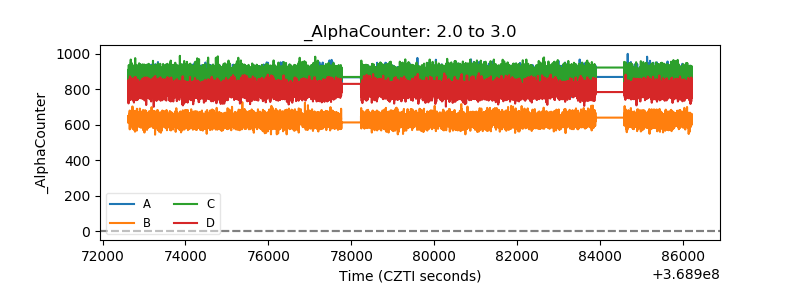 |
| _CPM_Rate | 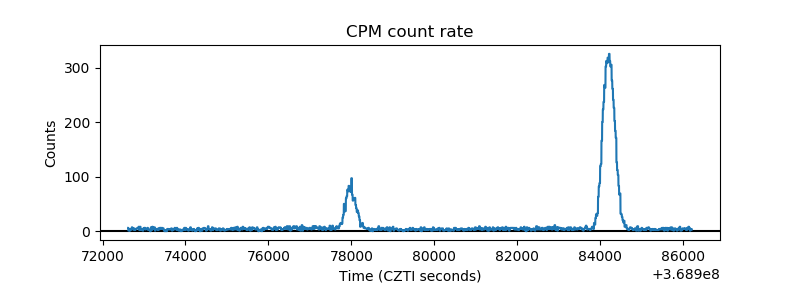 |
| CZT Counter | 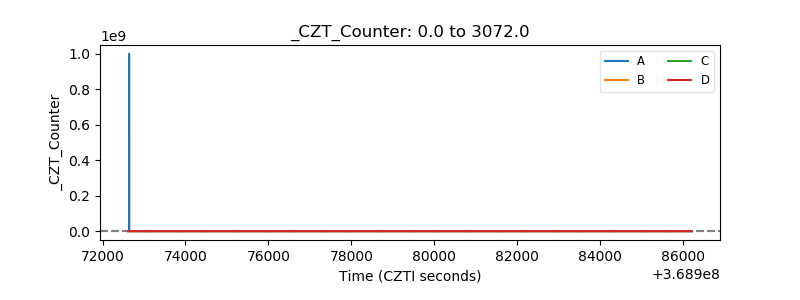 |
| +2.5 Volts monitor |  |
| +5 Volts monitor |  |
| _ROLL_ROT | 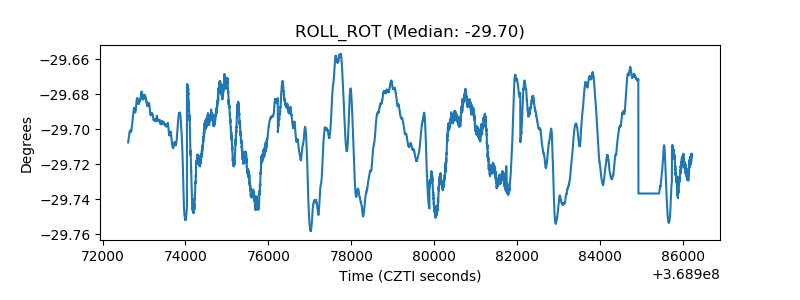 |
| _Roll_DEC | 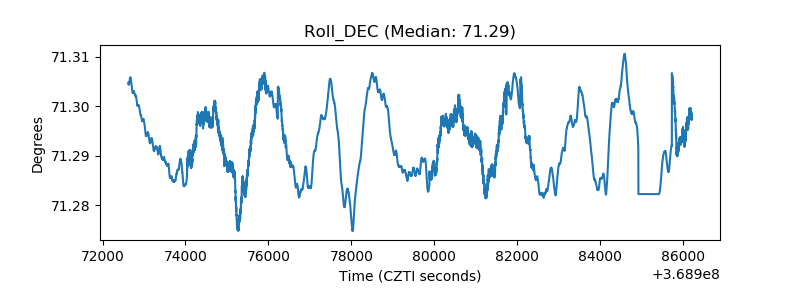 |
| _Roll_RA | 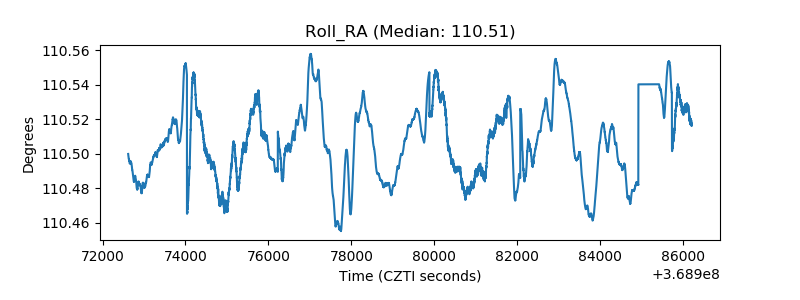 |
| Veto Counter | 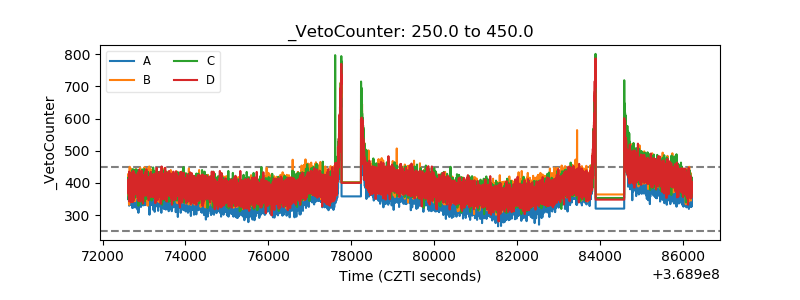 |