| Param | Original file | Final file |
|---|---|---|
| Filename | modeM0/AS1A09_131T01_9000004690_32187cztM0_level2.evt | modeM0/AS1A09_131T01_9000004690_32187cztM0_level2_quad_clean.evt |
| Size (bytes) | 550,272,960 | 77,880,960 |
| Size | 524.8 MB | 74.3 MB |
| Events in quadrant A | 2,933,732 | 490,455 |
| Events in quadrant B | 5,216,922 | 481,544 |
| Events in quadrant C | 3,827,050 | 477,377 |
| Events in quadrant D | 4,265,826 | 474,470 |
| Mode SS | |||
|---|---|---|---|
| Quadrant | BADHDUFLAG | Total packets | Discarded packets |
| A | 0 | 126 | 0 |
| B | 0 | 126 | 0 |
| C | 0 | 126 | 0 |
| D | 0 | 126 | 0 |
| Mode M0 | |||
|---|---|---|---|
| Quadrant | BADHDUFLAG | Total packets | Discarded packets |
| A | 0 | 12781 | 2 |
| B | 0 | 19971 | 1 |
| C | 0 | 15458 | 1 |
| D | 0 | 16938 | 4 |
| Mode M9 | |||
|---|---|---|---|
| Quadrant | BADHDUFLAG | Total packets | Discarded packets |
| A | 0 | 9 | 0 |
| B | 0 | 9 | 0 |
| C | 0 | 9 | 0 |
| D | 0 | 9 | 0 |
| Quadrant | Total seconds | Saturated seconds | Saturation percentage |
|---|---|---|---|
| A | 6225 | 41 | 0.658635% |
| B | 6225 | 231 | 3.710843% |
| C | 6225 | 382 | 6.136546% |
| D | 6224 | 148 | 2.377892% |
Noise dominated data is calculated using 1-second bins in cleaned event files. If a bin has >2000 counts, and if more than 50% of those come from <1% of pixels, then it is considered to be noise-dominated and hence unusable.
| Quadrant | # 1 sec bins | Bins with >0 counts | Bins with >2000 counts | High rate bins dominated by noise | Noise dominated (total time) | Noise dominated (detector-on time) | Marked lightcurve |
|---|---|---|---|---|---|---|---|
| A | 7125 | 6226 | 2 | 2 | 0.03% | 0.03% | 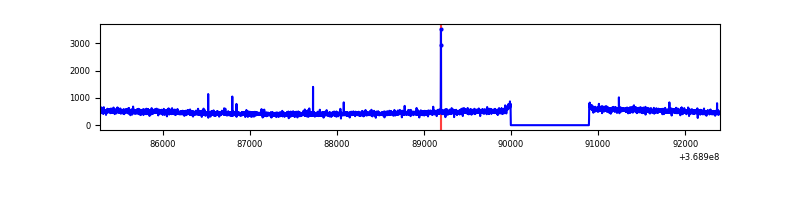 |
| B | 7125 | 6226 | 81 | 81 | 1.14% | 1.30% | 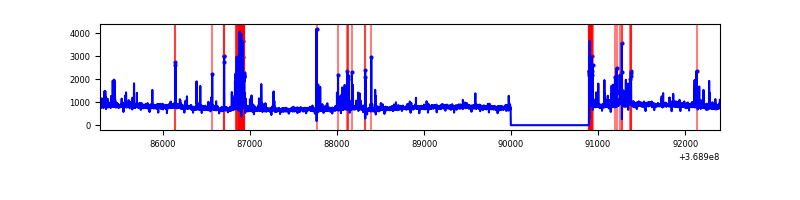 |
| C | 7125 | 6226 | 50 | 50 | 0.70% | 0.80% | 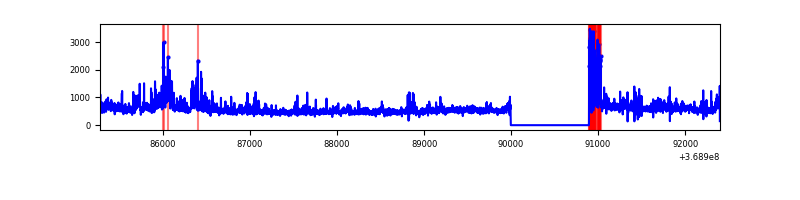 |
| D | 7125 | 6226 | 79 | 79 | 1.11% | 1.27% | 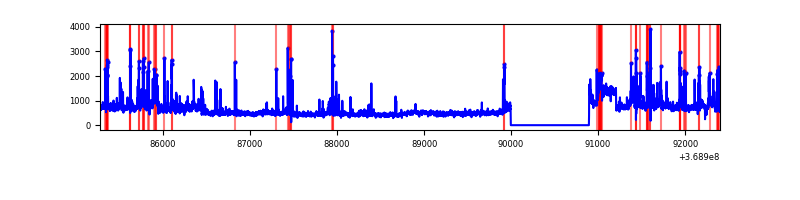 |
Top three noisy pixels from each quadrant. If the there are fewer than three noisy pixels in the level2.evt file, extra rows are filled as -1
| Pixel properties | Quadrant properties | ||||||
|---|---|---|---|---|---|---|---|
| Quadrant | DetID | PixID | Counts | Sigma | Mean | Median | Sigma |
| A | 13 | 6 | 20039 | 128.22 | 750 | 734 | 150.6 |
| A | 13 | 254 | 11791 | 73.44 | 750 | 734 | 150.6 |
| A | 9 | 143 | 9230 | 56.43 | 750 | 734 | 150.6 |
| B | 6 | 159 | 1842709 | 13242.76 | 733 | 715 | 139.1 |
| B | 5 | 172 | 292230 | 2095.81 | 733 | 715 | 139.1 |
| B | 0 | 190 | 74172 | 528.11 | 733 | 715 | 139.1 |
| C | 3 | 233 | 502378 | 3052.22 | 708 | 713 | 164.4 |
| C | 14 | 238 | 190666 | 1155.71 | 708 | 713 | 164.4 |
| C | 0 | 10 | 136054 | 823.44 | 708 | 713 | 164.4 |
| D | 8 | 195 | 819602 | 4709.73 | 727 | 707 | 173.9 |
| D | 12 | 218 | 224677 | 1288.12 | 727 | 707 | 173.9 |
| D | 7 | 38 | 151355 | 866.43 | 727 | 707 | 173.9 |
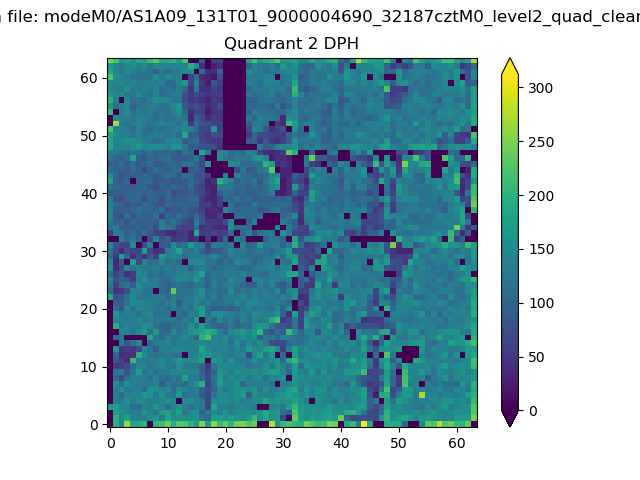
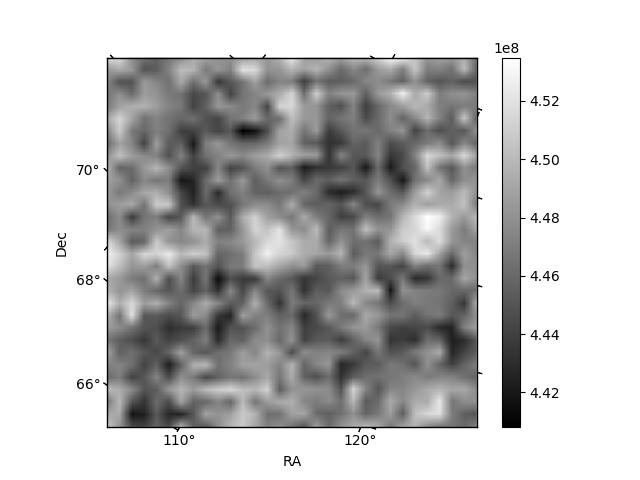
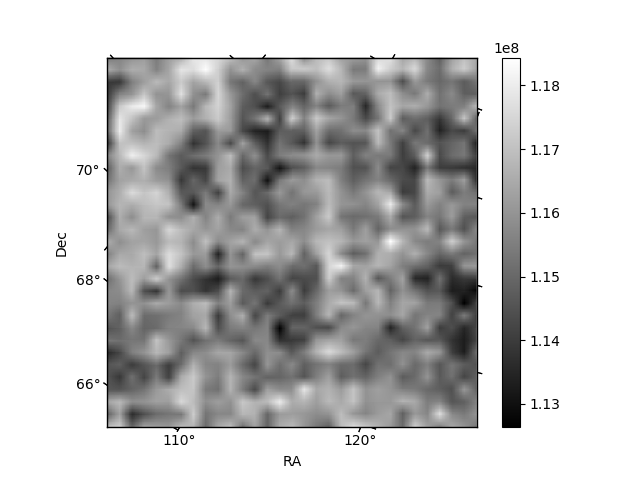
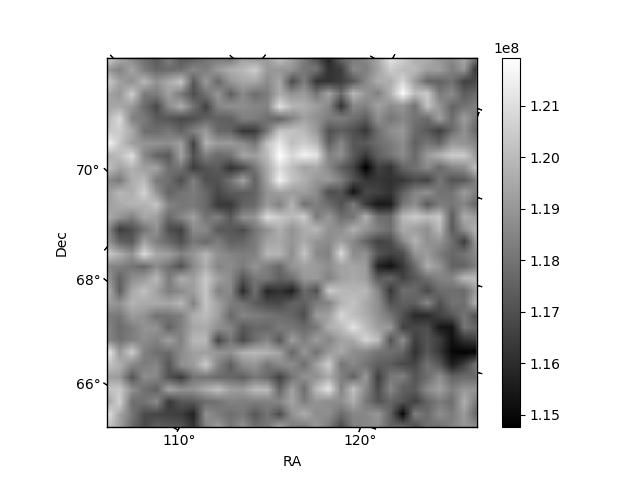
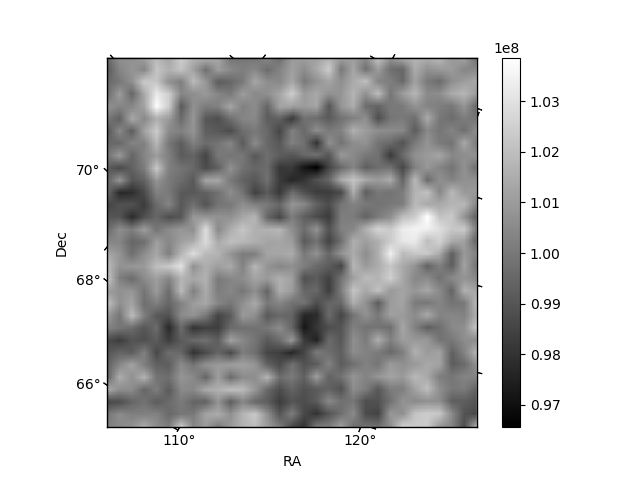
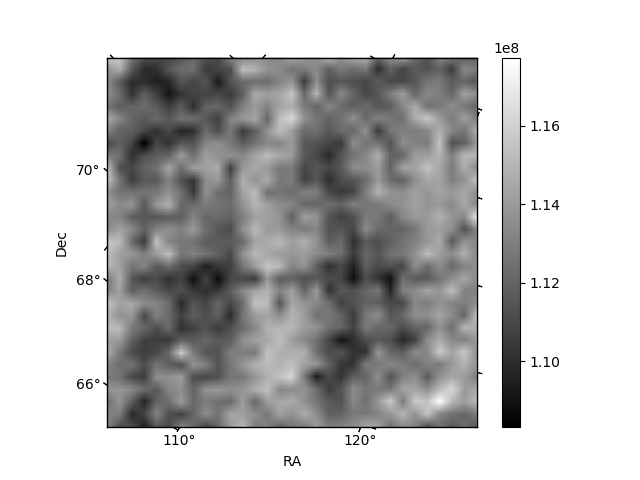
Histogram calculated using DETX and DETY for each event in the final _common_clean file
| Quadrant A | 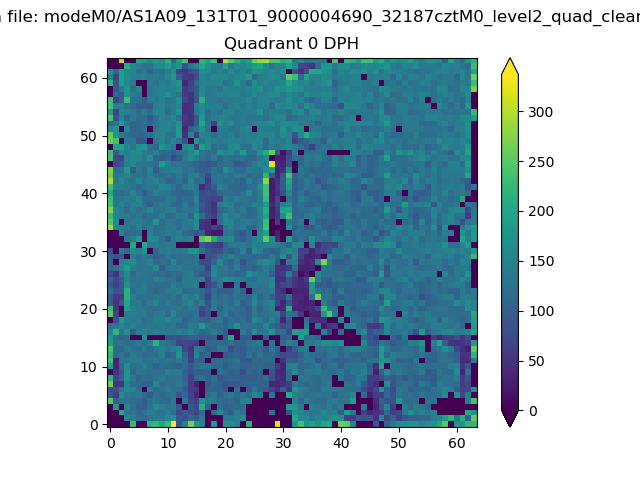 |
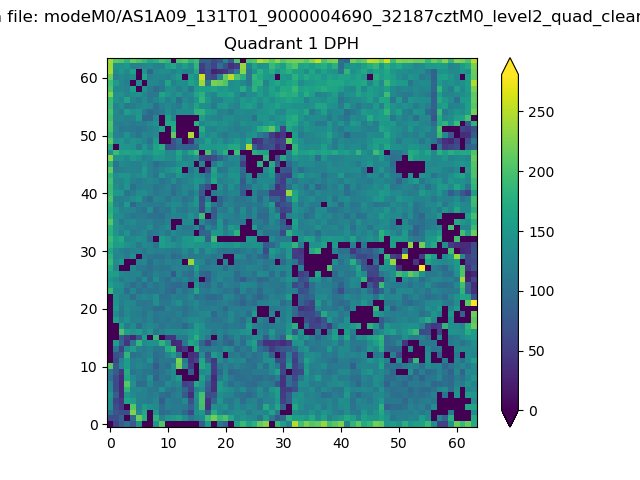 |
Quadrant B |
|---|---|---|---|
| Quadrant D | 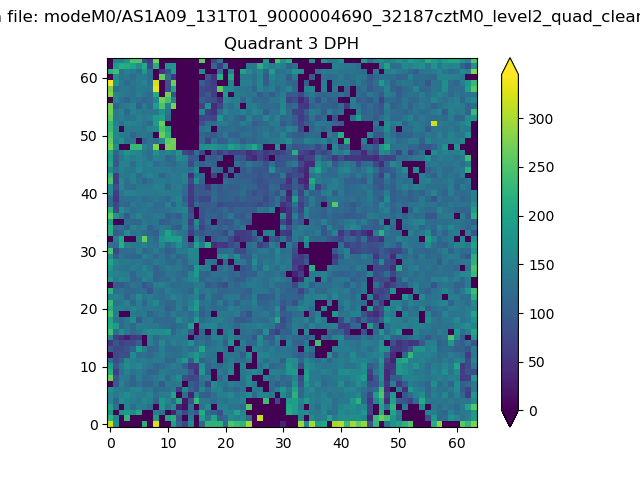 |
 |
Quadrant C |
| Plot type | Count rate plots | Images |
|---|---|---|
| Comparison with Poisson distribution Blue bars denote a histogram of data divided into 1 sec bins. Red curve is a Poisson curve with rate = median count rate of data. |
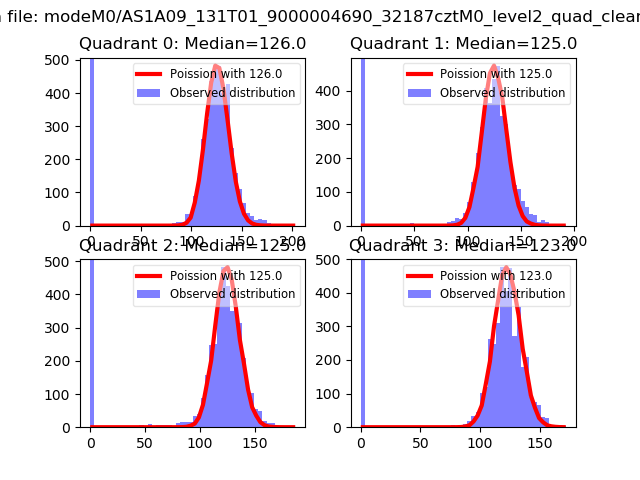 |
 |
| Quadrant-wise count rates Data is divided into 100 sec bins |
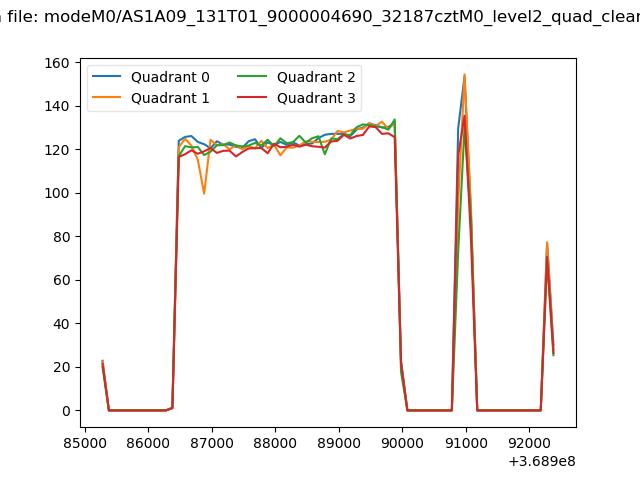 |
|
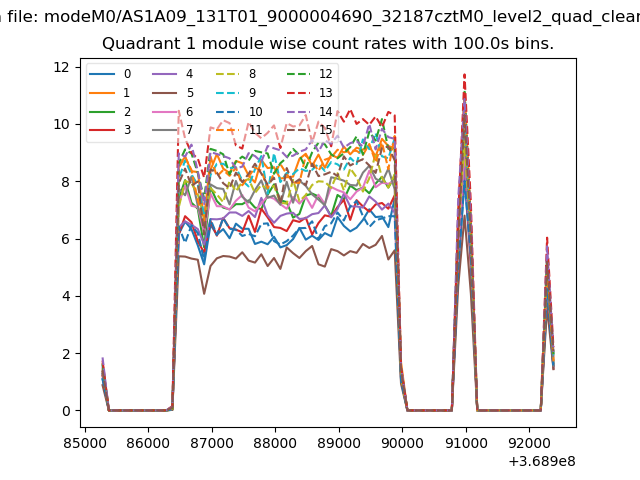
| Module-wise count rates for Quadrant A Data is divided into 100 sec bins |
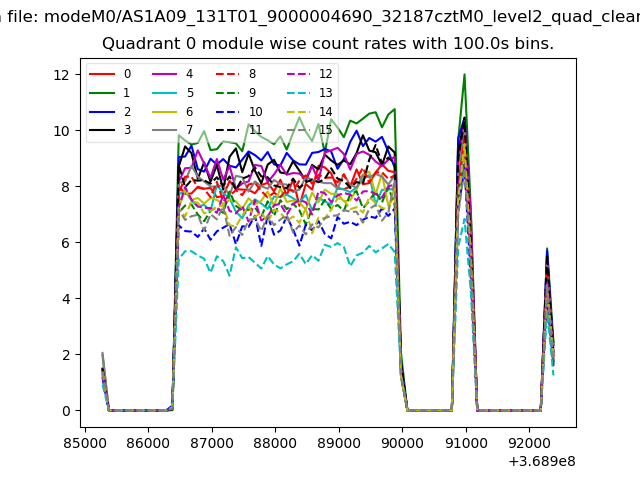 |
 |
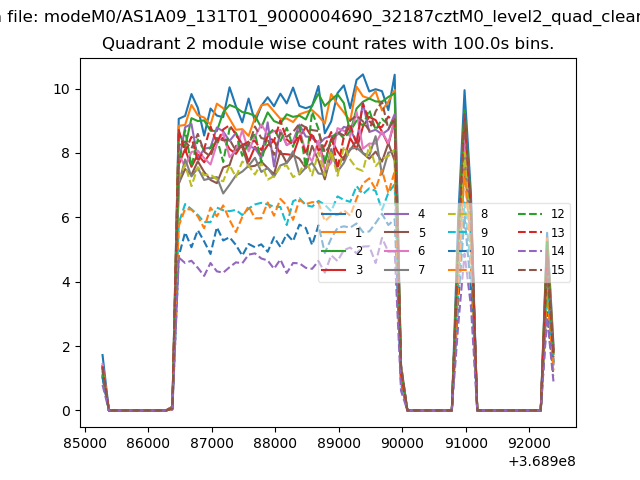
| Module-wise count rates for Quadrant B Data is divided into 100 sec bins |
 |
 |
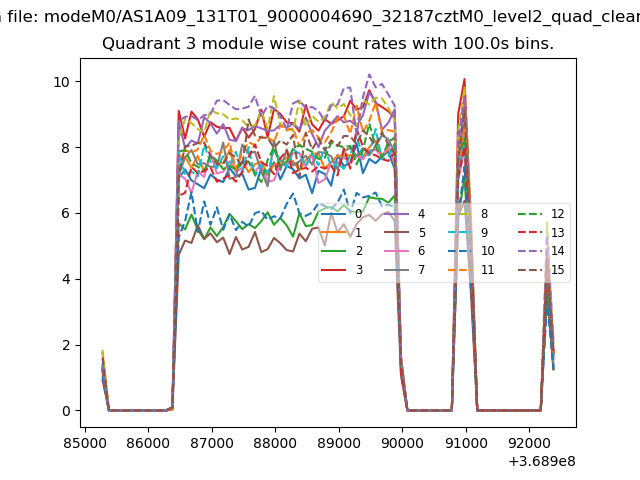
| Module-wise count rates for Quadrant C Data is divided into 100 sec bins |
 |
 |
| Module-wise count rates for Quadrant D Data is divided into 100 sec bins |
 |
 |
| Parameter | Plot |
|---|---|
| CZT HV Monitor | 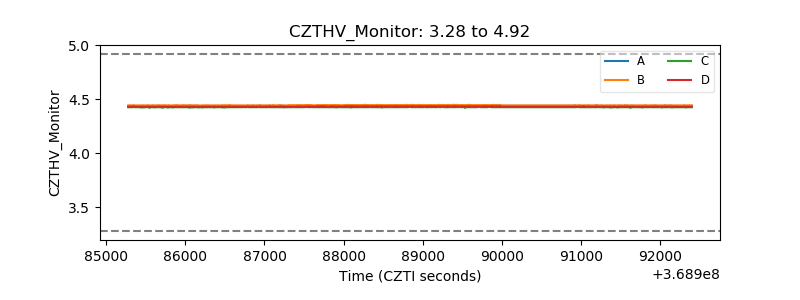 |
| D_VDD | 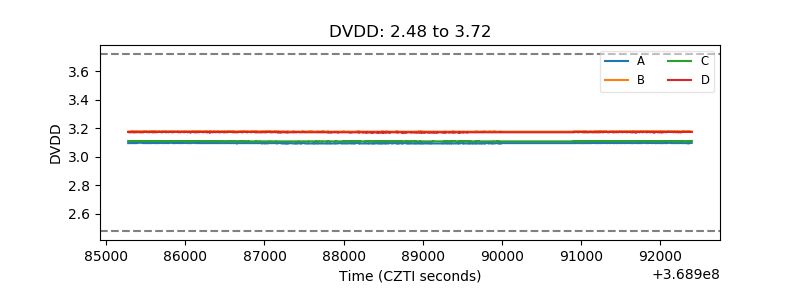 |
| Temperature 1 | 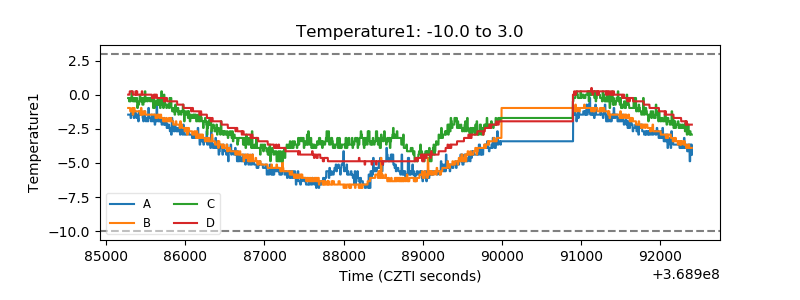 |
| Veto HV Monitor | 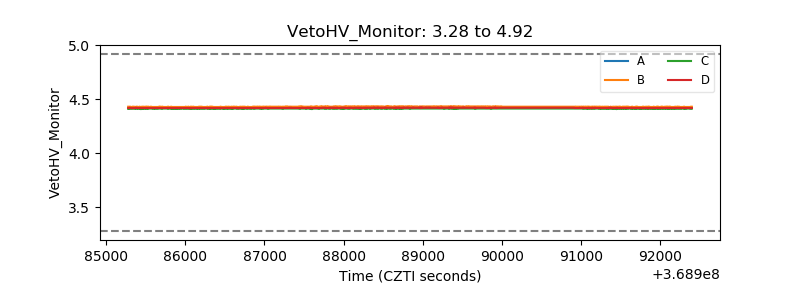 |
| Veto LLD | 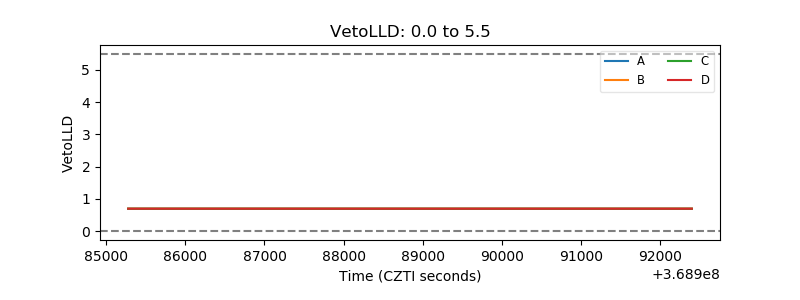 |
| Alpha Counter | 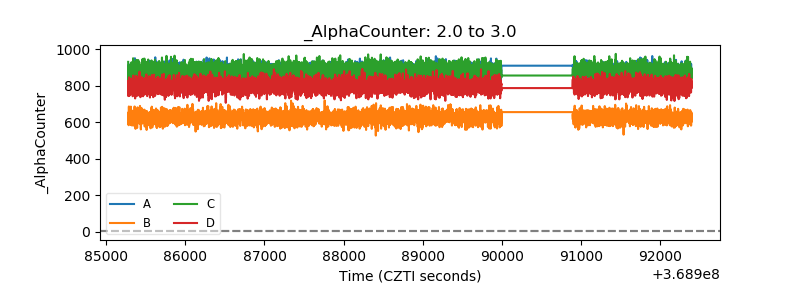 |
| _CPM_Rate | 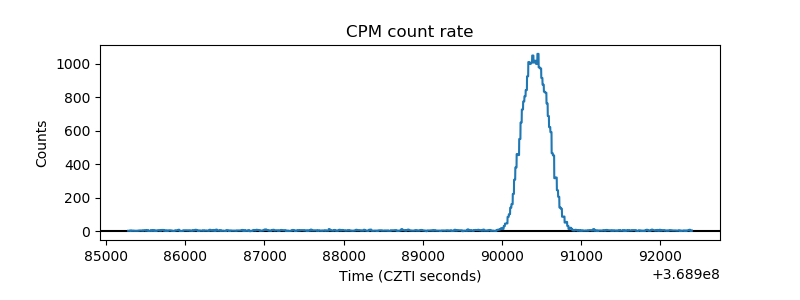 |
| CZT Counter | 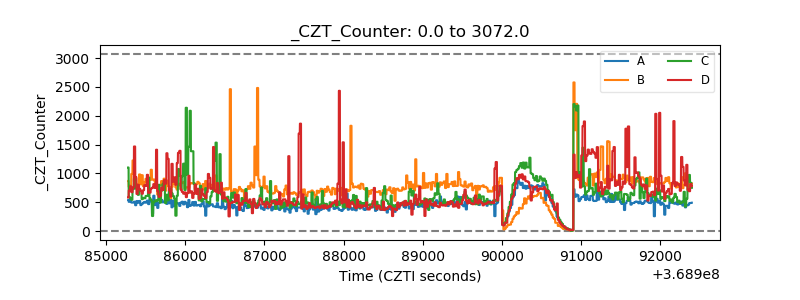 |
| +2.5 Volts monitor |  |
| +5 Volts monitor |  |
| _ROLL_ROT | 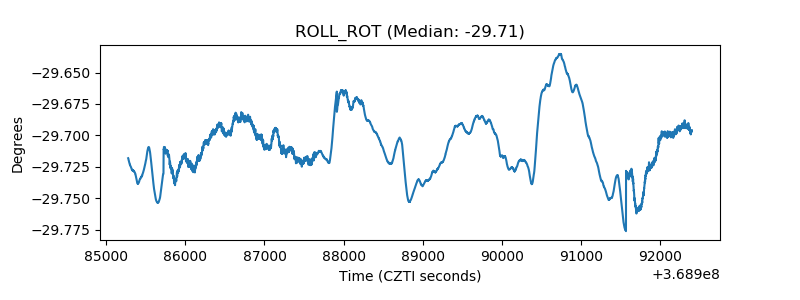 |
| _Roll_DEC | 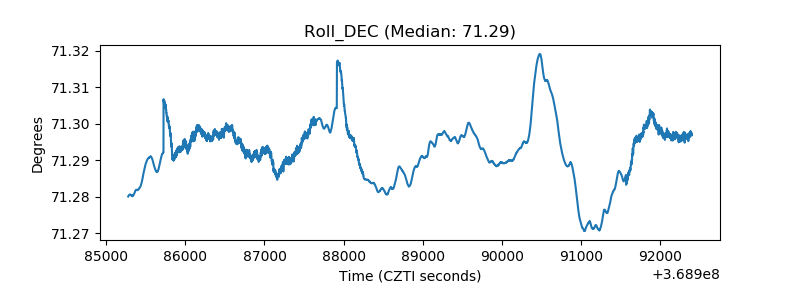 |
| _Roll_RA | 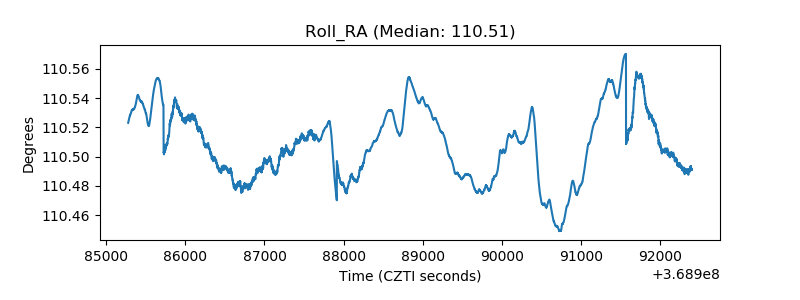 |
| Veto Counter | 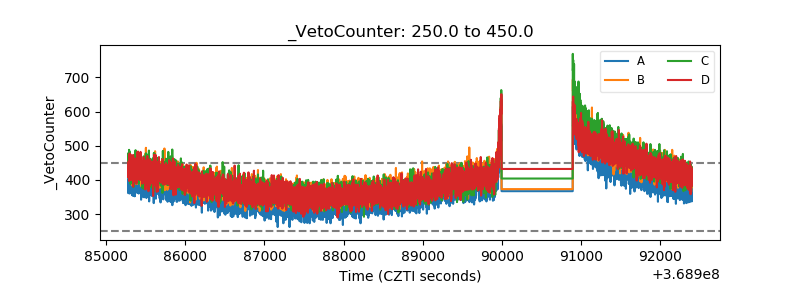 |