| Param | Original file | Final file |
|---|---|---|
| Filename | modeM0/AS1A09_131T01_9000004690_32188cztM0_level2.evt | modeM0/AS1A09_131T01_9000004690_32188cztM0_level2_quad_clean.evt |
| Size (bytes) | 614,903,040 | 87,523,200 |
| Size | 586.4 MB | 83.5 MB |
| Events in quadrant A | 3,161,567 | 559,336 |
| Events in quadrant B | 5,420,999 | 556,861 |
| Events in quadrant C | 4,290,114 | 535,160 |
| Events in quadrant D | 5,308,087 | 543,820 |
| Mode SS | |||
|---|---|---|---|
| Quadrant | BADHDUFLAG | Total packets | Discarded packets |
| A | 0 | 132 | 0 |
| B | 0 | 132 | 0 |
| C | 0 | 132 | 0 |
| D | 0 | 132 | 0 |
| Mode M0 | |||
|---|---|---|---|
| Quadrant | BADHDUFLAG | Total packets | Discarded packets |
| A | 0 | 13713 | 2 |
| B | 0 | 20927 | 1 |
| C | 0 | 17068 | 1 |
| D | 0 | 20180 | 1 |
| Mode M9 | |||
|---|---|---|---|
| Quadrant | BADHDUFLAG | Total packets | Discarded packets |
| A | 0 | 11 | 0 |
| B | 0 | 11 | 0 |
| C | 0 | 11 | 0 |
| D | 0 | 11 | 0 |
| Quadrant | Total seconds | Saturated seconds | Saturation percentage |
|---|---|---|---|
| A | 6525 | 35 | 0.536398% |
| B | 6525 | 179 | 2.743295% |
| C | 6525 | 1089 | 16.689655% |
| D | 6525 | 266 | 4.076628% |
Noise dominated data is calculated using 1-second bins in cleaned event files. If a bin has >2000 counts, and if more than 50% of those come from <1% of pixels, then it is considered to be noise-dominated and hence unusable.
| Quadrant | # 1 sec bins | Bins with >0 counts | Bins with >2000 counts | High rate bins dominated by noise | Noise dominated (total time) | Noise dominated (detector-on time) | Marked lightcurve |
|---|---|---|---|---|---|---|---|
| A | 7565 | 6526 | 0 | 0 | 0.00% | 0.00% | 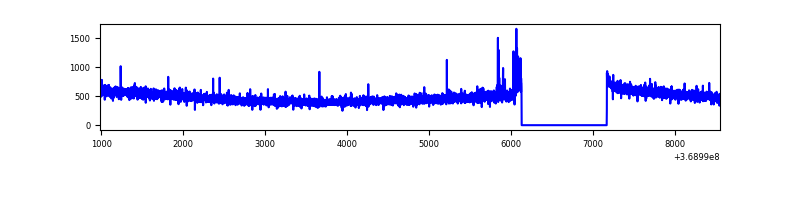 |
| B | 7565 | 6526 | 44 | 44 | 0.58% | 0.67% | 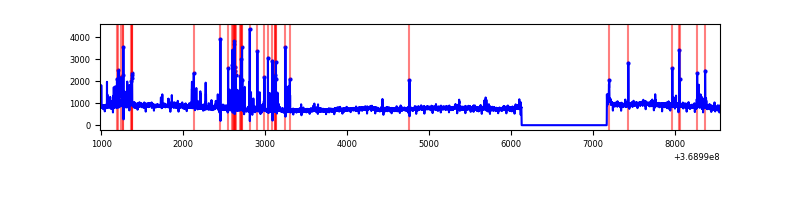 |
| C | 7565 | 6526 | 61 | 61 | 0.81% | 0.93% | 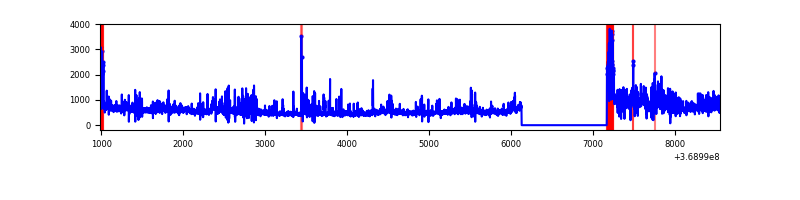 |
| D | 7565 | 6526 | 143 | 143 | 1.89% | 2.19% | 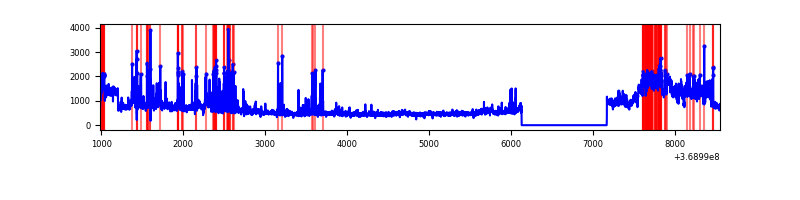 |
Top three noisy pixels from each quadrant. If the there are fewer than three noisy pixels in the level2.evt file, extra rows are filled as -1
| Pixel properties | Quadrant properties | ||||||
|---|---|---|---|---|---|---|---|
| Quadrant | DetID | PixID | Counts | Sigma | Mean | Median | Sigma |
| A | 12 | 96 | 23194 | 137.43 | 809 | 792 | 163.0 |
| A | 13 | 6 | 14394 | 83.45 | 809 | 792 | 163.0 |
| A | 13 | 254 | 12510 | 71.89 | 809 | 792 | 163.0 |
| B | 6 | 159 | 1942648 | 12840.83 | 799 | 778 | 151.2 |
| B | 12 | 18 | 114590 | 752.59 | 799 | 778 | 151.2 |
| B | 5 | 172 | 89053 | 583.73 | 799 | 778 | 151.2 |
| C | 14 | 238 | 376151 | 2207.91 | 730 | 736 | 170.0 |
| C | 14 | 254 | 340056 | 1995.63 | 730 | 736 | 170.0 |
| C | 3 | 233 | 336886 | 1976.98 | 730 | 736 | 170.0 |
| D | 8 | 195 | 1625101 | 8640.84 | 787 | 764 | 188.0 |
| D | 7 | 38 | 222921 | 1181.79 | 787 | 764 | 188.0 |
| D | 12 | 233 | 147982 | 783.14 | 787 | 764 | 188.0 |
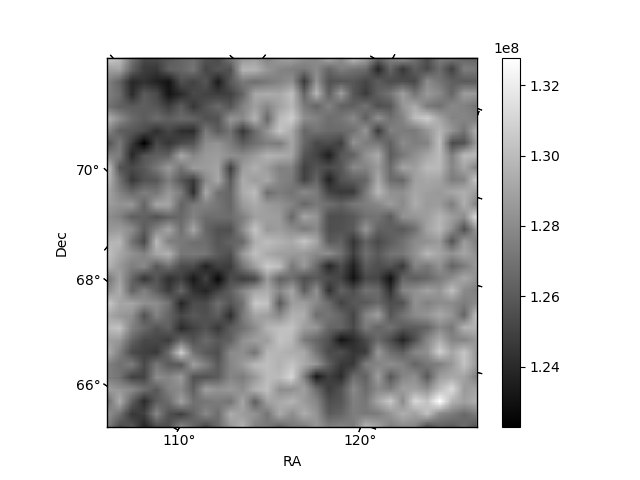
Histogram calculated using DETX and DETY for each event in the final _common_clean file
| Quadrant A | 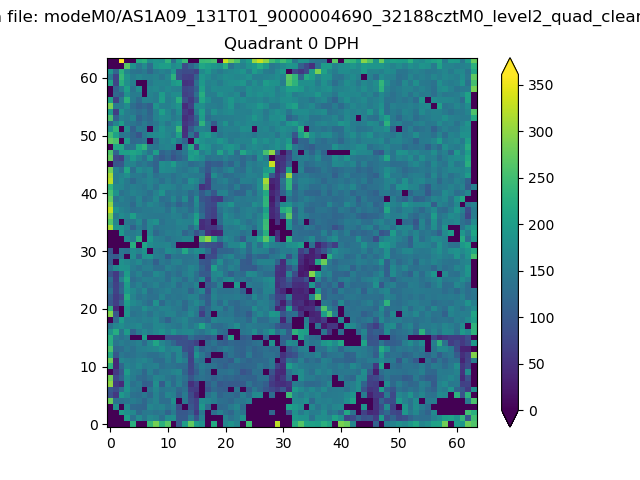 |
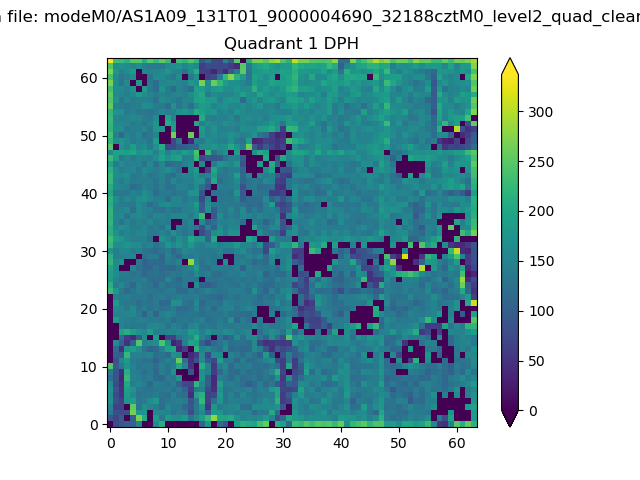 |
Quadrant B |
|---|---|---|---|
| Quadrant D | 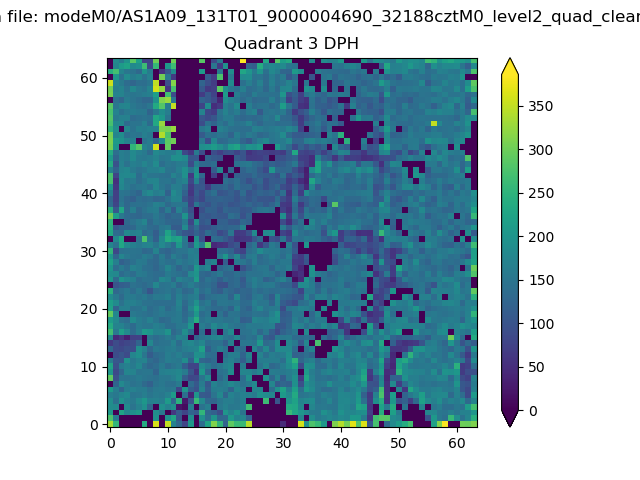 |
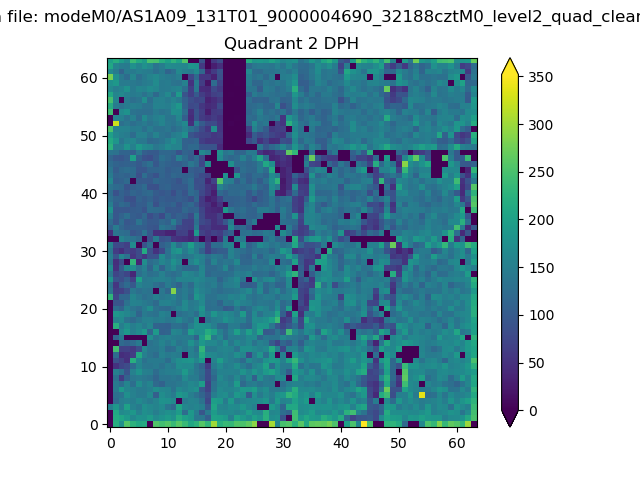 |
Quadrant C |
| Plot type | Count rate plots | Images |
|---|---|---|
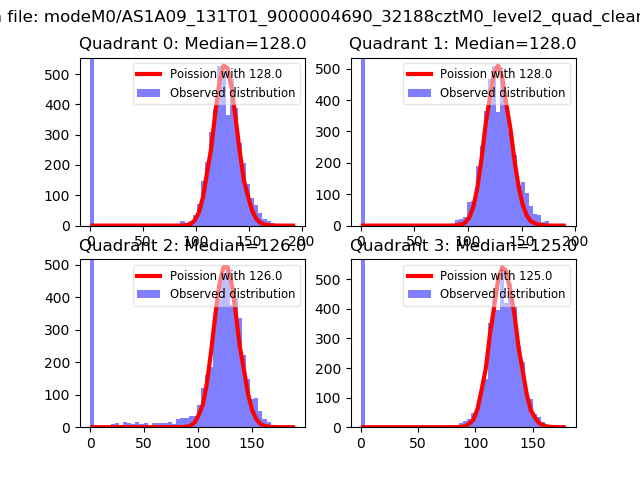
| Comparison with Poisson distribution Blue bars denote a histogram of data divided into 1 sec bins. Red curve is a Poisson curve with rate = median count rate of data. |
 |
 |
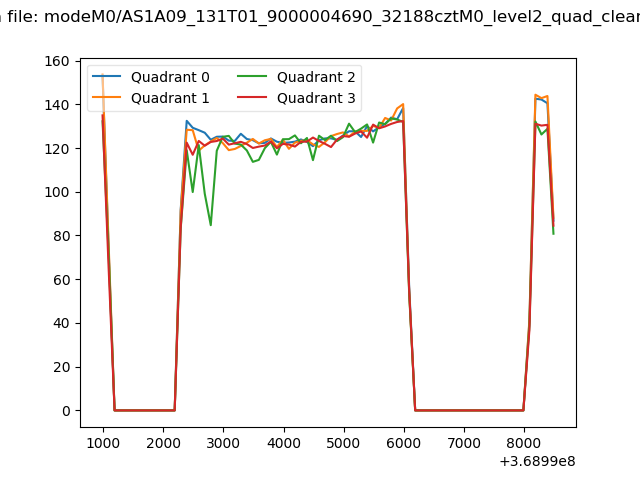
| Quadrant-wise count rates Data is divided into 100 sec bins |
 |
|
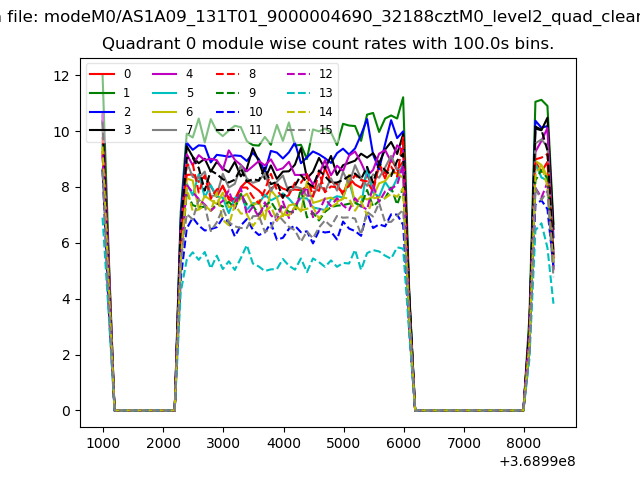
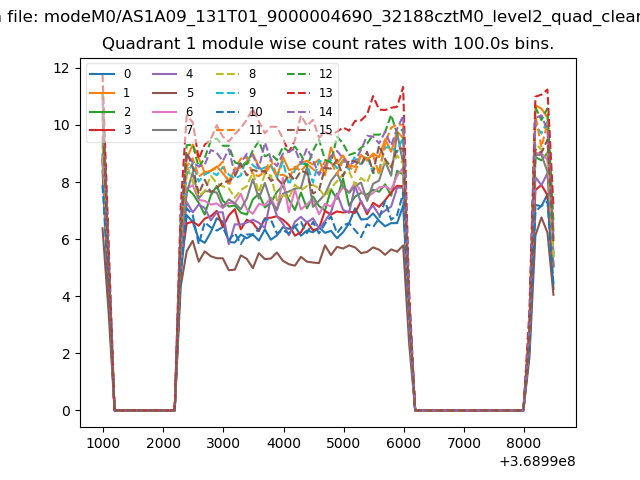
| Module-wise count rates for Quadrant A Data is divided into 100 sec bins |
 |
 |
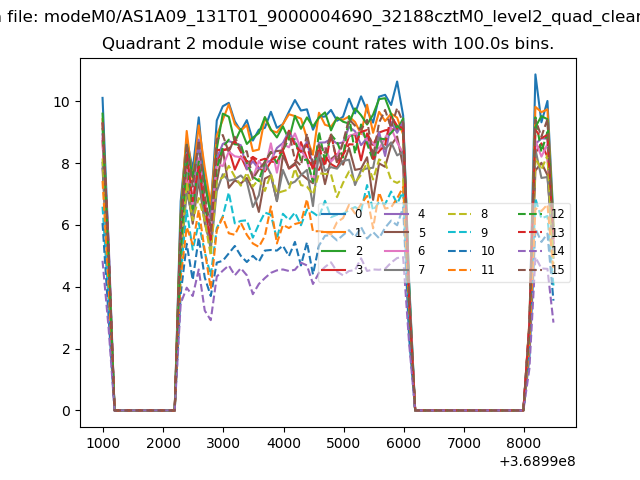
| Module-wise count rates for Quadrant B Data is divided into 100 sec bins |
 |
 |
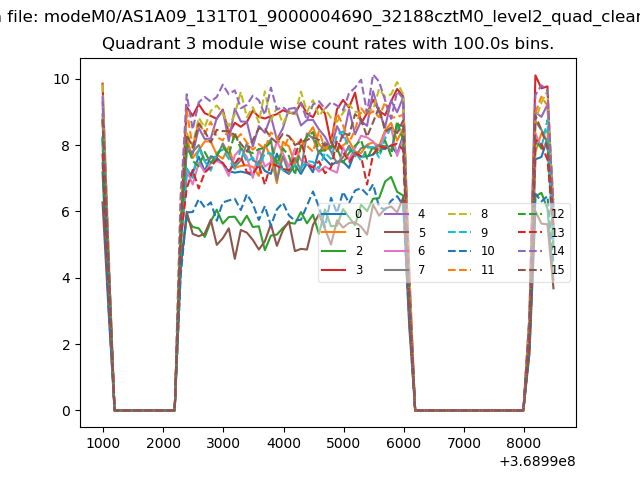
| Module-wise count rates for Quadrant C Data is divided into 100 sec bins |
 |
 |
| Module-wise count rates for Quadrant D Data is divided into 100 sec bins |
 |
 |
| Parameter | Plot |
|---|---|
| CZT HV Monitor |  |
| D_VDD | 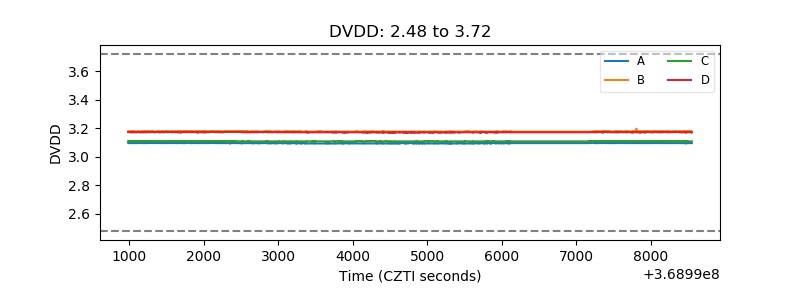 |
| Temperature 1 | 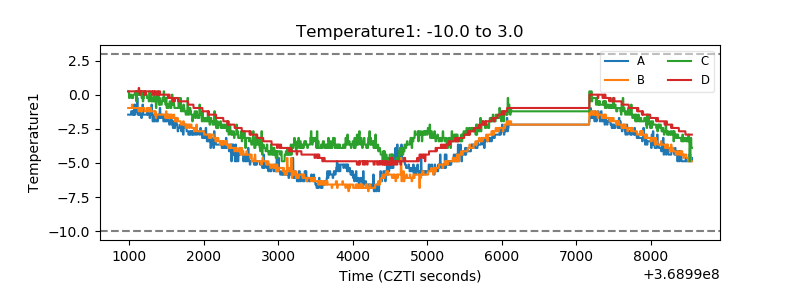 |
| Veto HV Monitor | 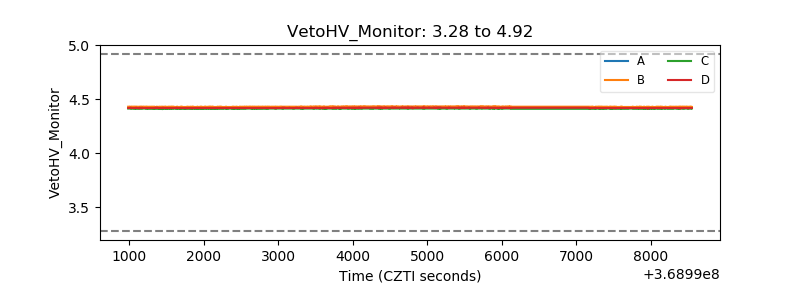 |
| Veto LLD | 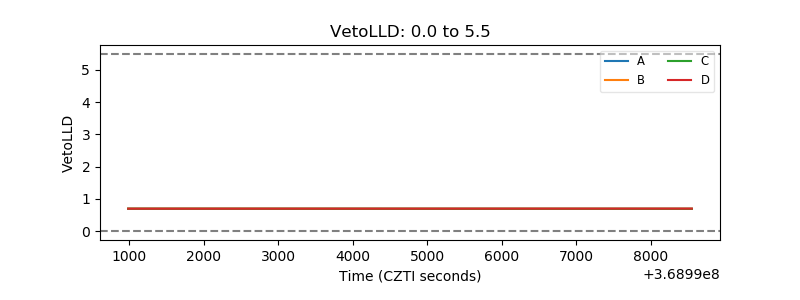 |
| Alpha Counter | 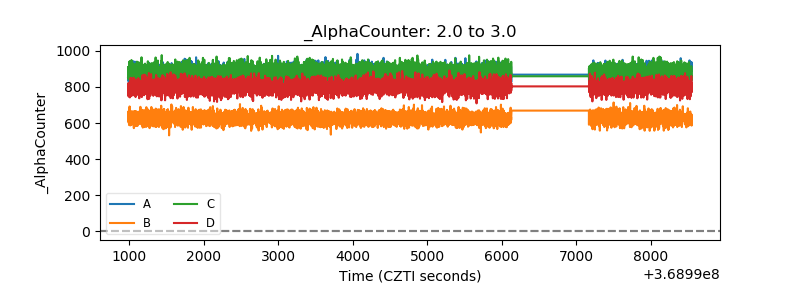 |
| _CPM_Rate | 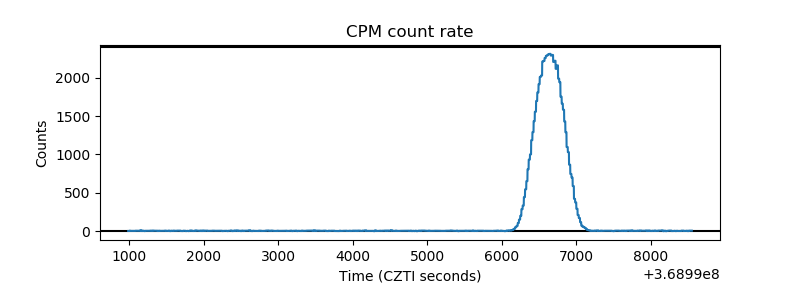 |
| CZT Counter | 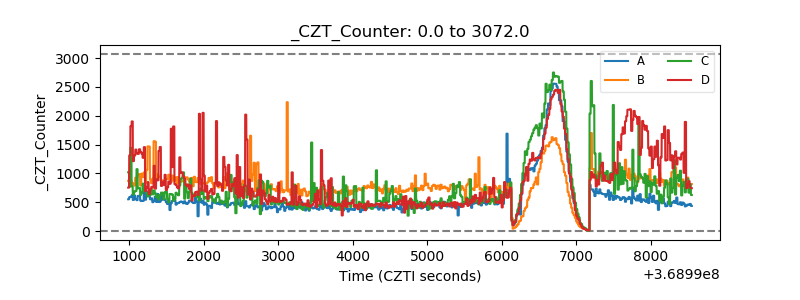 |
| +2.5 Volts monitor |  |
| +5 Volts monitor |  |
| _ROLL_ROT | 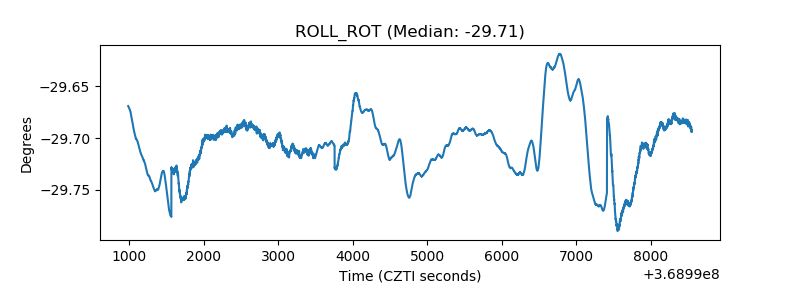 |
| _Roll_DEC | 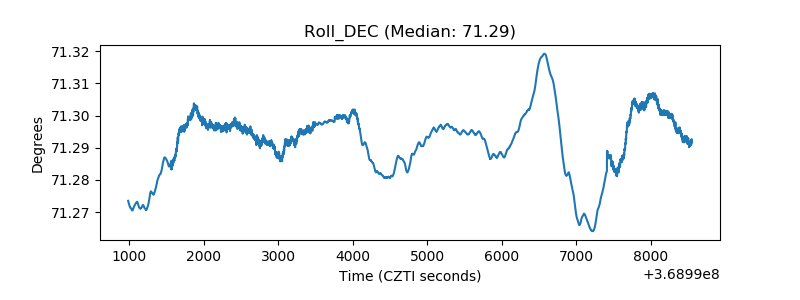 |
| _Roll_RA |  |
| Veto Counter | 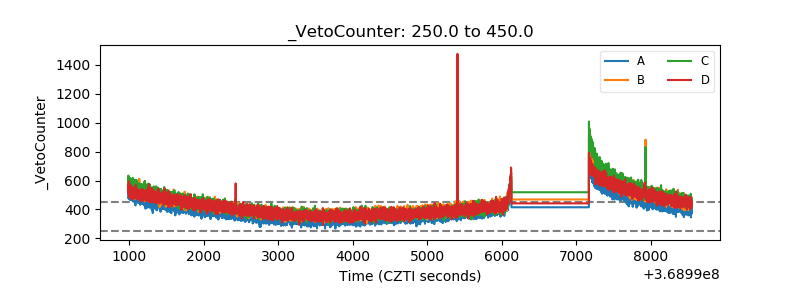 |